Full Terms & Conditions of access and use can be found at
http://www.tandfonline.com/action/journalInformation?journalCode=vjeb20
Download by: [Universitas Maritim Raja Ali Haji] Date: 11 January 2016, At: 20:48
Journal of Education for Business
ISSN: 0883-2323 (Print) 1940-3356 (Online) Journal homepage: http://www.tandfonline.com/loi/vjeb20
Does Missing Classes Decelerate Student Exam
Performance Progress? Empirical Evidence and
Policy Implications
Tin-Chun Lin
To cite this article: Tin-Chun Lin (2014) Does Missing Classes Decelerate Student Exam Performance Progress? Empirical Evidence and Policy Implications, Journal of Education for Business, 89:8, 411-418, DOI: 10.1080/08832323.2014.927343
To link to this article: http://dx.doi.org/10.1080/08832323.2014.927343
Published online: 04 Nov 2014.
Submit your article to this journal
Article views: 109
View related articles
Does Missing Classes Decelerate Student Exam
Performance Progress? Empirical Evidence
and Policy Implications
Tin-Chun Lin
Indiana University–Northwest, Gary, Indiana, USA
A total of 389 business students in undergraduate introductory microeconomics classes in spring 2007, 2009, and 2011, and fall 2012 participated in an exam performance progress study. Empirical evidence suggested that missing classes decelerates and hampers high-performing students’ exam performance progress. Nevertheless, the evidence does not indicate that gender is a factor in determining whether missing classes impedes students’ exam performance progress. Moreover, policy implications are discussed. For faculty, a mandatory attendance policy, daily motivational quiz, and incentive-stimulating attendance strategy are suggested. For school authorities, increasing campus employment opportunities is suggested. For the government, the author suggests that Congress should annually restore the purchasing power of federal grants by increasing the maximum grant awards and lowering federal student loan rates to half of present rates, but restrictions should be added on grant recipients to ensure that better attendance behaviors are achieved.
Keywords: attendance policy, exam performance progress, incentive-stimulating attendance strategy, missing classes, Pell Grant
The relationship between absenteeism (i.e., missing classes) and exam performance has been broadly investigated and discussed by education, psychology, and economics researchers (e.g., Brocato, 1989; Chen & Lin, 2008; Cohn & Johnson, 2006; Day, 1994; Jones, 1984; Krohn & O’Connor, 2005; Rocca, 2003; Rodgers, 2001; Romer, 1993; Van Blerkom, 1992). Nevertheless, the relationship between absenteeism and exam performance progress has not yet been investigated and discussed. Performance ress is different from just performance. Performance prog-ress shows a student’s development or growth of performance over different periods. That is, performance progress is a dynamic perspective, while performance is a static perspective. For that reason, it is possible that these two perspectives could reflect different effects. The follow-ing example may explain their difference.
For example, one student (Student 1), after missing three classes during the first exam period, scores 80 of 100 points on the first exam and receives a B grade, while another
student (Student 2) never misses class during the same exam period yet only scores 70 of 100 points on the same exam and receives a C grade. Thus, Student 1 might argue that an excellent record may not necessarily translate into an excellent grade. While Student 1’s argument may seem convincing, different conclusions may emerge upon a fur-ther examination of these two students’ subsequent scores on all exams.
Suppose that Student 1 then misses five classes during the second exam period and scores 82 points on the second exam and still receives a B grade; Student 2, still never missing class, scores 78 points on the second exam but still receives a C grade. Obviously, 82 (B grade) is definitely a higher score than 78 (C grade), so Student 1 could continue arguing that missing classes would not influence his/her grade. Student 1 may be smarter than Student 2, and Exam 2 may be easier than Exam 1, but the question here is, why did Student 1 only improve by two points while Student 2 improved by eight points? Although Student 1’s mance is still better than Student 2’s, Student 1’s perfor-mance progress is slower than Student 2’s. As is known, Student 1 skipped two more classes while Student 2 had a perfect attendance record. With this evidence, may I
Correspondence should be addressed to Tin-Chun Lin, Indiana Univer-sity–Northwest, School of Business and Economics, 3400 Broadway, Gary, IN 46408, USA. E-mail: [email protected]
ISSN: 0883-2323 print / 1940-3356 online DOI: 10.1080/08832323.2014.927343
conclude that improvements are due to skipped classes and missed information? That is, if Student 2 had skipped three and five classes in the first and second exam periods, respectively, would he or she have received even worse grades (D or F)?
The fallacy in Student 1’s argument is in looking at each individual instance rather than taking a comparative perspec-tive. That is, too often researchers only attend to each single exam rather than the difference between two exams to see a student’s development/growth. Thus, an investigation of this issue requires use of differencing data to examine how skipped classes affect each student’s performance progress.
In addition, it has been argued that higher quality students’ performance progress may not be influenced by skipped classes because, as better students, they can easily catch up on any missed information. For that reason, I also focus on high-performing students (A and B grades) to see whether missing in-classroom effort (i.e., skipped classes) affects their performance progress. Moreover, Woodfield, Jessop, and McMillan (2006) showed that male students are more likely to be absent from classes than female students; Cortright, Lujan, Cox, and DiCarlo (2011) found that gen-der significantly affects the impact of class attendance on exam achievement. Paise and Paise (2004) also showed a stronger correlation between male students’ exam perfor-mance and lecture attendance than was the case for female students. In light of previous empirical evidence, I sepa-rated data by gender to investigate whether gender matters in this issue.
I developed three research questions:
Research Question 1(RQ1):Does missing classes deceler-ate students’ exam performance progress?
RQ2: Do skipped classes also hamper high-performing
students’ exam performance progress?
RQ3:Can gender be a factor in determining whether
absen-ces impede students’ exam performance?
In light of these three questions, I formulated three hypotheses:
Hypothesis 1 (H1): Missing classes would decelerate students’ exam performance progress.
H2: Skipped classes would also hamper high-performing
students’ exam performance progress.
H3: Gender would be a factor in determining whether
absences impede students’ exam performance progress.
In addition to the investigation of the effect of missing classes on student exam performance progress, I discuss the policy implications of improving students’ class attendance. Actually, not only are instructors responsible for student attendance, but the school authority and government also are responsible for student attendance because they are all co-producers with students in constructing students’ knowledge
products. While there are various reasons for missing clas-ses, an economic reason, such as student employment due to financial hardship, may be one of the important ones that need to receive attention from policy makers. In a later sec-tion I offer survey evidence and policy suggessec-tions.
METHOD
Participants and Data Measurement
A total of 389 business students in undergraduate introduc-tory microeconomics classes in spring 2007, 2009, and 2011, and fall 2012 participated in this case study of exam performance progress. Each class met twice a week. No additional weekly review or tutorial classes were provided by graduate students. Daily attendance was taken, but there was no penalty for skipping classes. Students’ final grades depended on two midterm exams and one final exam. The exam scores were based on a 100-point scale. To conduct this experiment, the following were held constant: (a) only one teacher was chosen, which ensured the same instruc-tional style, teaching topics, and teaching materials (includ-ing the same textbook and handouts), and enabled me to better understand how attending behaviors differ across stu-dents given the same instructor; (b) stustu-dents were given complete freedom to make their own choices to attend or not to attend the class (i.e., no absence penalty, no atten-dance bonus, and no quizzes), which enabled me to deter-mine whether students behave differently regarding class attendance given complete freedom to make their own choices; (c) the same classroom was used with different sections each semester to ensure the same quality of the classroom; and (d) the same exams (midterm and final exams) were developed for different sections each semester to ensure that results would be consistent. It should be noted that all exams were collected when students turned in their answers, and students were not allowed to use cell phones during the exams. Hence, it was not possible for students to get information from a previous year’s exams.
In addition to instructor-reported data (i.e., students’ attendance record and three exam scores), one variable required student self-report—the out-of-classroom effort devoted to studying for the class during each exam period. Thus, I developed a questionnaire for distribution at each exam. A few minutes before each exam began the proctor handed the questionnaire to each student. No question was confidential; hence, all students were required to write down their names so that the self-reported data could be matched with the instructor-reported data. Students were asked: Overall, approximately how long did you study for the class during this exam period? There were five choices for the question: (1) I study 1–5 hr before the test; (2) I study 6–10 hr before the test; (3) I study 11–15 hr before the test; (4) I study 16–20 hr before the test; and (5) I study 412 T.-C. LIN
more than 20 hr before the test. It should be noted that I did not ask students to write down the number of hours devoted to studying for the class during the exam period because they might not precisely remember the exact number of hours and might leave it blank, but it might be easier for them to recall an extent they studied for the class. More-over, some may argue that bias could occur in self-reported data on extent of studying because students may deliber-ately upward-bias self-reporting in this context. As a matter of fact, bias would neither exist nor be significant due to differencing data. For example, suppose a student always deliberately upward-biased his self-reporting in the context, say 3, 4, and 5 for Exams I, II, and III, respectively (assum-ing the actual scale would be 2, 3, 4). After differentiat(assum-ing
the data, the difference becomes 1 (4¡3D1) and 1 (5¡
4D1), which is the same as 1 (3¡2D1) and 1 (4¡3D
1).
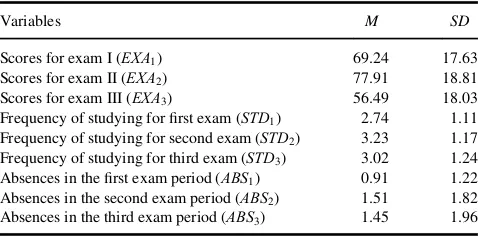
In addition, Table 1 reports means and standard devia-tions for the variables used in this study. Moreover, the reli-ability (i.e., Cronbach’s alpha) of exams was measured. Cronbach’s alpha was .84, which is high and indicates strong internal consistency among these exams. Further, it should be noted that the exam scores for each exam used in this study were original scores without curves.
Econometric Models
According to the hypotheses expressed previously, I devel-oped two econometric models to investigate whether or not missing classes decelerates student exam performance progress. I use differencing data for these two models, which can be shown as the following equations:
Model 1:EXAit¡EXAit¡1Db0Cb1ðABSit¡ABSit¡1Þ
STDit Dstudent i’s frequency of studying for the class at the exam periodt;STDitDstudenti’s frequency of study-ing for the class at the exam periodt¡1; andeDstochastic
disturbance with a mean 0 and a variance s2. Note that
Model 2 (i.e., Equation 2) enables me to compare the differ-ence between two exams in a longer period, say the first exam period and the third exam period. Some students may not make significant progress in a shorter period, but they may make more significant progress over a longer period. In these formulations, the null hypothesis is that the param-eters estimated by coefficientsb1andb2are zero, while the alternative hypothesis is that the parameters are not zero. If skipped classes decelerate student performance progress, b1<0 and the effect should be statistically significant in
these two models.
In addition, the main advantage of using differencing data is to eliminate the unobserved individual effect. The absenteeism-performance model may consist of individual unobserved heterogeneity variables (e.g., motivation, genetics, ability, habits) that would develop individual spe-cific effects. Namely, these unobserved variables might influence a student’s exam performance while being associ-ated with the student’s absenteeism behavior. Because these individual unobserved heterogeneity variables are all time-invariant variables, the best solution is to use differencing data so that I may eliminate the unobserved individual effect. This explains why student quality and behavioral variables (e.g., motivation to complete a degree, motivation to get a good grade, graduate school aspirations, importance of success in life, student perception of instructor, percep-tion of grading difficulty, perceppercep-tion of teaching and learn-ing style congruence, self-conception of ability) are not displayed in the models.
Moreover, the difficulty level of each exam may be dif-ferent. Thus, I standardized students’ original exam scores intoZscores (ZDx¡x=s; wherexDoriginal exam score,
xD the sample mean score, and sDthe sample standard
deviation). I usedZEXinstead ofEXAto stand for students’ exam Z scores and then plug it into Equations 1 and 2. I show both results (i.e., original scores andZscores) to see if there is a difference when standardizing and not standard-izing students’ exam scores.
RESULTS
Hypothesis 1
Null hypothesis: Students’ absence increments and exam performance progress are not related.
Alternative hypothesis: Students’ absence increments and exam performance progress are related.
TABLE 1
Means and Standard Deviations of Variables
Variables M SD
Scores for exam I (EXA1) 69.24 17.63 Scores for exam II (EXA2) 77.91 18.81 Scores for exam III (EXA3) 56.49 18.03 Frequency of studying for first exam (STD1) 2.74 1.11 Frequency of studying for second exam (STD2) 3.23 1.17
Frequency of studying for third exam (STD3) 3.02 1.24
Absences in the first exam period (ABS1) 0.91 1.22
Absences in the second exam period (ABS2) 1.51 1.82
Absences in the third exam period (ABS3) 1.45 1.96
To evaluate H1, which had to do with the relationship between exam performance progress and absence incre-ments, I created Equations 1 and 2. The results for Equa-tions 1 and 2 for all students are reported in Table 2. As
Table 2 shows, for original scores and Z scores, the null
hypothesis that students’ absence increments and exam per-formance progress are not related was rejected because the former exerted a negative and statistically significant effect on exam performance progress at the 1% level in all Col-umns 1–6, implying that skipping classes does decelerate student exam performance progress no matter whether the exam scores are standardized. In addition, the evidence for original scores shows that one additional absence increment was estimated to reduce exam performance progress by approximately between 1.08 and 1.76 points in the all-students group.
Therefore, H1 was supported. Missing classes will
decelerate students’ exam performance progress.
Hypothesis 2
Null hypothesis:High-performing students’ absence incre-ments and their exam performance progress are not related.
Alternative hypothesis:High-performing students’ absence increments and their exam performance progress are related.
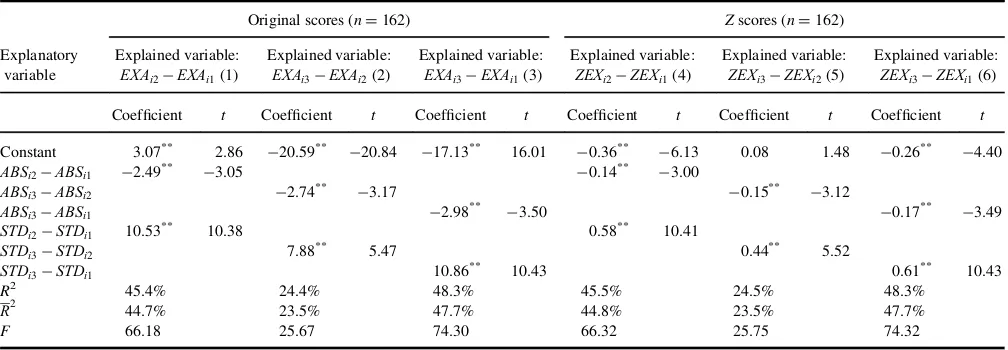
To evaluateH2, I particularly focused on high-perform-ing students who received a B or higher grades for the course. The results for Equations 1 and 2 for high-perform-ing students are presented in Table 3. As Table 3 shows,
TABLE 2
Regression Results for All Students (ND389)
Original scores Zscores Explanatory
variable
Explained variable:
EXAi2¡EXAi1(1)
Explained variable:
EXAi3¡EXAi2(2)
Explained variable:
EXAi3¡EXAi1(3)
Explained variable:
ZEXi2¡ZEXi1(4)
Explained variable:
ZEXi3¡ZEXi2(5)
Explained variable:
ZEXi3¡ZEXi1(6)
Coefficient t Coefficient t Coefficient t Coefficient t Coefficient t Coefficient t
Constant 3.97** 5.23 ¡19.46** ¡28.41 ¡14.64** ¡21.89 ¡0.26** ¡6.20 0.11** 2.90 ¡0.11** ¡2.83
ABSi2¡ABSi1 ¡1.30** ¡2.99 ¡0.06** ¡2.57
ABSi3¡ABSi2 ¡1.08** ¡2.56 ¡0.06** ¡2.66
ABSi3¡ABSi1 ¡1.76** ¡4.65 ¡0.10** ¡4.47
STDi2¡STDi1 11.34** 15.58 0.62** 15.28
STDi3¡STDi2 10.02** 10.88 0.55** 11.02
STDi3¡STDi1 10.09** 15.97 0.56** 15.81
R2 41.0% 27.0% 46.5% 39.8% 27.6% 45.8%
R2 40.7% 26.6% 46.2% 39.4% 27.2% 45.5%
F 134.28 71.40 167.61 127.38 73.60 163.03
**p<.01.
TABLE 3
Regression Results for High-Performing Students
Original scores (nD162) Zscores (nD162) Explanatory
variable
Explained variable:
EXAi2¡EXAi1(1)
Explained variable:
EXAi3¡EXAi2(2)
Explained variable:
EXAi3¡EXAi1(3)
Explained variable:
ZEXi2¡ZEXi1(4)
Explained variable:
ZEXi3¡ZEXi2(5)
Explained variable:
ZEXi3¡ZEXi1(6)
Coefficient t Coefficient t Coefficient t Coefficient t Coefficient t Coefficient t
Constant 3.07** 2.86 ¡20.59** ¡20.84 ¡17.13** 16.01 ¡0.36** ¡6.13 0.08 1.48 ¡0.26** ¡4.40
ABSi2¡ABSi1 ¡2.49** ¡3.05 ¡0.14** ¡3.00
ABSi3¡ABSi2 ¡2.74** ¡3.17 ¡0.15** ¡3.12
ABSi3¡ABSi1 ¡2.98** ¡3.50 ¡0.17** ¡3.49
STDi2¡STDi1 10.53** 10.38 0.58** 10.41
STDi3¡STDi2 7.88** 5.47 0.44** 5.52
STDi3¡STDi1 10.86** 10.43 0.61** 10.43
R2 45.4% 24.4% 48.3% 45.5% 24.5% 48.3%
R2 44.7% 23.5% 47.7% 44.8% 23.5% 47.7%
F 66.18 25.67 74.30 66.32 25.75 74.32
**p<.01.
414 T.-C. LIN
for original scores and Z scores, the null hypothesis that high-performing students’ absence increments and their exam performance progress are not related was rejected because absence increments exerted a negative and statisti-cally significant effect on exam performance progress at the 1% level in Columns 1–6, implying that skipped classes also hamper high-performing students’ exam performance progress no matter whether the exam scores are standard-ized. The evidence for original scores suggests that one additional absence increment was estimated to decrease exam performance progress by approximately between 2.5 and 3.0 points in the high-performing students group.
In summary, H2 was supported. Skipped classes also
hamper high-performing students’ exam performance progress.
Hypothesis 3
Null hypothesis:Male and female students’ absence incre-ments and exam performance progress are related.
Alternative hypothesis: Not male and female students’ absence increments and exam performance progress are related.
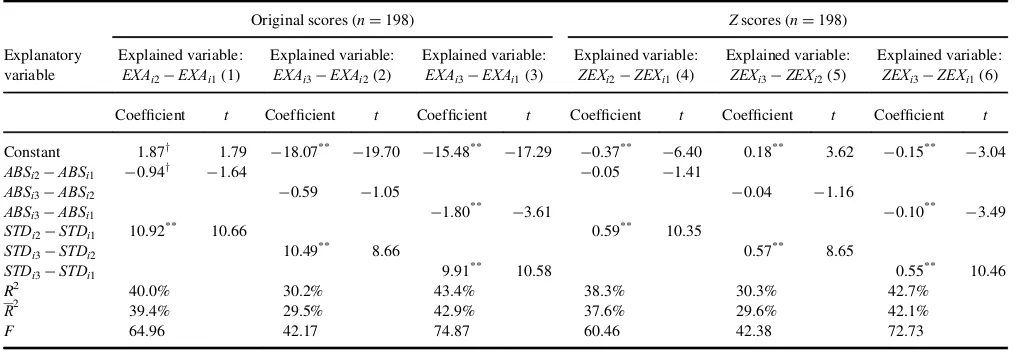
To evaluateH3, I separated data by gender. The results for Equations 1 and 2 for male students are reported in Table 4. As Table 4 shows, for original scores andZscores, except for Columns 2, 4, and 5, absence increments exerted a negative and statistically significant effect on exam per-formance progress at the 10% level in Column 1 and the 1% level in Columns 3 and 6, indicating that skipped clas-ses may also impede male students’ exam performance progress. In addition, the evidence implies that male students’ exam performance progress seems more likely to
be negatively influenced by absences over a longer period than a shorter period.
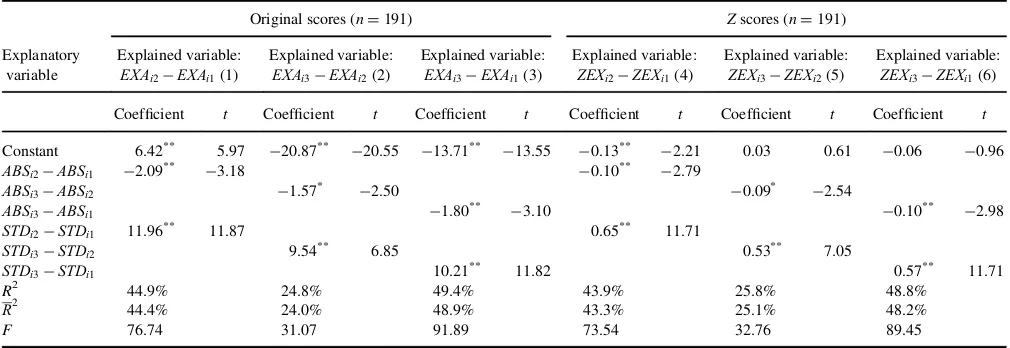
Similarly, the results for Equations 1 and 2 for female students are presented in Table 5. As Table 5 shows, for original scores andZscores, absence increments exerted a negative and statistically significant effect on exam perfor-mance progress at the 1% level in Columns 1, 3, 4, and 6 and at the 5% level in Columns 2 and 5, implying that skip-ping classes does impede female students’ exam perfor-mance progress as well, no matter whether the exam scores are standardized. Overall, the empirical evidence shows that male and female students’ exam performance progress would be negatively influenced by missing classes.
Consequently, H3 was not supported because the
evi-dence does not suggest that gender is a factor in determin-ing whether absences impede students’ exam performance progress.
POLICY IMPLICATIONS
The present results offer sufficient empirical evidence to support the belief that missing classes decelerates exam performance progress by students. Because absenteeism adversely affects exam performance progress, do educators have a policy or strategy to improve student attendance? An enforced mandatory attendance policy may be consid-ered by most educators. A study by Marburger (2006) showed that an enforced mandatory attendance policy sig-nificantly improves student attendance and grades, but he did not find a significant effect of attendance policy on stu-dent performance on the first exam while the effect became more significant on the second and third exams. Moreover, those students who were reluctant to attend class showed up because of the enforced policy—they probably did not intend to pay attention anyway. Thus, their perfect
TABLE 4
Regression Results for Male Students
Original scores (nD198) Zscores (nD198) Explanatory
variable
Explained variable:
EXAi2¡EXAi1(1)
Explained variable:
EXAi3¡EXAi2(2)
Explained variable:
EXAi3¡EXAi1(3)
Explained variable:
ZEXi2¡ZEXi1(4)
Explained variable:
ZEXi3¡ZEXi2(5)
Explained variable:
ZEXi3¡ZEXi1(6)
Coefficient t Coefficient t Coefficient t Coefficient t Coefficient t Coefficient t
Constant 1.87y 1.79 ¡18.07** ¡19.70 ¡15.48** ¡17.29 ¡0.37** ¡6.40 0.18** 3.62 ¡0.15** ¡3.04
ABSi2¡ABSi1 ¡0.94y ¡1.64 ¡0.05 ¡1.41
ABSi3¡ABSi2 ¡0.59 ¡1.05 ¡0.04 ¡1.16
ABSi3¡ABSi1 ¡1.80** ¡3.61 ¡0.10** ¡3.49
STDi2¡STDi1 10.92** 10.66 0.59** 10.35
STDi3¡STDi2 10.49** 8.66 0.57** 8.65
STDi3¡STDi1 9.91** 10.58 0.55** 10.46
R2 40.0% 30.2% 43.4% 38.3% 30.3% 42.7%
R2 39.4% 29.5% 42.9% 37.6% 29.6% 42.1%
F 64.96 42.17 74.87 60.46 42.38 72.73
yp<.10.**p<.01.
attendance record did not seem to exert positive and signifi-cant effects on their grade performance.
I do not disagree with an enforced mandatory attendance policy because while it may serve to improve students’ attendance, nobody can guarantee that the policy will also enhance students’ in-classroom effective efforts. As long as student attendance improves, students will have a better chance of doing well on exams and receiving better grades. In addition to an enforced mandatory attendance policy, some researchers have suggested a better solution to improving student preparation, attendance, and participa-tion. For example, Braun and Sellers (2012) gave students a short daily quiz at the beginning of each class. Those daily quizzes only included easy-to-grade conceptual questions that students should be able to answer. The main purpose of the daily motivational quiz was to provide students opportunities to read the assigned textbook pages. They found that the daily motivational quiz did significantly enhance student preparation, attendance, and participation. With regard to a daily quiz, Liebler (2003) reported the same finding. He concluded that a 5-min daily quiz is an effective use of class time requiring students to attend each class prepared and motivated to learn.
In addition to the daily quiz, alternatively, I suggest that an incentive-stimulating attendance strategy may be substi-tuted for an enforced mandatory attendance policy. If instructors can increase the price of absence and reduce the price of getting a grade, students’ absences will decrease and grades will increase. For example, instructors may cre-ate 25–30% of questions from class lectures (e.g., some essay questions and problems are the same examples pro-vided in class, but are not found in the textbook). Students who were absent may not be able to answer those questions, implying that the opportunity cost of missing the class has become more expensive but the opportunity cost of getting
a grade is cheaper. In addition, instructors sometimes can grant students an attendance bonus that is added to their midterm and final exams. In doing so, students deeply feel the effects of missed benefits due to absence, meaning that the opportunity cost of missing the class is even higher while the opportunity cost of getting a grade is even lower. Continuing with exam construction, instructors could create 50–60% of the questions from the weekly study-guide and exercises. Doing so makes studying for exams easier, reducing the opportunity cost of studying. Further, instruc-tors who give students an attendance bonus and base 25– 30% of questions on class lectures will see a decrease in the price of grades because students who were not absent will receive higher grades. Consequently, the price of absences will go up and the price of grades will go down.
Moreover, in addition to the faculty, are the school authority and the government responsible for student atten-dance? As a matter of fact, they are, because the faculty, the school authority, and the government are all co-pro-ducers with students in constructing students’ knowledge products. The school authority provides school policies and a learning environment while the government finances state universities and provides education policies that affect stu-dent learning behavior and faculty teaching incentives. The following survey evidence reveals how student learning behavior may be indirectly influenced by the state of the economy and the government’s education policy.
Paisey and Paisey (2004) surveyed students at a Scottish university and found that part-time employment was the main reason for skipping classes. Students sought employ-ment largely due to financial hardship, implying that with-out financial support students would not be able to successfully complete a degree. In 2002, King and Bannon reported an important survey finding—74% of university and college full-time U.S. students work while attending
TABLE 5
Regression Results for Female Students
Original scores (nD191) Zscores (nD191)
Coefficient t Coefficient t Coefficient t Coefficient t Coefficient t Coefficient t
Constant 6.42** 5.97 ¡20.87** ¡20.55 ¡13.71** ¡13.55 ¡0.13** ¡2.21 0.03 0.61 ¡0.06 ¡0.96
F 76.74 31.07 91.89 73.54 32.76 89.45
*p<.05.**p<.01.
416 T.-C. LIN
school, 46% of all full-time working students work 25 or more hours per week, and 20% of all full-time working stu-dents work 35 or more hours per week. Among this group of students, 42% reported that working damaged their grades, 53% of all full-time working students admitted that work limited their class schedule, and 38% reported that employment limited their class choice—63% of all full-time working students claimed that they would not be able to afford college if they did not work. In addition, an online survey was conducted for a regional university in Indiana in spring 2013. According to the results: (a) 84% worked either part-time or time while attending school; of full-time working students, (b) 49% ever missed class due to a work schedule; (c) 54% ever attended class late or left class early due to a work schedule; (d) 69% would choose to go to work if their work schedule conflicted with their class schedule; and (e) a total of nearly 81% reported not being able to afford college if they did not work.
This survey evidence implies an important issue—due to financial hardship, students have to work while attending school; without financial support students will not be able to successfully complete a degree. That is, if students have to choose lose the job or lose a higher grade, students will choose lose a higher grade. Therefore, even though instruc-tors adopt an enforced mandatory attendance policy via penalty, many students still will choose to skip classes and keep their jobs. This dilemma definitely cannot be resolved by instructors. The government and the school authority need to take responsibility for assisting students.
According to a College Board report in 2012, public uni-versities’ tuition and fees alone rose 4.8%. Tuition hikes result from stagnant growth in federal aid and increases in other expenses that push public college costs to new heights—this occurred again in academic year 2012–2013. In addition, while one type of federal loan is available at a 3.4% interest rate, others cost 6.8%, while loans for parents and graduate students are 7.9%. Private loans from banks are even more expensive. The question here is: why are these loan rates so high?
Tuition hikes and high loan rates may be two of the main impetuses for job seeking by students. Therefore, to improve students’ attendance, it is necessary to reduce their workload. That is, the government and school authority need to assist students to reduce their college costs. Actu-ally, the federal government has offered various types of need-based grant aid to help students reduce their college costs and workload. According to King and Bannon’s report in 2002, students are less likely to work 25 or more hours per week when they receive more need-based aid. Unfortunately, due to federal grant aid frequently failing to keep pace with rising costs and purchasing power of key programs (e.g., Pell Grant), many students must work lon-ger hours to cover college costs. For example, from 1981– 1982 to 2000–2001, average grant aid per student as a
per-centage of average tuition and fees declined by
approximately 33% (King and Bannon, 2002). This implies that while large increases in federal grant aid and tax bene-fits cushioned the impact of rising tuition prices, total grant aid for students indeed did not really increase.
I understand that this issue is complicated and requires more detailed and scientific investigation, but I intend to share these policy suggestions with readers in future research. The policy suggestions for the government and school authority on this issue are the following:
I urge Congress to take responsibility for keeping fed-eral grant aid apace with rising costs and the purchas-ing power of key programs, such as Pell Grants. A Pell Grant is money provided by the U.S. federal gov-ernment to students who need help paying for college. President Barack Obama has requested an increase in U.S. education spending to almost $70 billion. This significant jump is needed in part to pay for Pell Grants for needy college students. Overall, he has pro-posed raising Pell funding by more than $5 billion. However, the maximum grant has not kept pace with rising college tuition and even inflation. Thus, I strongly urge Congress to take responsibility for annual restoration of the Pell Grant’s purchasing power by increasing the maximum award.
While restoring the Pell Grant’s purchasing power, I
also suggest that the government needs to add some restrictions on Pell grant recipients to achieve better attendance behaviors. It is possible that grant recipi-ents still undertake a work assignment or take too many credits and therefore still miss too many classes. Therefore, a contract with grant recipients must be made to ensure that they will not go ahead and work anyway or take too many credits. In addition, faculty members who teach grant recipients should receive the names of those recipients; these faculty members should be required to report those students’ attendance records regularly to the government. For example, if the student’s absenteeism rate is over a certain rate (e.g., 10%), the student’s grant is suspended immedi-ately. Taking this step will lead to the desirable behav-ior of better attendance.
High loan rates may discourage students from
borrow-ing money or induce them to seek employment. Hence, I also urge Congress to lower federal student loan rates to half of present rates.
Opportunities to work on campus while attending
school lessen students’ likelihood of missing class or of late attendance due to better proximity to their job locations and a lowered chance for other unexpected accidents. I urge the school authority to offer more on-campus job opportunities to students rather than hiring external workers because doing so will finan-cially assist students and allow them to maintain good attendance.
CONCLUSION
In the case study described here, 389 business students in undergraduate introductory microeconomics classes in spring 2007, 2009, and 2011, and fall 2012 participated in an exam performance progress study. Differencing data were used to develop two models. The advantage of using differencing data is the ability to delete the unobserved individual effect. Three hypotheses were developed and tested. Empirical evidence suggested that missing classes
decelerates students’ and hampers high-performing
students’ exam performance progress. However, the evi-dence does not indicate that gender is a factor in determin-ing whether missdetermin-ing classes impede students’ exam performance progress.
Finally, I offered thoughts on the policy implications of improving students’ attendance. Indeed, the faculty, school authority, and federal government all play a role in students’ class attendance because they are all co-producers with students of knowledge products. For faculty, in addi-tion to an enforced mandatory attendance policy, a daily motivational quiz and an incentive-stimulating attendance strategy were suggested as alternative methods of improving students’ preparation, attendance, participation, and grades. For the school authority, offering students more on-campus job opportunities would financially assist them and help them to maintain good attendance records. For the govern-ment, it was suggested that Congress take responsibility for annual restoration of the Pell Grant’s purchasing power by increasing the maximum grant award and lowering federal student loan rates to half of present rates. I also suggested that the government take steps to ensure that grant recipi-ents manifest better attendance behaviors by adding certain performance-related restrictions. For instance, students may be required to stay under a certain absenteeism rate or risk immediate suspension of their grant.
REFERENCES
Braun, K. W., & Sellers, R. D. (2012). Using a “Daily Motivational Quiz” to increase student preparation, attendance, and participation.Issues in Accounting Education,27, 267–279.
Brocato, J. (1989). How much does coming to class matter? Some evidence of class attendance and grade performance.Educational Research Quar-terly,13(3), 2–6.
Chen, J., & Lin, T. F. (2008). Class attendance and exam performance: A randomized experiment.Journal of Economic Education,39, 213–227. Cohn, E., & Johnson, E. (2006). Class attendance and performance in
prin-ciples of economics.Education Economics,14, 211–233.
Cortright, R., Lujan, L. H., Cox, J. H., & DiCarlo, S. E. (2011). Does sex (female versus male) influence the impact of class attendance on exami-nation performance?Advance in Physiology Education,35, 416–420. Day, S. (1994). Learning in large sociology classes: Journals and
atten-dance.Teaching Sociology,22, 151–165.
Jones, H. (1984). Interaction of absences and grades in a college course.
Journal of Psychology,116, 133–136.
King, T., & Bannon, E. (2002).At what cost? The price that working stu-dents pay for a college education. Washington, DC: State PIRGs’ Higher Education Project.
Krohn, G. A., & O’Connor, C.M. (2005). Student effort and performance over the semester.Journal of Economic Education,36, 3–28.
Liebler, R. J. (2003). The five-minute quiz.Journal of Accounting Educa-tion,21, 261–265.
Marburger, R. (2006). Does mandatory attendance improve student perfor-mance?Journal of Economic Education,37, 99–110.
Paisey, C., & Paisey, N. (2004). Student attendance in an accounting mod-ule—Reasons for non-attendance and the effect on academic perfor-mance at a Scottish University.Accounting Education,13(Suppl. 1), 39–53.
Rocca, K. (2003). Student attendance: A comprehensive literature review.
Journal on Excellence in College Teaching,14, 85–107.
Rodgers, R. (2001). A panel-data study of the effect of student attendance on university performance.Australian Journal of Education,45, 284– 295.
Romer, D. (1993). Do students go to class? Should they?Journal of Eco-nomic Perspectives,7, 167–174.
Van Blerkom, L. (1992). Class attendance in an undergraduate course.
Journal of Psychology,126, 487–494.
Woodfield, R., Jessop, D., & McMillan, L. (2006). Gender difference in undergraduate attendance rates.Studies in Higher Education,31, 1–22.
418 T.-C. LIN