The Differing Nature of Black-White
Wage Inequality Across
Occupational Sectors
David Bjerk
a b s t r a c t
The nature of racial wage inequality appears to differ across occupation sectors. Specifically, I find that all of the racial wage inequality in the white-collar job sector can be accounted for by controlling for the academic skill level of each worker, but almost half of the overall racial wage inequality remains in the blue-collar sector after controlling for each worker’s academic skill. Relatedly, after controlling for academic skill, I find that black workers are actually more likely to work in the white-collar sector than white workers. I show that these findings are consistent, and arguably directly implied by, both preference-based and statistical-based models of discrimination. However, omitted variable bias and measurement error also cannot be ruled out as possible explanations.
I. Introduction
It is well known that black Americans earn less than white Ameri-cans. In attempting to understand the underlying causes of such wage inequality, many economists have pointed to current and historical racial inequalities in school-ing and the acquisition of academic skills. While there is little doubt that such racial differences in academic skills are a key factor contributing to continued wage differ-ences between blacks and whites, the results of this paper suggest that such academic skill differences may not be the whole story. In particular, while racial differences in premarket academic skills appear to fully account for the current levels of wage in-equality between black and white males in the white-collar job sector, racial wage inequality in blue-collar jobs may be substantially more complicated.
David Bjerk is an assistant professor of economics at McMaster University and RAND Corporation. He thanks James Andreoni, Meta Brown, Maria Cancian, Arnaud Chevalier, Tom Crossley, John Kennan, Lance Lochner, David Loughran, Derek Neal, Menesh Patel, Aloysius Siow, James R. Walker, the participants of the 2003 SOLE conference, the University of Toronto Applied Microeconomics Seminar, and RAND for helpful comments on earlier drafts. The data used in this paper can be obtained October 2007 through September 2010 from David Bjerk, RAND Corp. 1776 Main Street, P.O. Box 2138, Santa Monnica, CA 90407, <bjerkd@mcmaster.ca>
[Submitted January 2006; accepted July 2006]
ISSN 022-166X E-ISSN 1548-8004Ó2007 by the Board of Regents of the University of Wisconsin System
As alluded to above, numerous authors have shown that racial differences in aca-demic skills are a key factor for understanding racial wage inequality. For example, authors such as Welch (1973) and Card and Krueger (1992) provide convincing ev-idence that a significant fraction of the overall racial wage inequality observed in the United States throughout the 20th century can be attributed to dramatically unequal public schooling between blacks and whites, especially in Southern states, during in the earlier decades of the century. Further evidence of the continued importance of racial differences in academic skills in the context of racial wage inequality is pre-sented by O’Neill (1990) and Neal and Johnson (1996). Indeed, Neal and Johnson (1996) show that of a roughly 25 percent gap in mean wages between white and black men in the early 1990s, almost three-fourths of it can be accounted for by ra-cial differences in premarket academic skills (as measured by AFQT scores). In gen-eral, the evidence strongly suggests that educational discrepancies between whites and blacks have been an extremely important source of the observed racial wage in-equality throughout U.S. history to the present day.
However, even in Neal and Johnson’s (1996) analysis, there still remains a signif-icant unexplained racial wage gap of roughly 7 percent. This paper looks more closely at this remaining unexplained gap. To do so, I first examine racial wage in-equality separately by occupation, both overall and after conditioning on academic skill. The results that arise from dividing the labor market up in this manner reveal some interesting findings that are not apparent when examining the labor market as a whole. Specifically, overall racial inequality is substantially smaller in ‘‘white-collar’’ type occupations than in ‘‘blue-collar’’ type occupations. Moreover, all of the wage in-equality in white-collar type occupations can be accounted for by racial differences in measured premarket academic skill, while only about half of the overall inequality in blue-collar type occupations can be accounted for by such measured academic skill dif-ferences. In other words, all of the racial wage inequality that remains in the overall la-bor market after controlling for premarket academic skill comes from workers working in blue-collar type occupations.
The second part of this paper considers what explanations may potentially account for these differing results across occupational sectors. The first explanation that I consider is discrimination. The second explanation I consider is the existence of an omitted variable bias. Finally, the third explanation I consider relates to the poten-tial role played by measurement error.
The plausibility of a discrimination explanation comes directly from the fact that general academic skills are much more important for productivity in white-collar jobs than blue-collar jobs. Such differences in skill intensity across sectors suggest two rea-sons why discrimination might arise and persist in the blue-collar sector but not the white-collar sector. First, the weaker relationship between worker skill and productiv-ity in the blue-collar sector implies that hiring a white worker over a more skilled black worker will generally result in smaller productivity losses at a blue-collar job than a white-collar job. This in turn means that it will generally be less costly for firms to en-gage inpreference-baseddiscrimination in the blue-collar sector than the white-collar sector (see Becker 1971 and Black 1995 for two examples of preference-based dis-crimination models). Second, differences in skill intensity across sectors may cause statisticaldiscrimination to arise only in the blue-collar sector. More specifically, as shown by numerous authors, statistical discrimination can arise only when worker skill
is not directly observed by employers (see for example Phelps 1972; Arrow 1974; Aiger and Cain 1977; Lundberg and Startz 1983; Coate and Loury 1993; Cornell and Welch 1996; Moro and Norman 2003; Antonovics 2004). However, as argued be-low, such imperfect information regarding worker skill is less credible when worker productivity depends dramatically on worker skill, as is true with most white-collar jobs, because in such cases firms have a strong incentive to invest in technologies that accurately reveal worker skill. Alternatively, in the blue-collar sector, where worker productivity is only slightly related to a worker’s general academic skill, it may be more credible that firms often find it optimal to use race as a free signal of worker skill rather than invest in costly skill-assessment technology. Hence, imperfect information, and therefore statistical discrimination, is arguably more likely to arise and persist in the blue-collar sector.
A strong implication that arises from either of the above theories of discrimination is that after controlling for academic skill, black workers should be more likely than white workers of similar academic skill to work in the less discriminatory white-collar sector. I find strong empirical support for this implication. Moreover, as discussed more thoroughly below, for thestatisticaldiscrimination story to be true, it must also be the case that firms spend more resources on skill assessment when hiring for white-collar positions than for blue-white-collar positions, and the mean and variance of wages should be greater in the white-collar sector than the blue-collar sector, both overall and for each race separately. I also find these implications to be consistent with the empirical evidence.
As mentioned to above, however, the differences in the conditional racial wage gap across sectors also may be explained by a model of omitted variable bias or pos-sibly differential measurement error across sectors. While neither of these explana-tion can be ruled out with certainty, and may at first both seem simpler than the discrimination explanations discussed above, I show both are not quite as straightfor-ward as they might seem. In particular, for an omitted variable explanation to be cor-rect, there must be a racial gap in some unobserved skill, and either this unobserved skill matters for productivity in the blue-collar sector but not the white-collar sector, or there must actually be a wage premium for black workers compared to equally skilled white workers in the white-collar sector (but not the blue-collar sector). On the other hand, while differential measurement error across sectors can quite plausi-bly account for the findings with respect to wage inequality across sectors, it cannot in and of itself account for the above results with respect to conditional differences between races with respect to sorting across sectors.
II. Empirically Examining Black-White Wage Inequality
respondent, but also wage, education, and employment data throughout each respondent’s life. The actual sample used in this analysis consists of male white and black workers, not in the low-income white or military oversamples, with valid AFQT test scores and educational attainment data, and having a valid CPS wage and occupation in at least one year between 1990 and 1992 panels inclusive. These par-ticular years are chosen in order to make the results obtained here generally compa-rable to those in Neal and Johnson (1996).
A. Black-White Wage Inequality in the Overall Labor Market
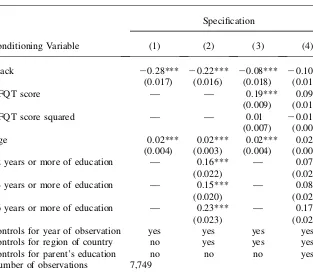
To examine wage inequality across races, I run Random Effects Generalized Least Squares (GLS) regression specifications of the natural logarithm of each individual’s wage from each year, on a race indicator dummy, as well as the individual’s age in that year, and dummies for the year of observation. The results from this regression can be interpreted as capturing the magnitude of mean unconditional wage inequality between black and white males in their late twenties to mid-thirties during the early 1990s. Column 1 of Table 1 shows that the coefficient on the race dummy reveals that black male workers in this age group during this time period earned on average 28 percent less than their white male counterparts. These results are very similar to those obtained by Neal and Johnson (1996).
As discussed by Neal and Johnson (1996), much of this racial wage gap can be accounted for by racial differences in premarket academic skills. For example, the sec-ond column of Table 1 shows that if we control for completed years of education, the racial wage gap falls by roughly 25 percent, to a 22 percent differential. This result still likely understates the actual importance of academic skill differences, as completed years of education is likely a very noisy and racially biased measure of each individ-ual’s academic skill given variation in school quality across racial groups.
Neal and Johnson (1996) argue that an individual’s score on the Armed Forces Qualification Test (AFQT) may provide a more precise and less racially biased mea-sure of an individual’s academic skill at the outset of his labor market activity than simply his years of completed schooling. The AFQT test is a combined measure of an individual’s achievement on four academic skills tests: vocabulary, paragraph comprehension, arithmetic reasoning, and math knowledge. The AFQT is in no way meant to be a measure of inborn ‘‘intelligence’’ or innate potential for success in the labor market of any individual. Rather, the AFQT test is simply a measure used by the United States Military as a ‘‘measure of trainability and a primary criterion of enlistment eligibility’’ (Waters 1982). These scores are affected by many influences including age, school quality, parental and peer influence, and the effort an individual had previously exerted in obtaining these academic skills. Therefore, an individual’s AFQT score should simply be interpreted as a noisy measure of the general academic skills the individual has acquired at the time of taking the test.1
1. It should be noted that Rodgers and Spriggs (1996) suggest that there may be a racial bias in the relation-ship between AFQT scores and wages since components to the AFQT test appear to have different returns across races. However, they do not control for occupation. As shown above, AFQT scores have very dif-ferent returns across sectors, and blacks and whites may be distributed very difdif-ferently across sectors. Moreover, other evidence has not suggested a significant racial bias on these dimensions (see Neal and Johnson 1996 and Waters 1982 for more in-depth discussion).
The third column of Table 1 shows that when AFQT scores are used instead of years of completed schooling to control each individual’s academic skill, the black-white wage gap falls to only an 8 percent differential.2In other words, racial differences in academic skills as measured by AFQT scores explain over two-thirds of the unconditional racial wage gap. Once again, this result is almost identical to that found in Neal and Johnson (1996).
As emphasized by Neal and Johnson, this result suggests that the racial difference in academic skill acquired prior to the bulk of labor market activity is indeed a pri-mary source of the overall wage inequality between black and white male workers, and that policies that help alleviate this academic skill gap are of utmost importance for lessening racial wage inequality. However, it is certainly not clear that this racial academic skill gap is the only source of the observed racial wage inequality that is of interest. After all, the coefficient on the black dummy variable remains negative and significant even after controlling for AFQT scores. Moreover, if we attempt to further control for academic skill by including each individual’s years of completed school-ing, the years of completed schooling for each individual’s father and mother, as well as regional dummies (as black individuals disproportionately reside in southern states which may generally have lower performing schools), the coefficient on the black dummy variable remains negative and significant (and actually even increases in magnitude somewhat), as can be seen in Column 4 in Table 1.3Therefore, it is im-portant to examine further what labor market forces may account for this unex-plained portion of racial wage inequality.
B. Examining Black-White Wage Inequality Across Occupations
In order to understand further the portion of racial wage inequality left unexplained after controlling for academic skills, I begin by dividing the labor market into distinct occupational categories. Specifically, the NLSY79 uses the 1970 Census Occupa-tional Classification System to classify reported occupations. These occupations are divided into several mutually exclusive categories, which include professional and technical occupations, managerial occupations, sales workers, clerical workers, craftsmen, operatives, laborers (nonfarm), and service workers.4 Examples of job titles within each category are given in Table 2.5
Columns 1 and 2 of Table 3 show the results from Random Effects GLS log wage regression specifications identical to those reported in Columns 1 and 4 of Table 1, but done separately for professional/technical and managerial jobs, or ‘‘white-collar’’ occupations. The results reported in this table reveal several important patterns. First,
2. In order to renorm the test, the military administered the tests making up the AFQT to most of the NLSY79 respondents in 1980. Since individuals in the NLSY79 took the tests that make up the AFQT at different ages and scores clearly rise with age, scores are age adjusted, as well as normalized to have a mean of zero and a standard deviation of one.
3. Actual experience is not included in any of the specifications in this paper, as labor market discrimina-tion may manifest itself through employers being less likely to hire black workers all else equal, which in turn lowers the reservation wage for black workers, which is then how such discrimination is revealed in wage regressions.
4. Armed Forces and Farm workers are excluded from this analysis because housing and food are often included as part of overall compensation for jobs in these categories.
the coefficients on the black dummy variable in Columns 1 and 3 show a significant unconditional racial wage gap in both of these occupational categories, but this gap is smaller than the unconditional gap in the labor market as a whole. Even more inter-estingly, after controlling for the measures of academic skill, the coefficients on the black dummy variable in Columns 2 and 4 are not significantly different from zero at any standard significance level. In other words, while black workers appear generally to be paid less than white workers in ‘‘white-collar’’ occupations, all of this racial wage inequality can be accounted for by racial differences in the academic skill var-iables used here. These general findings are summarized in Specifications 5 and 6, which pool all white-collar workers (that is, those working in Professional/Technical and Managerial Occupations).
The results in Table 4, however, which look at historically ‘‘blue-collar’’ occupa-tions, lie in stark contrast to those presented in Table 3. Specifically, using analogous Table 1
Random Effects GLS Log Wage Regressions (Whole Labor Market)
Specification
Conditioning Variable (1) (2) (3) (4)
Black 20.28*** 20.22*** 20.08*** 20.10***
(0.017) (0.016) (0.018) (0.019)
AFQT score — — 0.19*** 0.09***
(0.009) (0.011)
AFQT score squared — — 0.01 20.01*
(0.007) (0.008)
Age 0.02*** 0.02*** 0.02*** 0.02***
(0.004) (0.003) (0.004) (0.003)
12 years or more of education — 0.16*** — 0.07***
(0.022) (0.023)
14 years or more of education — 0.15*** — 0.08***
(0.020) (0.020)
16 years or more of education — 0.23*** — 0.17***
(0.023) (0.024)
Controls for year of observation yes yes yes yes
Controls for region of country no yes yes yes
Controls for parent’s education no no no yes
Number of observations 7,749 Number of individuals 3,059
Note: The sample used in this analysis comes from the NLSY79 and consists of observations in the years 1990 to 1992, for male white and black workers, not in the low-income white or military oversamples, with valid ASVAB test scores, and having a valid CPS wage and occupation. AFQT scores are age-adjusted and normalized to have a population mean of zero and standard deviation of one. Standard errors are in paren-theses. One asterisk indicates significance at 10 percent level, two asterisks indicate significance at 5 per-cent level, three asterisks indicated significance at 1 perper-cent level.
Table 2
Examples of Jobs in Each Occupational Category
White Collar
Blue Collar Other
Professional
(and Technical) Managerial Clerical Craft Operative Laborer Sales Service
Computer Programmer
Bank Officer Bank Teller Baker Assembler Fisherman Advertising Agent
Buyer Secretary Jeweler Riveter Warehouseman Stock and Bond Sales
Porter
School Teacher Receptionist Decorator Knitter Longshoreman Sales Clerk Hair Dresser Pilot Key Puncher Electrician Welder Real Estate
Agent
Fireman
Artist Ticket Agent Auto Mechanic Drill Press Policeman Stock Clerk Roofer Bus Driver Detective
Painter Housekeeper
Dishwasher
Note: Occupations categorized according to 1970 Occupational Classification System, as used by NLSY79.
Table 3
Random Effects GLS Log Wage Regressions by Occupation Sector (White Collar Jobs)
Specification
Professional Managerial Overall White Collar
Conditioning Variable (1) (2) (3) (4) (5) (6)
Black 20.14*** 0.01 20.16** 0.01 20.17*** 20.01
(0.045) (0.050) (0.067) (0.072) (0.035) (0.038)
AFQT score — 0.09** — 0.16*** — 0.11***
(0.037) (0.042) (0.024)
AFQT score squared — 0.03 — 0.02 — 0.01
(0.025) (0.033) (0.017)
Age 0.02** 0.02*** 0.06*** 0.04*** 0.03*** 0.03***
(0.009) (0.008) (0.012) (0.012) (0.007) (0.006)
12 years or more of education — 0.24* — 20.01 — 0.08
(0.140) (0.138) (0.088)
14 years or more of education — 0.1 — 0.05 — 0.11***
(0.062) (0.067) (0.041)
16 years or more of education — 0.20*** — 0.09 — 0.17***
(0.045) (0.070) (0.035)
Controls for year of observation yes yes yes yes yes yes
Controls for region of country no yes no yes no yes
Controls for parent’s education no yes no yes no yes
Number of observations 1,225 1,225 386 386 2,029 2,029
Number of individuals 622 622 278 278 1040 1040
Note: The sample used is a subset of sample used for Table 1 results. Standard errors are in parentheses. One asterisk indicates significance at 10 percent level, two asterisks indicate significance at 5 percent level, three asterisks indicated significance at 1 percent level.
Bjerk
Table 4
Random Effects GLS Log Wage Regressions by Occupation Sector (Blue Collar Jobs)
Specification
Conditioning Variable
Clerical Craftsmen Operators Laborers Overall Blue Collar
(1) (2) (3) (4) (5) (6) (7) (8) (9) (10)
Black 20.26*** 20.12** 20.24*** 20.09** 20.17*** 20.08** 20.18** 20.09** 20.24*** 20.012*** (0.042) (0.052) (0.03) (0.034) (0.028) (0.034) (0.035) (0.043) (0.018) (0.021)
AFQT score — 0.11*** — 0.06*** — 0.01 — 0.02 — 0.07***
(0.030) (0.019) (0.021) (0.031) (0.012)
AFQT score squared
— 20.05** — 20.03* — 20.03** — 20.04** — 20.03***
(0.024) (0.015) (0.015) (0.020) (0.009)
Age 0.03** 0.02* 0.02*** 0.02*** 0.02*** 0.02*** 0.02*** 0.02*** 0.02*** 0.01***
(0.009) (0.009) (0.006) (0.006) (0.006) (0.006) (0.008) (0.008) (0.004) (0.004) 12 years or more
of education
— 0.1 — 0.10*** — 0.10*** — 0.07 — 0.07***
(0.089) (0.037) (0.036) (0.044) (0.023)
14 years or more of education
— 0.05 — 0.04 — 0.04 — 0.07 — 0.07***
(0.048) (0.034) (0.04) (0.056) (0.022)
16 years or more of education
— 0.04 — 0.07 — 0.01 — 20.06 — 0.04
(0.056) (0.067) (0.082) (0.102) (0.034)
406
The
Journal
of
Human
Table 4(continued)
Specification
Conditioning Variable
Clerical Craftsmen Operators Laborers Overall Blue Collar
(1) (2) (3) (4) (5) (6) (7) (8) (9) (10)
Controls for year of observation
yes yes yes yes yes yes yes yes yes yes
Controls for region of country
no yes no yes no yes no yes no yes
Controls for parent’s education
no yes no yes no yes no yes no yes
Number of observations
622 622 1,667 1,667 1,475 1,475 911 911 5,720 5,720
Number of individuals
410 410 967 967 875 875 640 640 2,431 2,431
Note: The sample used is a subset of sample used for Table 1 results. Standard errors are in parentheses. One asterisk indicates significance at 10 percent level, two asterisks indicate significance at 5 percent level, three asterisks indicate significance at 1 percent level.
Bjerk
regression specifications to those used previously, Columns 1, 3, 5, and 7 show that unconditional racial wage inequality is quite large in each of these blue-collar occu-pations. Moreover, after controlling for the measures of academic skill, the specifi-cations reported in Columns 2, 4, 6, and 8 reveal that black workers working in these blue-collar occupations still earn significantly less than white workers of sim-ilar measured academic skill in each of these occupations. Pooling all workers work-ing in these blue-collar occupations, as done in Columns 9 and 10, reveal that only half of the overall racial wage inequality in blue-collar jobs can be accounted for by racial differences in the academic skill variables used here.
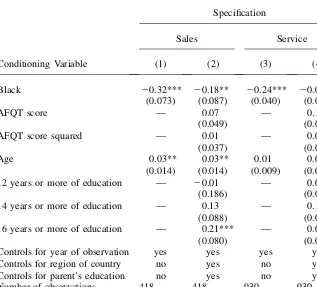
Table 5 shows analogous results to those presented above for workers working in sales and service occupations. As can be seen in Table 2, the types of jobs fitting Table 5
Random Effects GLS Log Wage Regressions by Occupation Sector (Sales and Service Jobs)
Specification
Sales Service
Conditioning Variable (1) (2) (3) (4)
Black 20.32*** 20.18** 20.24*** 20.03
(0.073) (0.087) (0.040) (0.046)
AFQT score — 0.07 — 0.11***
(0.049) (0.028)
AFQT score squared — 0.01 — 0.01
(0.037) (0.019)
Age 0.03** 0.03** 0.01 0.01*
(0.014) (0.014) (0.009) (0.008)
12 years or more of education — 20.01 — 0.01
(0.186) (0.050)
14 years or more of education — 0.13 — 0.18***
(0.088) (0.047)
16 years or more of education — 0.21*** — 0.08
(0.080) (0.067)
Controls for year of observation yes yes yes yes
Controls for region of country no yes no yes
Controls for parent’s education no yes no yes
Number of observations 418 418 930 930
Number of individuals 259 259 515 515
Note: The sample used is a subset of sample used for Table 1 results. Standard errors are in parentheses. One asterisk indicates significance at 10 percent level, two asterisks indicate significance at 5 percent level, three asterisks indicate significance at 1 percent level.
into these to categories are quite heterogeneous, and cannot clearly be uniformly labeled white-collar or blue-collar in the traditional sense. Using analogous regres-sion specifications as those above, Columns 1 and 2 in Table 5 show that black workers working in sales jobs earn about 32 percent less than white sales workers do, and only about half of this difference can be accounted for by racial differences in academic skill. Alternatively, Columns 3 and 4 show that black service workers earn about 24 percent less than white service workers, but all of this racial differ-ence can be accounted for by racial differdiffer-ences in measured academic skill characteristics.
In general, the results in Tables 3–5 imply that all of the residual wage inequality that remains after controlling for measured academic skills in the labor market as a whole arises exclusively from significant racial wage inequality between workers of similar measured academic skill working in blue-collar and sales jobs. By contrast, racial differences in academic skill can account for all of the racial wage inequality among workers working in white-collar and service jobs.
C. Other Differences Across Occupational Sectors
The tables discussed above also reveal another key difference between occupational categories. Namely, academic skills appear to affect compensation more dramatically in the white-collar occupations than in the blue-collar occupations. This is most no-ticeable with respect to AFQT scores, where the coefficient on the AFQT score and AFQT score squared variables are substantially larger in white-collar occupations than in blue-collar occupations. Similarly, the coefficients on the education variables (especially 14 years or more and 16 years or more) are also substantially higher in the white-collar occupations than the blue-collar occupations.
Not surprisingly, these results suggest that academic skill may be more impor-tant for productivity in white-collar jobs than blue-collar jobs. This can be con-firmed using data from the Multi-City Study of Urban Inequality (MCSUI). The MCSUI was designed to study how changing labor force dynamics, racial attitudes and stereotypes, and residential segregation affect urban inequality.6 The MCSUI collected data on the frequency different tasks were used in the most recently hired position. The tasks examined here consist of ‘‘Write paragraphs or memos’’ (Writ-ing), ‘‘reading instructions at least one paragraph in length’’ (Read(Writ-ing), ‘‘Do arith-metic or other computations’’ (Math). Performing these tasks certainly requires the use of the types of academic skills tested by the AFQT. Hence, the more often these tasks are performed, the more important academic skills are likely to be for worker productivity.
Table 6 confirms that each of these tasks were significantly more likely to be per-formed daily in white-collar jobs than blue-collar jobs. Alternatively, each of these tasks was significantly less likely never to be performed in white-collar jobs than
6. The data to be used for this analysis comes from the employer survey portion of the MCSUI, which was collected via a telephone survey of business establishments in Atlanta, Boston, Detroit, and Los Angeles carried out between the spring of 1992 and 1995. Two-thirds of the sample came from a size-weighted probability sample of regional employment directories, with the other third coming from the current or most recent employer reported in the household survey portion of the MCSUI.
Table 6
Academic Skills Used by Occupation
Writing Reading Math or Arithmetic
Occupation Daily Weekly Monthly Never Daily Weekly Monthly Never Daily Weekly Monthly Never
White collar 0.63 0.17 0.07 0.12 0.74 0.14 0.03 0.09 0.73 0.14 0.05 0.08 (0.021) (0.021) (0.017) (0.014) (0.026) (0.022) (0.008) (0.016) (0.027) (0.022) (0.017) (0.012) Blue collar 0.31 0.16 0.09 0.43 0.53 0.21 0.07 0.19 0.61 0.14 0.05 0.20
(0.016) (0.011) (0.008) (0.015) (0.016) (0.012) (0.008) (0.013) (0.016) (0.012) (0.006) (0.013) Sales 0.33 0.22 0.13 0.32 0.54 0.22 0.06 0.17 0.83 0.07 0.02 0.08
(0.033) (0.025) (0.043) (0.030) (0.016) (0.025) (0.012) (0.024) (0.022) (0.015) (0.007) (0.015) Service 0.21 0.1 0.1 0.58 0.49 0.17 0.09 0.24 0.55 0.12 0.04 0.30
(0.024) (0.025) (0.019) (0.031) (0.031) (0.022) (0.016) (0.026) (0.031) (0.019) (0.010) (0.027)
Note: Data comes from MCSUI Employer sample, and includes all observations with valid occupational title. Statistics weighted to be "a representative sample of firms, such as would occur if a random sample of employed people were drawn from each city" (MCSUI Employer Telephone Survey Codebook, ICPSR 32535). Standard errors in parentheses.
410
The
Journal
of
Human
in blue-collar jobs.7Given these results, for the remainder of the analysis I will refer to white-collar jobs as being in the ‘‘more academically skill-intensive’’ job sector, and blue-collar jobs as being in the ‘‘less academically skill-intensive’’ job sector, where the skill of interest is general academic proficiency.
Sales and service jobs are harder to characterize. As stated above, the types of jobs in each of these categories are quite heterogeneous. Table 5 shows that effect of AFQT scores on compensation in these two categories generally lies somewhere be-tween white-collar jobs and blue-collar jobs. Moreover, Table 6 shows that while the frequency of reading and writing tasks in sales jobs is very similar to that in blue-collar jobs, the frequency of tasks involving math in sales jobs is more similar to white-collar jobs. On the other hand, tasks that require these academic skills are gen-erally much more infrequent in service jobs than in any of the other categories.
III. What Can Account for these Cross-Occupational
Differences in Conditional Wage Inequality?
What can explain these differing characteristics of measured racial wage inequality across occupations as detailed above? In this section, I examine three possible explanations: (i) differential discrimination across sectors, (ii) unob-served variable bias, and (iii) differential measurement error across sectors.
A. Labor Market Discrimination
Given the relative heterogeneity of jobs in the sales and service sectors, at this point, let us only consider how discrimination might explain the empirical results with respect to ra-cial wage inequality in the white-collar and blue-collar sectors only (that is, the results shown in Tables 3 and 4). In particular, are there plausible reasons why black workers might be discriminated against in the blue-collar sector but not the white-collar sector? Below, I consider both a preference-based discrimination explanation, as well as a statistical-based discrimination argument. As will be seen, both arguments are directly related to the discussion above suggesting that general academic skill is far more im-portant for productivity in the white-collar job sector than the blue-collar job sector. 1. A Preference-based Discrimination Explanation
First, consider a simple model of preference-based discrimination along the lines of Becker (1971). In such a model, firms essentially have to pay a cost, in terms of lower profits, in order to act on their preference to employ white workers over black workers of similar or greater skill. Clearly, this cost will be greater, the greater the importance of each worker’s skill to productivity. For example, say a racially biased firm chooses to hire a white truck driver over black truck driver with greater
7. It is important to note that the MCSUI uses a different occupational category system than the NLSY79. Specifically, instead of the 1970 Census Occupational Categories, the MCSUI uses the 1980 Standard Oc-cupational Classification Manual. While the exact occupation categories are different across surveys, the occupational titles are similar enough across surveys such that the occupations I classify to be in the more general sector categories ‘‘white-collar,’’ ‘‘blue-collar,’’ ‘‘sales,’’ and ‘‘service’’ are likely to be almost iden-tical across surveys.
academic skill, or equivalently, consider a firm that offers black truckers much lower wages than equally skilled white truckers. If academic skill contributes to trucker productivity (for example, improves map reading proficiency, improves adaptability to new tasks and technology, improves ability to learn truck maintenance), then this racially biased firm will lose profits relative to its less racist competitor who hires the more academically skilled black trucker (at a similar or even lower wage). However, given academic skill is likely to be only marginally important for trucker productiv-ity, then this cost of behaving in a racist manner will be relatively modest and the firm may be able to stay competitive through productivity gains in other areas (for example, higher effort put forth by other racist white employees).
On the other hand, consider a racist law firm that chooses to hire a white lawyer over a black lawyer with greater academic skill. Given academic skill is likely to have a very large influence on law firm profits, behaving in such a racist manner is likely to be extremely costly to the law firm, making it very hard for the law firm to stay competitive with the less racist law firms.
The above examples suggest that it is more likely that racist employers will be able to persist in the marketplace when these racist preferences are applied to hiring for less skill-intensive positions than for more skill-intensive positions. Hence, this story could certainly help explain the results in Tables 3 and 4. Racist employers simply cannot afford to act on their racist preferences when hiring for the highly ac-ademically skill-intensive white-collar jobs. However, when hiring for the less aca-demically skill-intensive blue-collar jobs, racist employers are able to act on their racist preferences without large losses to their competitiveness.
2. A Statistical Discrimination Explanation
We can also consider whether a model of statistical discrimination can explain the em-pirical patterns in Tables 3 and 4, where employers discriminate not due to underlying racist preferences, but rather because such behavior is optimal from a profit-maximiz-ing perspective. In general, models of statistical discrimination must assume firms have substantial uncertainty about worker skill. Under some circumstances, this uncer-tainty may then cause profit-maximizing employers to use race as a signal of skill, resulting in similarly skilled workers of different races being paid different wages.
Clearly, however, it is generally possible for firms to obtain quite precise informa-tion regarding the general skills of prospective workers. For example, they can exten-sively interview and test all applicants. While such investments in skill assessment are possible, they would be expensive. Therefore, it is likely that only when hiring for jobs where productivity is highly dependant on a worker’s general academic skill will an employer make substantial investments in such skill-assessment technologies when making hiring and/or compensation decisions. On the other hand, in jobs where productivity is only slightly related to a worker’s general academic skill, employers may find it optimal to avoid investing in costly skill-assessment technologies and simply use race as a free but noisy signal of an individual’s academic skill.8
Given general academic skill appears to be much more important for productivity in the white-collar occupational sector than the blue-collar occupational sector, the above discussion suggests firms may find it optimal to invest much more heavily in assessing worker skill when hiring for white-collar positions than when hiring for blue-collar positions. Such differences in skill-assessment across sectors may then result in significant imperfect information regarding worker skill persisting in the blue-collar sector but not the white-collar sector, causing statistical discrimina-tion to only arise and persist in the blue-collar sector. A formalized version of this argument is presented in the Appendix.
B. Evaluating the Discrimination Explanations
The above discussion argued that both preference-based and statistically based dis-crimination models could be straightforwardly adapted to explain why there exists substantial conditional wage inequality in the blue-collar sector but not the white-collar sector. To assess further whether either of these explanations is true, we can attempt to empirically evaluate whether any other implications that arise from these models also hold.
A strong implication arising from both of these discrimination models relates to differential sorting by race across sectors. Specifically, if discrimination against black workers arises in the blue-collar sector only (for either of the reasons discussed above), thenafter conditioning on a noisy but racially unbiased measure of general academic skill, black workers should be more likely than white workers to work in the more academically skill-intensive white-collar sector. The intuition behind this implication is quite straightforward—black workers have a greater incentive than white workers of similar academic skill to work in the more skill-intensive white-col-lar jobs if they will be paid less than their simiwhite-col-larly skilled white counterparts if they choose to work in the blue-collar sector, but will be paid similarly if they choose to work in the white-collar sector. Note, however, discrimination in the blue-collar sec-tor but not the white-collar secsec-tor does not necessarily imply that black workers should beunconditionallymore likely than whites to work in the white-collar sector (this assertion is discussed more formally in model presented in Appendix).
Previous work on racial differences in occupational sorting has shown black work-ers are generally less likely to work in white-collar type occupations than white workers of similar age and years of education (Gill 1989; Gill 1994). However, as Gill (1989) acknowledges, similar years of schooling can mean quite different things across races if there are large racial differences in school quality, and therefore may be a somewhat racially biased measure of academic skill. Hence, Gill’s findings may not provide a direct test of the implication discussed above.
To examine more precisely whether there appears to be such differential sorting across occupational sectors by race, we can once again use the NLSY79 sample from before, and control for academic skills using AFQT scores. Table 7 shows both the un-conditional probability for workers of each race to work in the white-collar job sector, as well as the probability after roughly conditioning on where the worker lies in the AFQT score distribution, for each year separately from 1990–92. As can be seen in the top panel, consistent with Gill (1989), the unconditional probability that a black worker works in the white-collar sector is almost 50 percent less than the corresponding
Table 7
Probability of Working in White Collar Occupational Sector
Black White Diff
Unconditional
1990 0.15 0.32 20.17***
(0.012) (0.011) (0.016)
1991 0.16 0.32 20.17***
(0.012) (0.012) (0.017)
1992 0.16 0.32 20.16***
(0.012) (0.012) (0.017) Conditional on location in AFQT distribution
1990
More than one standard deviation above mean AFQT 0.59 0.59 0.00 (0.070) (0.022) (0.074) Above the mean AFQT, but by less than one standard deviation 0.30 0.27 0.03
(0.035) (0.017) (0.039) Below the mean AFQT, but by less than one standard deviation 0.13 0.14 20.01
(0.019) (0.020) (0.028) More than one standard deviation below mean AFQT 0.05 0.03 0.02
(0.011) (0.013) (0.017)
414
The
Journal
of
Human
Table 7(continued)
Black White Diff
1991
More than one standard deviation above mean AFQT 0.64 0.59 0.05 (0.066) (0.022) (0.069) Above the mean AFQT, but by less than one standard deviation 0.31 0.28 0.03
(0.036) (0.017) (0.040) Below the mean AFQT, but by less than one standard deviation 0.14 0.13 0.01
(0.020) (0.019) (0.028) More than one standard deviation below mean AFQT 0.05 0.04 0.01
(0.010) (0.015) (0.019) 1992
More than one standard deviation above mean AFQT 0.66 0.60 0.06 (0.065) (0.022) (0.069) Above the mean AFQT, but by less than one standard deviation 0.35 0.29 0.06
(0.037) (0.018) (0.041) Below the mean AFQT, but by less than one standard deviation 0.16 0.12 0.04
(0.021) (0.018) (0.028) More than one standard deviation below mean AFQT 0.04 0.03 0.00
(0.009) (0.014) (0.016)
Note: Sample same as used for Table 1. Standard errors in brackets.
Bjerk
probability for whites. However, consistent with the models of discrimination dis-cussed above, the lower panels of Table 7 show that after controlling for where an in-dividual lies in the AFQT distribution, black workers appear to be equally or more likely than white workers to work in the more academically skill-intensive white-collar sector.
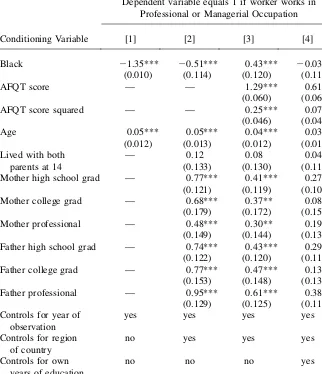
Due to relatively small sample sizes within each of the above AFQT categories in any particular year, none of the differences in the conditional probabilities of work-ing in the white-collar sector across races shown in Table 7 are significant. Therefore, Table 8 shows the results from several random effects probit specifications for the years 1990–92, where the dependant variable in each is a dummy variable equal to one if the individual works in the more highly skill-intensive white-collar sector. In the first specification, the conditioning variables include a dummy variable equal to one if the respondent is black, the respondent’s age, and the year of the ob-servation. The results confirm that without conditioning on the academic skill of each worker, black workers are significantly less likely to work in the more highly skill-intensive white-collar sector than white workers. The second specification shows that while the gap shrinks somewhat, black workers are still less likely than white work-ers to work in the white-collar sector if we further control for parental education, whether each parent worked in a professional occupation, whether the respondent lived with both parents at age 14, and the region in which the respondent resides. However, the third specification shows that if we additionally control for premarket academic skills via AFQT scores, black workers are actually significantly more likely to work in the more highly skill-intensive white-collar job sector than their white counterparts. To give an indication of the magnitude of the coefficient esti-mates, if all other characteristics are held fixed at the population means, the results in Specification 3 imply that a black worker with an AFQT score one standard de-viation above the population mean is about 30 percent more likely to work in the white-collar sector than a white worker with the same AFQT score.
It is important to note that each individual’s own years of education were not con-trolled for in the first three probit specifications shown in Table 8 discussed above. The reason for this is that education beyond high school is generally a prerequisite for finding employment in a white-collar job, meaning an individual’s decision re-garding going to college is arguably almost equivalent to an individual’s decision with respect to pursuing a white-collar career.9This means that further controlling for an individual’s own level of education in the probit specifications discussed above would not necessarily reveal whether there is different sorting across occupation sec-tors by race (conditional on premarket academic skills), but rather would reveal whether there are racial differences in the ability toobtaina job in the white-collar sector conditional on premarket academic skills and years of education. Therefore, if indeed there is no discrimination in the white-collar sector then the coefficient on the black dummy variable in a probit specification analogous to the third specification in Table 8 but further controlling for years of own education shouldnotbe significantly different than zero. As shown in Specification 4 in Table 8, this is the case.
9. Indeed, after conditioning on AFQT scores, I find that black workers are also significantly more likely than their white counterparts to complete four or more years of post-high school education.
Table 8
Random Effects Probit Analysis of Probability of Working in White-Collar Occupation
Dependent variable equals 1 if worker works in Professional or Managerial Occupation
Conditioning Variable [1] [2] [3] [4]
Black 21.35*** 20.51*** 0.43*** 20.03
(0.010) (0.114) (0.120) (0.111)
AFQT score — — 1.29*** 0.61***
(0.060) (0.060)
AFQT score squared — — 0.25*** 0.07
(0.046) (0.044)
Age 0.05*** 0.05*** 0.04*** 0.03***
(0.012) (0.013) (0.012) (0.012)
Lived with both parents at 14
— 0.12 0.08 0.04
(0.133) (0.130) (0.119)
Mother high school grad — 0.77*** 0.41*** 0.27**
(0.121) (0.119) (0.109)
Mother college grad — 0.68*** 0.37** 0.08
(0.179) (0.172) (0.156)
Mother professional — 0.48*** 0.30** 0.19
(0.149) (0.144) (0.130)
Father high school grad — 0.74*** 0.43*** 0.29***
(0.122) (0.120) (0.110)
Father college grad — 0.77*** 0.47*** 0.13
(0.153) (0.148) (0.134)
Father professional — 0.95*** 0.61*** 0.38***
(0.129) (0.125) (0.114)
Controls for year of observation
yes yes yes yes
Controls for region of country
no yes yes yes
Controls for own years of education
no no no yes
log likelihood 24,740 24,435 24,162 23,942
Note: Sample same as used for Table 1. Once again, only between subject variation is used for estimation. Standard errors in parentheses. One asterisk indicates significance at 10 percent level, two asterisks indicate significance at 5 percent level, three asterisks indicated significance at 1 percent level.
The model of statistical discrimination developed in the Appendix is even more specific regarding this racial difference in occupational sector sorting. Specifically, the model suggests that occupational selection for each race may be characterized by a skill threshold level for each racer, denoted u*, such that a worker from racer
r will choose to work in the more skill-intensive white-collar sector if and only if his general skill level exceeds this thresholdu*. A direct implication of discrimina-r tion against blacks in the blue-collar sector but not the white-collar sector is that this threshold should belowerfor blacks than whites. (See model in Appendix for formal proof of this assertion.) While not modeled explicitly, such a result could also cer-tainly arise from a model of preference-based discrimination as described previously. This suggests that a third way to evaluate whether there is differential occupational sorting across racial groups is to directly estimate the skill-sorting thresholds for each race and see if they differ. To do so, assume an individuali’s AFQT score (denoted ai) is a noisy measure of the individual’s general academic skillui, whereai=ui+ ei andeiis an i.i.d. mean zero normally distributed random variable. The probability that an individualifrom racerworks in the white-collar sector given his AFQT score aiwill then equalF(ai2u*), while the probability that an individualr ifrom racer does not work in theH-sector given his AFQT scoreaiequalsF(u*r 2ai).10 There-fore, to estimate the sorting thresholdu* for racial groupr r, we can maximize the fol-lowing log likelihood function with respect tou*:r
lnL=SHlnFðai2ur*Þ+SLlnFður*2aiÞ
where SHimplies summation across all male workers of a particular race work-ing in the more highly skill-intensive white-collar sector, and SLimplies summa-tion across all male workers of a particular race not working in the white-collar sector.
Consistent with the discrimination stories discussed above, maximizing the above expression for each race separately for each year 1990, 1991, and 1992, suggests that indeed the skill-sorting threshold is lower for blacks than whites. Specifically, for 1990, the estimated skill-sorting threshold for whites is 1.07 (s.e. 0.036), while for blacks it is 0.67 (s.e. 0.057). The analogous results for 1991 are 1.06 (s.e. 0.036) for whites and 0.64 (s.e. 0.057) for blacks, while in 1992 the results are 1.05 (s.e. 0.036) for whites and 0.62 (s.e. 0.058) for blacks. All of these differences across races are significant at the 1 percent level.
The above results do suggest that black workers are more likely to work in the white-collar sector than white workers of similar premarket academic skill. Hence, at this point we cannot reject either the preference-based or statistical-based models of discrimination, where discrimination arises in the less academically skill-intensive blue-collar sector, but not the more skill-intensive white-collar sector. However, as discussed above, a necessary condition for the model of preference-based
10. To see this, recall that a workerifrom racerchooses to work in the white-collar sector as long as hisui
exceedsur*. Therefore, the probability a workerifrom racerwith AFQT score ofaiworks in theH-sector is
Pr(ui>u*rjai) = Pr(ai+ ei>ur*) = Pr(ei>u*r2ai) . Given the distributional assumption regardingei, this
equals 12F(ei>u*r2ai), which in turn equalsF(ei> ai2u*r). A similar procedure can be used to
discrimination to be true is that even though the more racist employers have lower skilled employees (or equivalently relatively higher labor costs) than the more race-neutral firms, market competition is not sufficiently strong to drive these less efficient racist firms out of business. While it was argued that this is more plausible with respect to the blue-collar labor market than the white-collar market, it is admit-tedly still a very strong assumption given the arguably very competitive global econ-omy of the United States during the early 1990s.
The statistical-based discrimination argument is appealing in that the discrimi-nation that arises in the blue-collar sector actually turns out to be optimal for profit-maximizing firms, even in a perfectly competitive economy. Moreover, the statistical-based discrimination argument provides us with other potentially refutable implications. Most notably, for the statistically based discrimination argument dis-cussed above to be true, it clearly must be the case that we should see employers spending more resources when hiring for white-collar positions than when hiring for blue-collar positions, as such asymmetry in skill-assessment investments are re-quired to drive the information differences across sectors necessary for discrimina-tion to arise in the blue-collar sector but not the white-collar sector. Therefore, it is important to ask whether there is any evidence that such differential investment in skill-assessment across sectors is true.
To look at this question, I use data from The National Survey of Employers 1982 (NSE). This survey interviewed a nationally representative sample of 5,000 Ameri-can for-profit employers and was a 1982 followup to the Employers Opportunities Pilot Project (EOPP) of 1980. In the course of this study, this survey collected data on wages of hired workers, employer, and most recently hired employee characteristics, and employer hiring practices including the number of hours spent ‘‘screening, inter-viewing, and testing’’ applicants for the most recently hired position.11
As with respect to the MCSUI, occupations in the NSE are not classified in exactly the same manner as in the NLSY79 (the NSE classifies occupations using the 1977 Dictionary of Occupational Titles). However, the categories in the two surveys are similar enough so that jobs can still be separated into white-collar or highly skill-in-tensive jobs (Professional, Technical, Managerial, and Supervisory jobs), and less skill-intensive or blue-collar jobs (Clerical, Processing, Machine Trades, Benchwork, Structural, and Miscellaneous jobs).12It is certainly possible that the different cate-gorization systems used in the NSE and the NLSY79 may result in some jobs being categorized as being in different sectors in the NLSY79 data than the NSE data. While this may lead to some measurement error, such differing classifications are likely to be small in number given the broadness and generality of the white-collar and blue-collar categories that are examined. Sales and service jobs also can be dis-tinguished in the NSE data.
11. The sample used in this paper restricts the data to only firms with valid answers to the key question regarding the number of hours spent ‘‘screening, interviewing, and testing’’ applicants during the course of hiring the most recently hired worker.
12. Amusement, recreation, motion picture, radio and television occupations (Category 96) and occupa-tions in graphic art work (Category 97) are classified as Miscellaneous in theDictionary of Occupational Titles, but are included in the highly skill-intensive sector in this analysis to correspond to where they are categorized in the Census Occupational Classification System that was used in the NLSY79.
The NSE data shows that there do indeed exist substantial differences in the hours spent screening, interviewing, and testing job candidates for the most recently hired position (subsequently referred to as ‘‘hours assessing applicant skill’’) across occu-pational sectors. In particular, when hiring for white-collar positions, employers spent an average of 18.3 hours (s.e. 1.43) assessing applicant skill, compared to 10.5 hours (s.e. 0.46) for blue-collar positions. To confirm that these differences in hours assessing applicant skill across sectors are robust to controlling for a variety of employer and hired employee characteristics, Table 9 presents the results from several OLS regression specifications, where the dependant variable is the natural logarithm of hours spent assessing applicant skill. The first specification controls for the occupational sector of the hired position (the excluded category is blue-collar jobs). The subsequent specifications further control for the size of the hiring em-ployer, the age of hired employee, the gender of hired employee, and the hiring employer’s industry. As can be seen in the top row of Table 10, in all specifications, employers hiring for white-collar jobs spend roughly 50 percent more time Table 9
OLS Regressions of Log of Hours Spent Assessing Skill Per Hired Worker
Specification
Conditioning Variable [1] [2] [3]
White collar job 0.50*** 0.50*** 0.48***
(0.077) (0.078) (0.080)
Sales job 0.07 0.13 0.18*
(0.096) (0.098) (0.101)
Service job 20.34*** 20.32*** 20.29***
(0.073) (0.072) (0.079)
Number of employees (in hundreds) — 0.11*** 0.11***
(0.017) (0.017)
Number of employees squared — 20.001*** 20.001***
(0.0002) (0.0003)
Age > 50 — — 20.16
(0.123)
Age 30 – 50 — — 0.07
(0.061)
Female — — 0.13*
(0.056)
Controls for industry no no yes
R-squared 0.04 0.06 0.08
Number of observations 1,951
Note: Sample taken from National Survey of Employers 1982. One asterisk indicates significance at 10 per-cent level, two asterisks indicate significance at 5 perper-cent level, three asterisks indicate significance at 1 percent level. Standard errors in parentheses.
Table 10
Mean and Variance of Wages [Overall and by Occupational Sector]
1990 1991 1992
Group Overall White Black Overall White Black Overall White Black
All occupations
Mean 10.9 11.9 9.1 10.9 11.9 9.2 10.9 12.0 9.1 (0.121) (0.159) (0.168) (0.126) (0.162) (0.19) (0.126) (0.165) (0.174) Variance 38.3 42.0 27.1 41.0 33.7 42.6 40.5 28.4 44.2
(4.00) (5.54) (4.90) (5.06) (7.12) (6.80) (3.71) (4.63) (5.08) By sector
White-collar
Mean 14.2 14.5 12.8 14.0 14.5 12.0 14.5 14.9 13.2 (0.249) (0.282) (0.524) (0.246) (0.279) (0.498) (0.263) (0.287) (0.63) Variance 54.5 55.3 48.8 56.4 57.1 49.2 62.5 58.6 74.7
(6.87) (7.80) (14.45) (8.80) (10.29) (15.96) (8.38) (8.23) (25.78) Blue-collar
Mean 9.8 10.7 8.5 9.7 10.5 8.5 9.7 10.7 8.3 (0.121) (0.167) (0.164) (0.123) (0.162) (0.181) (0.121) (0.170) (0.152) Variance 28.7 31.4 22.1 28.6 28.7 26.0 27.6 32.0 18.1
(4.71) (7.00) (5.47) (5.19) (7.22) (7.28) (3.53) (5.67) (2.13)
Note: Sample same as used for Table 1. Standard errors in parentheses. Bjerk
screening, interviewing, and testing job candidates than employers hiring for blue-collar sector jobs. In interpreting these results, however, it should be noted that employers may be assessing other skills besides academic skills.
Finally, it also is true that in this model where statistical discrimination arises in the blue-collar sector only, wages should exhibit a higher mean and variance in the white-collar sector than blue-collar sector, both overall and for each race separately. Intuitively, if firms have substantially imperfect information regarding blue-collar worker skill, there should be very little heterogeneity in wages in the blue-collar sec-tor as workers cannot distinguish themselves by their skill. On the other hand, if firms have quite precise information regarding worker skill in the white-collar sector, white-collar wages will exhibit high variance, as such wages will reflect the hetero-geneity in worker productivity associated with the heterohetero-geneity in worker skill. Fi-nally, mean wages will be higher in the white-collar sector than the blue-collar sector because workers only will choose to work in the white-collar sector if they can earn higher wages through revealing their skill in the white-collar sector than if they sim-ply took the relatively more uniform wage available in the blue-collar sector. (These implications are also derived more formally in the model in the Appendix.)
To evaluate these implications, I once again use the NLSY79 sample used previ-ously. Looking at Table 10, we can see that indeed wages in white-collar jobs exhibit a significantly greater mean and variance than in blue-collar jobs, both overall and for each race separately, in each of the panel years that were used for the earlier wage regressions. These results also generally hold true even if white-collar and blue-collar occupations are separated out into the more specific job categories used in Tables 3 and 4 (results available from author upon request).
C. Omitted Variable Bias
The subsections above showed that both preference-based and statistical-based dis-crimination stories can potentially explain the results highlighted in Tables 3 and 4, with Tables 6–10 presenting additional evidence consistent with these models. However, it should be noted that a variety of other stories also may be consistent with these findings. Moreover, considerable caution should certainly be taken before inter-preting a negative coefficient on a black dummy variable to be indicative of discrim-ination, as regardless of the variables that are controlled for, it is likely that employers observe worker characteristics not available to the econometrician. If such an unob-served characteristic is correlated with race and is important for productivity, then the negative coefficient on the black dummy variable may simply be due to the omission of this variable from the regression specifications, not discrimination.
To see this formally, note that the regression specifications in Table 1 that control for academic skill were essentially of the following form
wi=a+luui+lBBi+ei
ð1Þ
wherewiis the log of an individual’s wage,uiis an individual’s academic skill,Bi is an indicator for whether an individual is black, and ei is an independent ran-dom variable for individualidrawn from a normal distribution with mean zero, un-correlated with race and academic skill. The main finding from Table 1 was that
lB< 0.
The clear concern regarding the interpretation of this estimated coefficient is that Equation 1 may have omitted an important skill besides academic skill that also affects wages. In particular, consider a wage specification of the form
wi=d+puui+pssi+pBBi+ei
ð2Þ
wheresiis observed by employers but not available to the econometrician andeiis an independent random variable for individualidrawn from a normal distribution with mean zero, uncorrelated with the other regressor variables. Moreover, assume that this unobserved skillsihas the following relationship to academic skill and race
si=r+muui+mBBi+vi
ð3Þ
whereviis an independent noise term. Substituting Equation 3 into Equation 2 and rearranging, we get
wi=ðd+psrÞ+ðpu+psmuÞui+ðpsmB+pBÞBi+ðei+psviÞ:
ð4Þ
Relating the above equation to Equation 1 shows thatlB=psmB + pB. This shows why it is generally difficult to distinguish between unobserved variable bias and dis-crimination—lBcould be negative either because black workers are actually getting paid less than similarly skilled whites via discrimination (that is,pB< 0), or because there is an unobserved skill that contributes positively to wages and there is a racial skill gap in this unobserved skill (that is,ps> 0 andmB< 0).
This omitted variable story is more complicated with respect to the results pre-sented in Tables 3 and 4, however, as the coefficients in Equation 1 differed across sectors.13For ease of reference, let us refer to the more academically skill-inten-sive white-collar jobs as being inH-sector and the less academically skill-intensive blue-collar jobs as being inL-sector. Given this notation, the primary findings re-ported in Tables 3 and 4 can then be summarized aslB
L
< 0 =lB H
, where the super-scripts indicate sector. In words, after conditioning on academic skill, black workers are paid less than whites are in the blue-collar sector but not the white-collar sector.
Noting from above that for each Sectorj,lBj=psjmB + pBj, there are two ways in which an omitted variable bias, rather than discrimination against black workers, can account for this finding thatlBL< 0 =lBH. First, it may be the case thatpBj = 0 forj=fL, HgbutmB< 0 andps
L
> 0 =ps H
. In words, there may be no explicit wage discrimination in either sector, but blacks have a lower average level of the omitted skill and this omitted skill only contributes to productivity in the less aca-demically skill-intensive blue-collar sector. The second way in which the results in Tables 3 and 4 can be explained by an omitted variable is ifmB< 0 andpsj > 0 forj=fL, Hg, butpB
H
> 0 =pB L
. In words, blacks may have a lower average level of the omitted skill, and this skill may be important for productivity in both sectors, but black workers are actually paid more than their equally skilled white counterparts in the white-collar sector but not the blue-collar sector. The question then becomes, is there plausible justification for either of these hypotheses?
13. As before, given substantial amount of heterogeneity in the types of jobs classified as sales and service jobs, for time being, the let us focus primarily on the differences between the blue-collar sector and the white-collar sector. Discussion of sales and service jobs will follow.
Consider the first hypothesis, where there is no wage discrimination in either sec-tor, but blacks have a lower average level of the omitted skill and this omitted skill only contributes to productivity in the blue-collar sector. In this case, it is important to consider what types of characteristics this unobserved skill may refer to. On the one hand, the unobserved characteristics may be what are sometimes termed soft skills, such as reliability, courteousness, or knowledge of workplace norms. Authors such as Wilson (1997) have suggested that because of isolation from jobs, quality schools, and adequate role models, many blacks who live in poor neighborhoods may indeed have acquired less such soft skills than their white counterparts (poten-tially accounting for whymB< 0). While this may be true, one may argue that such soft skills are also valuable in white-collar jobs (meaningps
H
> 0), making this ex-planation somewhat problematic.
On the other hand, the omitted skill may include nonacademic skill characteristics such as dexterity, mechanical intuition, physical strength, and endurance—attributes which certainly may affect productivity and wages in only the blue-collar sector (that is,ps
L
> 0 =ps H
). However, there are few reasons to expect blacks to have lower av-erage levels of many such nonacademic characteristics than whites have, especially with respect to characteristics such as physical strength and endurance. Moreover, the ASVAB test taken by members of the NLSY79 contains further tests beyond those used for calculating AFQT scores. These include a speed coding test where individuals are timed regarding how fast they can complete a simple matching task and a mechanical intuition test where individuals are shown pictures of basic machines such as pulleys, gears, and wedges, and then asked questions about how these objects would work together. While not perfect, the speed coding test was meant to measure general skills used by ‘‘clerks, coders, warehouse workers, filers, and bookkeepers,’’ and the mechanical intuition test was meant to test general skills useful for subsequent work in ‘‘designing, manufacturing, or repairing machinery’’ (NORC 1981).14Including these test scores in a regression otherwise identical to that performed in the final column of Table 4 reduces the magnitude of the coefficient on the black dummy variable to -0.10 (s.e. 0.021), yet still reflects the existence of a relatively large and significant conditional racial wage gap in the blue-collar sector. Hence, while possible, it is certainly not obvious that the results presented in Tables 3 and 4 can be explained by the existence of omitted skill variables such that there is racial gap in these omitted skills and these omitted skills only contribute to produc-tivity in the less academically skill-intensive blue-collar sector.
Now consider the second possibility, that blacks have a lower average level of an omitted skill that is important for productivity in both sectors, but black workers are actually paid more than their equally skilled white counterparts are in the white-col-lar sector. In other words, the results reported in Tables 3 and 4 may not be due to discrimination against black workers in the blue-collar sector, but rather a wage pre-mium for blacks compared to whites in the white-collar sector. What might account for such a wage premium for blacks relative to whites in the white-collar sector? The most obvious candidate may be affirmative action. Namely, issues of diversity and
affirmative action pressures may be much stronger with respect to white-collar jobs than blue-collar jobs, causing employers to bid-up salaries for the relatively scarce black white-collar workers relative to their white counterparts.
While this story is certainly plausible, I am currently not aware of studies showing direct evidence for (or against) this notion that affirmative action pressures are stron-ger in the white-collar job sector. Furthermore, such a story suggests that the return on academic skills should be greater for blacks than whites in the white-collar sector, as very high-skilled blacks would be the ones most sought after by firms looking to increase their diversity among their white-collar workers. We can directly examine this implication by estimating an equation similar to the one presented in the last col-umn of Table 3 for workers working in white-collar jobs, but further including an interaction term between the black dummy variable and AFQT score. Strong affirma-tive action pressures in the white-collar sector suggest that the coefficient on this in-teraction term should be positive. Estimating this specification, I find that including this interaction term has no real impact on any of the other coefficients, and more im-portantly, the coefficient on this interaction term is very small in magnitude, not sta-tistically significantly different than zero, and actually is negative in sign (-0.006 with a standard error of 0.040). Hence, this exercise does not provide any evidence that black workers incur a higher return on academic skills than whites in the white-collar sector. While this does not imply that the affirmative action story is necessarily incor-rect, it certainly does not provide any evidence in support of such an argument.
In general, the above discussion reveals that the differential character of racial wage inequality across sectors arguably makes the omitted variable bias story some-what less straightforward than usual.
D. Measurement Error
As discussed by Bollinger (2003), measurement error when skill is proxied for by AFQT scores may potentially lead to an overstatement of conditional racial wage in-equality in regressions of the form estimated in Tables 1, 3, 4, and 5. Such measure-ment error may be particularly important with respect to the results presented here, as one could certainly argue that AFQT is a noisier measure of the ‘‘skills’’ relevant for productivity in the blue-collar sector than the white-collar sector. Hence, it is cer-tainly very plausible that greater measurement error of skills in the blue-collar sector accounts for the relatively large in magnitude and significantly negative coefficient on the black dummy variable that remains after controlling for AFQT scores in the regressions presented in Table 4.
Although it once again must be emphasized that this explanation cannot be dis-missed, it is not entirely free of concerns either. First, for this measurement error story to be correct, not only must both worker ‘‘skills’’ have a relatively strong effect on worker productivity in the blue-collar sector and AFQT be a noisier measure of these ‘‘skills’’ relevant for productivity in the blue-collar sector than the white-collar sector, but also it must be true that there is a significant racial gap in these ‘‘skills’’ most rel-evant for productivity in the blue-collar sector. However, as with the omitted variable explanation discussed above, if these skills relevant for productivity in the blue-collar sector generally differ from academic skills (which must be true for the AFQT to be a noisier skill measure in the blue-collar sector than the white-collar sector), it is not as