Ama Baafra Abeberese is an assistant professor of economics at Wellesley College. Todd J. Kumler is a Ph.D. candidate in economics at Columbia University. Leigh L. Linden is an assistant professor of econom-ics and international affairs at The University of Texas at Austin. They are indebted to many individuals involved with the experiment. They wish to thank Catherine S. Alcaraz, Marie Angeles, Coly Los Baños, Clarissa Isabelle Delgado, Margarita L Delgado, Norlyn Gregorio, Elizabeth E. Zobel and all of the other staff members of the Sa Aklat Siskat Foundation for their support and assistance during the evaluation. All surveys were conducted by TNS Philippines. Finally, they are grateful to an anonymous donor for generously agreeing to fund this research effort. Without his or her help, this project would not have been possible. The data used in this article can be obtained beginning January 2015 through December 2017 from Leigh L. Linden, 2225 Speedway, C3100, Austin, Texas 78712, leigh.linden@austin.utexas.edu.
[Submitted June 2012; accepted August 2013]
ISSN 0022- 166X E- ISSN 1548- 8004 © 2014 by the Board of Regents of the University of Wisconsin System
T H E J O U R N A L O F H U M A N R E S O U R C E S • 49 • 3
Encouraging Children to Read
in School:
A Randomized Evaluation of the Sa Aklat
Sisikat Reading Program
in the Philippines
Ama Baafra Abeberese
Todd J. Kumler
Leigh L. Linden
Abeberese, Kumler, and LindenA B S T R A C T
We show that a short- term (31- day) reading program, designed to provide age- appropriate reading material, to train teachers in their use, and to support teachers’ initial efforts for about a month, improves students’ reading skills by 0.13 standard deviations. The effect is still present three months after the program but diminishes to 0.06 standard deviations, probably due to a reduced emphasis on reading after the program. We fi nd that the program also encourages students to read more on their own at home. We fi nd no evidence that improved reading ability improves test scores on other subjects.
I. Introduction
The Journal of Human Resources 612
function hinders attempts to ameliorate their conditions. We know providing resources without other inputs rarely improves student performance. We know resources can affect improvements when paired with a larger array of inputs (Glewwe and Kremer 2006). We do not know which inputs are necessary. For reading in particular, studies have demonstrated the effectiveness of large comprehensive changes. Banerjee et al. (2007), which studies an Indian remedial education program, is a good example. The intervention causes students’ reading skills to improve but because the intervention changes the educational environment along multiple dimensions—additional teachers, new pedagogical methods, new curriculum, changes to organization of the classroom, and additional resources—we cannot identify which components cause the improve-ments.
We approach this challenge by assessing the causal effects of a reading program that changes children’s educational experience along a single dimension common to more comprehensive reading programs: Getting children to actively read age- appropriate books at school. Schools rarely encourage children to read. Curricula do not emphasize it, and most schools even lack age- appropriate reading material. Com-prehensive reading programs encourage children to read during the school day by providing age- appropriate reading material, segregating time for reading, group read-ing, reading- based classroom games, and other pedagogical changes designed to get teachers to read books with students.1 To better understand the mechanisms through which the larger programs operate, we assess a program that only provides teachers with new materials and trains teachers to use them.
Using a randomized controlled trial set in Tarlac province of the Philippines, we analyze the causal impact of the Sa Aklat Sisikat (SAS) reading program for fourth graders. The program provides age- appropriate reading material, trains teachers to in-corporate reading into their curriculum, and supports these changes through a 31- day reading marathon, during which SAS supports teachers as they encourage students to read. We randomly assigned, by school, 5,510 fourth- grade students in 100 schools to receive the intervention following a baseline assessment of students’ reading skills at the start of the academic year. We then administered two followup surveys: after all of the marathons were complete (four months after baseline) and at the end of the academic year (seven months after baseline).
Simply enabling and encouraging students to read age- appropriate books in school quickly creates meaningful improvements in reading skills. On average, reading scores increased by 0.13 standard deviations by the end of the marathons. However, while the effects did persist, scores declined by 54 percent over the next three months. This suggests that providing resources and training alone is a viable short- term strategy for meaningfully improving children’s reading skills, but by themselves they are insuf-fi cient to sustain those improvements.
The fade- out may have been due to teachers deemphasizing reading. During the marathons, the implementing NGO ensured that teachers provided time for reading, but while the teachers retained all of the materials after the program ended, they also
regained control over the amount of time dedicated to the subject. Consistent with this hypothesis, we fi nd the program increased the number of books children read in school in the last month by 7.17 during the marathon period but by 56 percent less at the second followup. In fact, if we use the number of books read in the last month as a proxy for teachers’ emphasis on in- school reading, the local average treatment effect (LATE) estimates of the change in standard deviations per book read is the same in both periods. This suggests that time spent on reading in school was equally effective in both periods but test scores declined because the time declined after the fi rst survey. To sustain long- term gains, interventions like the read- a- thon may need to be paired with other components designed to support a long- term focus on reading, such as administrative and professional development interventions.
Finally, researchers often prioritized reading, hoping that better reading skills will equip children to learn other subjects and encourage them to read outside of school. We assess the fi rst hypothesis by testing children in math and social studies but we fi nd no effect for either subject. However, we do fi nd that in- school reading encourages children to read outside of school. For example, treatment children read 1.24 and 0.89 more books in the last month at the fi rst and second followup surveys.
The remainder of the paper is organized as follows. Section II provides an overview of the intervention. We describe the research design in Section III. Section IV docu-ments the internal validity of the study, and, in Section V, we estimate the effects of the treatment. We compare the results to those of other studies of reading programs in Section VI. Finally, we conclude in Section VII.
II. The Sa Aklat Sisikat Read- a- Thon
The reading program evaluated in this study is a core program of Sa Aklat Sisikat,2 a nonprofi t organization located in Manila dedicated to building a na-tion of readers. Since its incepna-tion in 1999, SAS has implemented its reading program in every province in the Philippines, reaching over 750 public schools and nearly 150,000 students. The program comprises three components—providing schools with a set of age- appropriate books, training teachers to incorporate reading in the curriculum, and through a 31- day “read- a- thon,” encouraging children to read and supporting teachers as they incorporate reading into their classes. The program targets fourth grade students because the school system expects students to have developed suffi cient reading fl uency to enjoy independent reading by the fourth grade.3
Because most public schools lack age- appropriate reading material,4 SAS donates 60 Filipino storybooks to each classroom. The books are selected for literary value as
2. Sa Aklat Sisikat loosely translates as “books make you cool.”
3. Reading fl uency is the degree to which beginning readers rely less on the phonemic decoding to recog-nize individual words and instead recogrecog-nize whole words. This change signifi cantly increases reading speed and comprehension. Meyer and Felton (1999), for example, defi ne fl uency as “the ability to read connected text rapidly, smoothly, effortlessly, and automatically with little conscious attention to the mechanics of reading, such as decoding.”
The Journal of Human Resources 614
well as student appeal. They also include in both of the country’s offi cial languages, English and Filipino, so that teachers can match the language of instruction.5
Prior to receiving the materials, teachers from each school attend a two- day training session in which they learn to implement the read- a- thon and receive ideas for reading lessons that incorporate reading in an engaging way. For 31 days after the training, they implement the read- a- thon. During this period, the students and teachers use the donated storybooks in hour- long daily reading sessions that include activities such as dramatic storytelling, literary games, and individual silent reading. Students are encouraged to read as many of the 60 storybooks as possible, and each keeps track of the number of books read using an SAS supplied wall chart. Students also write their thoughts about the stories in reading notebooks. Finally, SAS also monitors schools to ensure program fi delity and to support teachers’ use of the new books.
While the read- a- thon itself only lasts 31 days, the schools keep the 60 books. SAS leaves them for the teachers to use at their discretion. Although, they expect the in-tense read- a- thon experience will encourage teachers to continue using the books and students to continue reading.
III. Methodology
A. Research Design
The research sample consists of all fourth- grade classrooms at 100 elementary schools in Tarlac province. Prior to the experiment, Sa Aklat Sisikat had never conducted its reading program there.6 SAS and the province superintendent selected nine geo-graphically proximate districts, representing a range of academic performance levels. From the nine districts, 100 schools were chosen for the experiment; this included all schools from most of the districts.
A baseline survey was conducted in all 100 schools in July 2009. Following the sur-vey, schools were assigned to the treatment and control groups using a matched- pair stratifi ed randomization. Schools were divided into pairs within each district using the school level average baseline reading scores.7 Within each pair, one school was assigned to the treatment group and the other to the control group with equal prob-ability. The read- a- thon was then implemented between the months of September and November.8 Two followup surveys were conducted. The fi rst was conducted immedi-ately after the implementation of the read- a- thon in late November 2009 to measure the immediate effects of the intervention. The second was conducted at the end of the
5. The Philippines has two offi cial languages, Filipino and English, and under an existing executive order, schools are allowed to instruct students in either language. In our sample, students were instructed in Filipino. For this reason, we conducted all evaluations in Filipino as well.
6. In addition, relatively few other reading interventions had been conducted in the province.
7. We have also estimated the primary specifi cations including fi xed effects for the original groupings for the randomization. The results are consistent with those presented below. These results are available upon request.
academic year in late February 2010 to determine whether the effects persisted after SAS ceased interacting with the treatment schools.
B. Data
Each survey round contained a reading skills assessment. These exams were based in part on a national reading examination created and administered annually by the Phil-ippine Department of Education.9 The examination comprised sections covering six competencies. In the fi rst part of the test (referred to as the “Written Test”), students are asked to silently read a written passage and answer written multiple- choice ques-tions relating to the passage. Next, students were given one- on- one oral reading tests covering letter recognition, sound recognition, and word recognition. Finally, students were asked to read a passage aloud (referred to as the “Oral Reading” Test) and then to answer several questions about the passage orally (“Oral Reading Questions”). For each section, we normalized students’ scores relative to the control distribution. Be-cause the values for each section are not measured using the same units, we created a composite reading score by averaging the normalized scores from each section and normalizing the average, again relative to the distribution in the control group.
A local survey fi rm proctored and graded all of the examinations independently of the teachers to guarantee their validity. In addition, teachers were not informed in advance of the content of the exam to prevent them from preparing students for the test. In order to ensure that a large percentage of students were tested, the survey team returned to many schools multiple times.
Each survey also contained data unique to the individual round. In the baseline sur-vey, we collected children’s age, gender, height, weight, number of siblings, religion, and the dialect spoken at home. In the followup surveys, we collected information on children’s reading habits as well as tested students in other subjects to investigate possible spillovers from the intervention. The reading survey asked students about the number of books they read in the last week and the last month both in and out of school. We also asked students to name the title and to describe the plot of the last book they read to assess the validity of their responses. For the alternate subjects, we tested a different subject each round. In the fi rst followup survey, we tested children’s math skills, and, in the second one, we tested children’s knowledge of social studies, the most reading intensive alternate subject.
C. Statistical Models
We utilize three basic models. First, we employ a simple difference specifi cation to directly compare the treatment and control groups:
(1) Yis= α + β1Ts+ εis
The Journal of Human Resources 616
where Yis is the outcome of interest for child i in school s; and Ts is an indicator vari-able for whether the school received the reading program. Hence, the estimate of the coeffi cient β1 indicates the differences between treatment and control schools. We utilize this model to compare baseline differences in sociodemographic characteristics and test scores, and to estimate the effect of the reading program on followup test scores and reading habits.
Since the reading program was randomly assigned to schools and therefore indepen-dent of baseline characteristics, inclusion of observable baseline characteristics and baseline test scores as control variables in Equation 1 improves the precision of the estimated treatment effect. We also run the following specifi cation:
(2) Yis= α + β1Ts+ β2Xis+ ωd + εis
where Yis and Ts are defi ned as in Equation 1, and where Xis is a vector of baseline stu-dent characteristics including composite baseline reading test score, gender, age, reli-gion dummies, dialect dummies, and body mass index (BMI). Since the randomization was stratifi ed within district, we also include district fi xed effects, ωd, in Equation 2.
Finally, we test the validity of the experiment by comparing the effect of the treat-ment on the relative characteristics of the children who attrited from the sample be-tween the baseline survey and the two followup surveys. We run the following differ-ence in differdiffer-ences model:
(3) Yis= α + β1Ts+ β2Attritis + β3Ts*Attritis+ εis
The variables Yis and Ts are defi ned as before, and Attritis is an indicator variable equal to one if student i enrolled in school s was not present in the followup data. The es-timate of β2 then provides the average differences between attritors and nonattritors in the control group, and the estimate of β3 captures the difference- in- differences between attritors and nonattritors in the treatment and control groups.
Because outcomes may have been correlated within school, failure to correct the standard errors could result in an overestimate of the precision of the treatment effects (Bertrand, Dufl o, and Mullainathan 2004). We therefore cluster the standard errors at the school level (the level of randomization) in all of the above models.
IV. Internal Validity
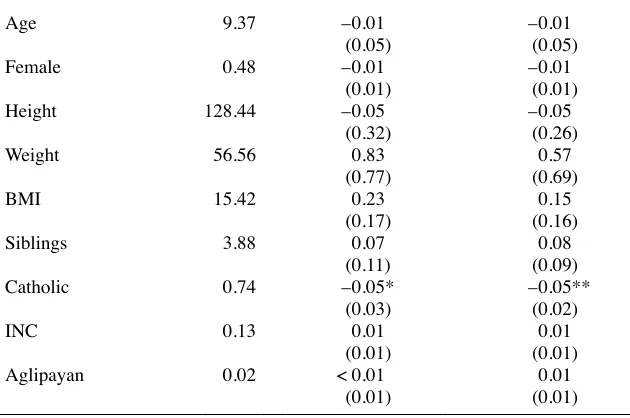
Randomly assigning schools to the intervention ensured that assign-ment was orthogonal to student characteristics correlated with the outcomes of interest. If this holds, then any differences in outcomes between the two groups postinterven-tion can be causally attributed to the intervenpostinterven-tion. To check that student characteristics in each group were indeed similar, we run regressions of student characteristics from the baseline survey on treatment assignment, and then we verify that any changes in the sample due to attrition are also uncorrelated with treatment assignment.
Table 1
Baseline Comparison
Control Mean
Treatment Difference Treatment Difference No Controls District FE
Dependent Variable 1 2 3
Panel A: Standardized Baseline Reading Test Scores
Written test < 0.01 0.02 0.03
(0.05) (0.04)
Letter recognition < 0.01 0.03 0.03
(0.04) (0.04) Sound recognition < 0.01 –0.10 –0.06
(0.07) (0.07)
Word recognition < 0.01 0.02 0.03
(0.06) (0.06)
Oral reading < 0.01 0.02 0.04
(0.06) (0.06) Oral reading questions < 0.01 0.04 0.05
(0.07) (0.05)
Average score < 0.01 0.01 0.03
(0.06) (0.06)
Panel B: Individual Characteristics
Age 9.37 –0.01 –0.01
(0.05) (0.05)
Female 0.48 –0.01 –0.01
(0.01) (0.01)
Height 128.44 –0.05 –0.05
(0.32) (0.26)
Weight 56.56 0.83 0.57
(0.77) (0.69)
BMI 15.42 0.23 0.15
(0.17) (0.16)
Siblings 3.88 0.07 0.08
(0.11) (0.09)
Catholic 0.74 –0.05* –0.05**
(0.03) (0.02)
INC 0.13 0.01 0.01
(0.01) (0.01)
Aglipayan 0.02 < 0.01 0.01
(0.01) (0.01)
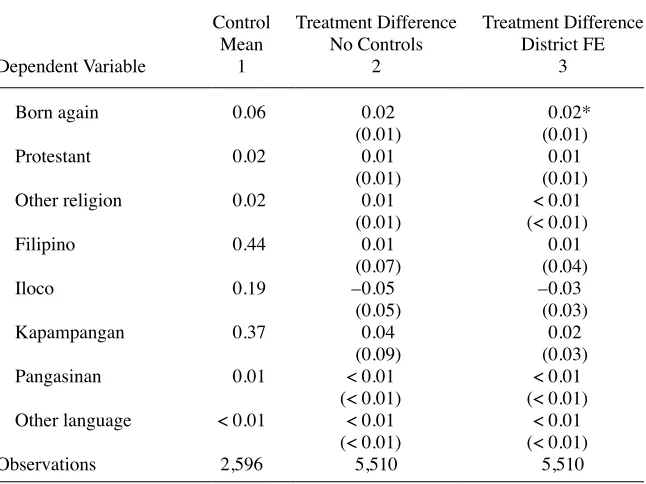
The Journal of Human Resources 618
Control Mean
Treatment Difference Treatment Difference No Controls District FE
Dependent Variable 1 2 3
Born again 0.06 0.02 0.02*
(0.01) (0.01)
Protestant 0.02 0.01 0.01
(0.01) (0.01)
Other religion 0.02 0.01 < 0.01
(0.01) (< 0.01)
Filipino 0.44 0.01 0.01
(0.07) (0.04)
Iloco 0.19 –0.05 –0.03
(0.05) (0.03)
Kapampangan 0.37 0.04 0.02
(0.09) (0.03)
Pangasinan 0.01 < 0.01 < 0.01
(< 0.01) (< 0.01) Other language < 0.01 < 0.01 < 0.01
(< 0.01) (< 0.01)
Observations 2,596 5,510 5,510
Notes: This table presents a comparison of students who took the baseline survey in the control and treatment schools. Column 1 contains the average characteristics of the students in the control schools. Columns 2 and 3 contain estimates of the average difference in characteristics between the control and treatment students, without any controls and with only district fi xed effects. Panel A contains students’ standardized baseline test scores, and Panel B contains students’ demographic characteristics. Standard errors are clustered by school. * indicates statistical signifi cance at the 10 percent level, ** at the 5 percent level, and *** at the 1 percent level.
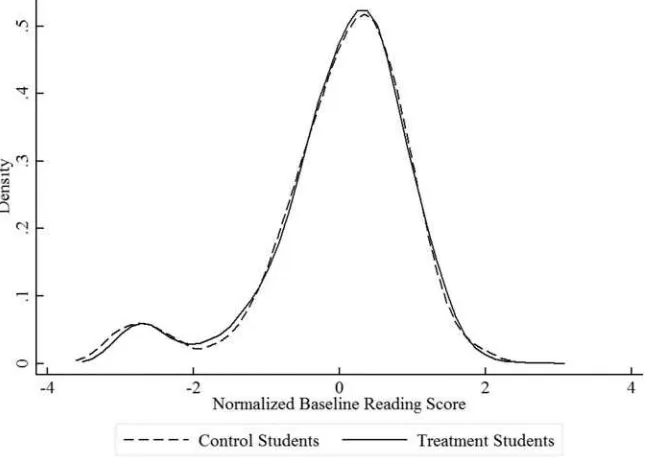
The differences in average characteristics between the control and treatment groups are all practically small and mostly statistically insignifi cant. In Panel A, none of the differences in test scores are statistically signifi cant. Figure 1 shows a plot of the distri-bution of the standardized overall reading test score for the treatment group (solid line) and the control group (dashed line). These distributions almost overlap completely, further corroborating the comparability of the research groups. In Panel B, the only demographic variables with statistically signifi cant differences are those related to religion, but these differences are small in magnitude. For instance, 74 percent of students in the control group were Catholics compared to 69 percent in the treatment group, yielding a minimal difference of fi ve percentage points. The randomization thus appears to have successfully created similar treatment and control groups.
Although the baseline comparisons presented in Table 1 and Figure 1 show that the treatment and control groups were similar at baseline, it is possible that nonrandom at-trition from the two groups between the baseline and followup surveys may have ren-dered the two groups incomparable. Table 2 shows the attrition rates for both groups and the differences between the two. There are no statistically signifi cant differences
between the attrition rates for the control and treatment groups. For both groups, ap-proximately 5 percent of the students who were tested during the baseline survey were absent during the fi rst followup survey, and 11 percent were absent during the second survey. Comparing the rates across research groups, the rates were the same in the fi rst followup and differ by only two percentage points in the second (ten percentage points in the treatment schools and 12 in the control).
Columns 4–6 provide estimates of the attrition rates between followup surveys. Overall, 86 percent of the students were present at both followup surveys (Column 4), and the difference in the rates between research groups is small. Similarly, 91 percent of students who were present at the fi rst followup were also present at the second, and of those present at the second, 97 percent were present at the fi rst.
Even though the attrition rates were similar for both groups, the characteristics of the attritors and nonattritors could have still differed. We check this in Table 3 for the fi rst followup survey. The results for the second followup survey are similar and presented in Table A1 of the online Appendix (available at http://jhr.uwpress.org/). Panel A focuses on test scores while Panel B focuses on demographic characteristics. Columns 1 and 2 contain the average characteristic for nonattritors in the control and treatment groups, respectively, while Column 3 contains the difference between these
Figure 1
Kernel Density Estimates of Baseline Reading Scores
The Journal of Human Resources
620
Table 2
Attrition Rates
Of Baseline Students
Number of Students at Baseline
Fraction at Followup One
Fraction at Followup Two
Fraction at Followup One
and Two
Fraction from Followup One at
Followup Two
Fraction from Followup Two at Followup One
1 2 3 4 5 6
Control schools 2,596 0.95 0.88 0.86 0.90 0.97
Treatment schools 2,914 0.95 0.90 0.87 0.92 0.97
Difference < 0.01 0.02 0.02 0.02 < 0.01
(0.01) (0.02) (0.02) (0.02) (0.01)
Total 5,510 0.95 0.89 0.86 0.91 0.97
Abeberese, Kumler
, and Linden
621
Nonattritors Nonattritors Less Attritors
Control Mean
Treatment Mean
Treatment Difference
Control Difference
Treatment Difference
Difference- in- Difference
Dependent Variable 1 2 3 4 5 6
Panel A: Standardized Baseline Reading Test Scores
Written test < 0.01 0.03 0.02 0.10 0.08 –0.01
(0.05) (0.12)
Letter recognition < 0.01 0.04 0.04 0.09 0.16 0.07
(0.04) (0.11)
Sound recognition 0.01 –0.09 –0.10 0.22 0.11 –0.11
(0.07) (0.12)
Word recognition 0.01 0.05 0.04 0.25 0.47 0.22
(0.06) (0.18)
Oral reading 0.01 0.04 0.03 0.21 0.43 0.22
(0.06) (0.21)
Oral reading questions < 0.01 0.05 0.05 0.06 0.19 0.13
(0.07) (0.14)
Average score 0.01 0.03 0.02 0.22 0.34 0.12
(0.06) (0.16)
The Journal of Human Resources
622
Table 3 (continued)
Nonattritors Nonattritors Less Attritors
Control Mean
Treatment Mean
Treatment Difference
Control Difference
Treatment Difference
Difference- in- Difference
Dependent Variable 1 2 3 4 5 6
Panel B: Individual Characteristics
Age 9.32 9.31 –0.01 –0.91 –0.90 < 0.01
(0.04) (0.29)
Female 0.48 0.47 –0.01 0.07 0.10 0.04
(0.01) (0.06)
Height 128.27 128.27 < 0.01 –3.34 –2.33 1.00
(0.30) (1.57)
Weight 56.35 57.25 0.90 –4.04 –2.68 1.36
(0.79) (2.13)
BMI 15.41 15.64 0.23 –0.21 –0.07 0.14
(0.18) (0.32)
Siblings 3.84 3.92 0.08 –0.83 –0.65 0.17
(0.11) (0.25)
Catholic 0.74 0.69 –0.05* 0.10 0.09 –0.01
(0.03) (0.07)
INC 0.12 0.13 0.01 –0.08 –0.05 0.03
Abeberese, Kumler
, and Linden
623
Born again 0.06 0.08 0.02 < 0.01 –0.05 –0.04
(0.01) (0.05)
Protestant 0.03 0.04 0.01 0.02 < 0.01 –0.02
(0.01) (0.02)
Other religion 0.02 0.02 0.01 –0.04 0.01 0.05**
(0.01) (0.02)
Filipino 0.44 0.44 0.01 –0.04 –0.01 0.02
(0.07) (0.07)
Iloco 0.19 0.15 –0.04 –0.03 0.06 0.09*
(0.05) (0.05)
Kapampangan 0.37 0.40 0.03 0.06 –0.02 –0.08
(0.09) (0.06)
Pangasinan 0.01 < 0.01 < 0.01 0.01 –0.01 –0.02*
(< 0.01) (0.01)
Other language < 0.01 < 0.01 < 0.01 < 0.01 –0.02 –0.02
(< 0.01) (0.02)
Observations 2,463 2,765 5,228 2,596 2,914 5,510
The Journal of Human Resources 624
averages estimated using Equation 1. All of the differences are statistically insignifi -cant with the exception of the proportion of non- attritors who were Catholic. How-ever, this difference is small in magnitude (fi ve percentage points) and is identical to the difference found for the entire sample during the baseline survey.
The last three columns of Table 3 show that the differences between the character-istics of the nonattritors and attritors are similar across the two groups, indicating that there was no selection in the sample due to attrition. Column 4 presents the difference in average characteristic between the nonattritors and the attritors in the control group. Column 5 presents the same statistic for the treatment group, and Column 6 presents the difference between the two statistics using Equation 3. These differences are mostly statistically insignifi cant, and all of them are small in magnitude. We therefore conclude that the comparability of the control and treatment groups was sustained throughout the followup surveys.
V. Results
A. Effect on Reading Habits
The primary goal of the SAS reading program is to provide children the opportunity and means to read in- school and to encourage them to do so. As a result, we start by assess-ing whether or not students in schools assigned to the program did, in fact, read more in school. Table 4 compares reading rates across the two groups based on survey responses during the fi rst and second followup surveys. Variables include students’ responses to questions on whether or not they had read a book and the number of books read in the last week and month. To check that students who claim to have read a book actually did, we recorded whether children could name and summarize the last book they read.
The fi rst three columns report results from the fi rst followup survey while the last three columns report results from the second followup survey. For each survey, the fi rst column provides the average responses for the control group. The second and third columns provide estimates of the differences between groups without controls (Equation 1) and with controls (Equation 2).
During the period in which the read- a- thon was implemented, the program did sig-nifi cantly increase the amount students read in school. The results in Columns 1 and 3 show that 68 percent of the students in the control group reported reading a book in school in the past week on the fi rst followup survey, and the program increased this by 19 percentage points. The students in the control group reported reading an average of 1.9 books in school in the past week and the program increased this by 2.3 books. In the past month, the program increased the number of books read by 7.2 books.
Further corroborating these results,10 we fi nd signifi cant differences in the propensity
Abeberese, Kumler
Did student read any book (excluding textbooks) in the last week in school?
0.68 0.18*** 0.19*** 0.51 0.22*** 0.22***
(0.03) (0.03) (0.04) (0.04)
Number of books (excluding textbooks) read in the last week in school
1.85 2.35*** 2.33*** 1.34 0.98** 0.86
(0.52) (0.56) (0.49) (0.53)
Number of books (excluding textbooks) read in the last month in school
2.32 7.41*** 7.17*** 1.54 3.32*** 3.12***
(0.88) (0.82) (0.56) (0.42)
Is student able to give name of last book read in school?
0.53 0.29*** 0.30*** 0.47 0.26*** 0.26***
(0.04) (0.03) (0.04) (0.03)
Is student able to describe last book read in school?
0.55 0.22*** 0.23*** 0.46 0.23*** 0.23***
(0.04) (0.03) (0.04) (0.03)
Joint Test of All Differences
Chi2(5) 108.79 119.68 68.74 99.66
p- value < 0.0001 < 0.0001 < 0.0001 < 0.0001
The Journal of Human Resources 626
to read if we only consider a child as having read a book if he or she can provide specifi c information about the last book read. If we consider children to have read a book only if they claim to have read a book and could provide the title, 53 percent of students in the control group read a book in the last week and the increase due to the program was 30 percentage points. If the condition is to describe the plot, the program caused 23 percentage points more children to have read a book. All of these results are statistically signifi cant at the 1 percent level and are basically the same for the different specifi cations presented in Columns 2 and 3.
After the program, the effects on student reading seem to have continued but at about half of the previous rate. In terms of the probability that a student read a book (Row 1) or could identify the title (Row 4) or plot (Row 5), the effects of the program seem to be the same as during the read- a- thon period. However, when the questions focus on the number of books rather than just whether or not a child read any book, the magnitudes decline. The effect on the number of books read in the last week is a statistically insignifi cant 0.86 and the effect on the number of books read in the last month is 3.12, statistically signifi cant at the 1 percent level. This suggests that the pro-gram did have a long- term effect but that the amount of time children spend reading declined after the direct support of the program was removed.
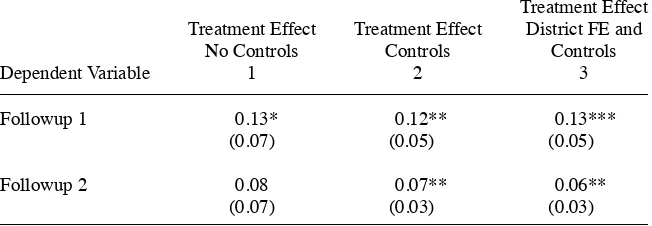
B. Effect on Reading Ability
We now explore the extent to which the changes in reading affected students’ reading ability. Table 5 presents estimates of the differences between the standardized average reading test scores of the control and treatment groups. We present three estimates: An estimate of the treatment effect without any controls (Column 1, Equation 1), an esti-mate including only demographic characteristics (Column 2), and an estiesti-mate control-ling for demographic characteristics and district fi xed effects (Column 3, Equation 2). Starting with the results from the fi rst followup survey, the program had a distinct immediate effect on students’ reading skills of 0.13 standard deviations. The results are consistent across the various specifi cations, highlighting the comparability of the treatment and control groups. And, in our preferred specifi cation (Column 3), the re-sults are statistically signifi cant at the 1 percent level. Consistent with the reduction in the amount of reading children do at school, we fi nd that the treatment effect declines between the fi rst and second followup surveys to 0.06. The estimate is still consistent across the specifi cations and statistically signifi cant at the 5 percent level, but it is 54 percent smaller.
To further investigate this relationship, we use the number of books a child reports reading in the last month in school as a proxy for the time teachers spend on reading. We then estimate local average treatment effects of reading on students’ reading test scores.11 If the decline in test scores resulted from the reduction in the time teachers spent on reading, then the coeffi cient on the LATE estimate should be similar for both surveys. This is, in fact, the case. The estimates are 0.017 (p- value 0.017) and 0.020
standard deviations per book (p- value 0.056) for the fi rst and second surveys respec-tively.12 This suggests that the effect of the curriculum change remained consistent across the two periods and that the decline in test scores was due to the reduced focus on children reading after the read- a- thon period.
We also investigate differences in the observed treatment effects for a number of subsets of our sample defi ned through the baseline survey. In results not presented in this manuscript,13 we test for differences in treatment effects by gender, age, language spoken at home, and baseline reading score. We fi nd almost no evidence of systemati-cally different treatment effects for different types of students for either followup pe-riod. The one exception is that we fi nd that, for the fi rst followup period, the treatment effect increases with students’ baseline test scores. In a regression interacting treatment effect with baseline score, we fi nd that students experienced a 0.12 standard deviation increase at the control baseline mean (statistically signifi cant at the 1 percent level) and then experienced an increased effect of 0.09 standard deviations for each additional standard deviation they scored at baseline (signifi cant at the 10 percent level). While both coeffi cients are still positive at the second followup, the magnitudes are much smaller. They are 0.06 for the effect at the control mean and 0.04 for the interaction
12. We perform the same estimates using the number of books read in the last week and fi nd similar results. However, the estimates are less precise, possibly because the number of books read in the last week is a weaker proxy than the number read in the last month.
13. Results are available upon request. Table 5
Effects on Reading Test Scores
Treatment Effect No Controls
Treatment Effect Controls
Treatment Effect District FE and
Controls
Dependent Variable 1 2 3
Followup 1 0.13* 0.12** 0.13***
(0.07) (0.05) (0.05)
Followup 2 0.08 0.07** 0.06**
(0.07) (0.03) (0.03)
The Journal of Human Resources 628
effect; only the fi rst remains statistically signifi cant at conventional levels (5 percent level). It may be that stronger students were able to utilize the supplied books indepen-dently of the teacher than weaker students, and, as a result, they benefi ted more than their classmates from the opportunity to read in school. This is consistent with other studies that have observed that stronger students tend to experience larger treatment effects from self- directed interventions (for example, He, Linden, and MacLeod 2008).
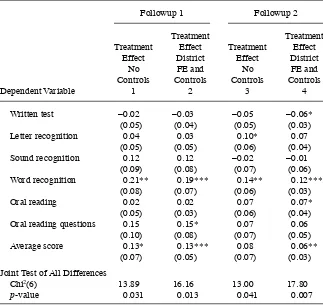
Finally, Table 6 disaggregates the effect on the reading test by competency. The fi rst two columns report the results from the fi rst followup survey while the last two columns report the results from the second. The fi rst column for each of the followup surveys provides the differences between the average test scores of the control and treatment groups using Equation 1. The second column provides the estimates with the full set of controls using Equation 2. Finally, the last two rows of Table 6 report the chi- squared statistic and p- value from a test of the joint signifi cance of the coeffi cients on the treatment indicator from the regressions for the individual components of the reading test, estimated using seemingly unrelated regressions.
On both the fi rst and second followup surveys, the program had a positive effect on most of the components on the test (the written part was the one exception). In the fi rst fol-lowup survey, there are sizable treatment effects on sound recognition, word recognition, and the ability to answer questions from the oral reading passage. The effects on word recognition and the oral questions are individually statistically signifi cant at the 1 and 10 percent levels respectively, but the effect on sound recognition is not statistically signifi -cant at conventional levels. The joint test of an effect on all skills shows that the results for the different components are jointly statistically signifi cant with a p- value of 0.013.
In the second followup, the results are generally the same, but with the overall aver-age diminished in magnitude. In this round, word recognition and oral reading effects are positive and statistically signifi cant. Word recognition remains the strongest effect of the program. But again, all components show positive treatment effects except the written test and sound recognition. Overall, the joint hypothesis of the signifi cance of the effects on each component is still statistically signifi cant at the 1 percent level.
C. Other Outcomes
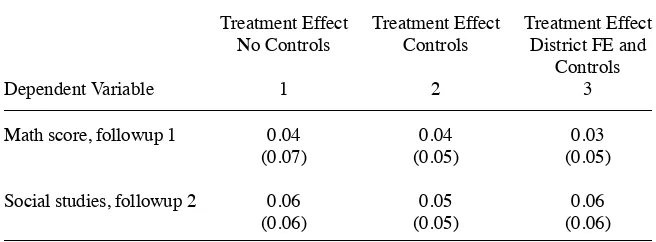
In addition to an effect on students’ reading abilities, encouraging children to read in school could also have effects on other outcomes as well. First, due to their improved reading skills, students may have been better equipped to study other subjects because it might allow them to read textbooks or other classroom materials. Table 7, which has a similar format as Table 5, presents the estimated treatment effects on the other subjects tested during the followup surveys. We fi nd no effect on either subject. However, in the second followup survey, the treatment effect for social studies is of the same magnitude as the effect on the reading test. It is insignifi cant because it is measured less precisely.14
Second, although teachers reportedly never allowed children to take books home,15 reading more in school may also have made children more likely to read outside of school. To assess this, we asked children the same kinds of questions about their reading
Table 6
Effects on Reading Test Scores by Subject
Followup 1 Followup 2
Dependent Variable 1 2 3 4
Written test –0.02 –0.03 –0.05 –0.06*
(0.05) (0.04) (0.05) (0.03)
Letter recognition 0.04 0.03 0.10* 0.07
(0.05) (0.05) (0.06) (0.04)
Sound recognition 0.12 0.12 –0.02 –0.01
(0.09) (0.08) (0.07) (0.06) Word recognition 0.21** 0.19*** 0.14** 0.12***
(0.08) (0.07) (0.06) (0.03)
Oral reading 0.02 0.02 0.07 0.07*
(0.05) (0.03) (0.06) (0.04) Oral reading questions 0.15 0.15* 0.07 0.06
(0.10) (0.08) (0.07) (0.05)
Average score 0.13* 0.13*** 0.08 0.06**
(0.07) (0.05) (0.07) (0.03)
Joint Test of All Differences
Chi2(6) 13.89 16.16 13.00 17.80
p- value 0.031 0.013 0.041 0.007
The Journal of Human Resources 630
activities at home as at school. Table 8 presents the estimated results. Overall, we fi nd a small but statistically signifi cant effect on both surveys. For the fi rst followup survey, only the effect of 1.24 on the number of books read in the last month is indi-vidually signifi cant but jointly, all of the estimates are statistically signifi cant at the 1 percent level. In the second followup survey, the standard errors fall signifi cantly, and although the point estimates are similar to those in the fi rst round, all but the effect on the probability of reading any book outside of schools (row one) are statistically signifi cant at conventional levels. This suggests that engaging students in reading in school increased the number of books read outside of school as well. But like the ef-fect on test scores, the efef-fect declined after the read- a- thon. 16
VI. Comparisons to Other Programs
At 0.13 standard deviations, the direct effect of the program during implementation is consistent with the effects of many programs on native language
16. Verifying that the effect of time spent reading in school is consistent for both periods, as they are for test scores, is complicated by the imprecision of the estimated effect on reading outside of school on the
fi rst followup survey. We fi nd consistent results for the number of books read in the last month, but for the number read in the last week, the 95 percent confi dence interval around the fi rst-year followup LATE estimate, (-0.192, 0.903) includes estimates that are more than twice the magnitude of those estimated using the second followup survey.
Table 7
Effects on Math and Social Studies Test Scores
Treatment Effect
No Controls
Treatment Effect Controls
Treatment Effect District FE and
Controls
Dependent Variable 1 2 3
Math score, followup 1 0.04 0.04 0.03
(0.07) (0.05) (0.05)
Social studies, followup 2 0.06 0.05 0.06
(0.06) (0.05) (0.06)
Abeberese, Kumler
Did student read any book (excluding textbooks) in the last week outside school?
0.48 < 0.01 0.01 0.45 0.01 0.01
(0.04) (0.04) (0.04) (0.03)
Number of books (excluding textbooks) read in the last week outside school
1.40 0.18 0.36 0.77 0.35*** 0.34***
(0.43) (0.28) (0.11) (0.09)
Number of books (excluding textbooks) read in the last month outside school
1.61 1.28*** 1.24*** 1.20 0.92*** 0.89***
(0.30) (0.25) (0.18) (0.16)
Is student able to give name of last book read outside school?
0.38 0.03 0.04 0.36 0.08** 0.07**
(0.04) (0.03) (0.03) (0.03)
Is student able to describe last book read outside school?
0.39 0.01 0.02 0.37 0.06* 0.06*
(0.04) (0.03) (0.04) (0.03)
Joint Test of All Differences
Chi2(6) 36.67 38.26 71.19 75.18
p- value < 0.0001 < 0.0001 < 0.0001 < 0.0001
The Journal of Human Resources 632
skills.17,18 Machin and McNally (2008), Muralidharan and Sundararaman (2011), Mu-ralidharan and Sundararaman (2010), and Das et al. (2010) fi nd effects in this range, for example. This is, however, smaller than the effects observed for others. Banerjee et al. (2007) fi nd a total effect of 0.187 standard deviations for a remedial educa-tion program immediately after two years of implementaeduca-tion, and He, Linden, and MacLeod (2009) fi nd a one- year effect of 0.695 standard deviations for a preschool reading program after a year of implementation.
One can also take into account the costs of the program. However, it is important to keep two caveats in mind. First, this program only affects reading skills while many of the other programs are designed to affect multiple subjects. Second, few studies report treatment effects for native language skills as well as information on program costs. With these caveats in mind, the SAS reading program seems to fall in the mid- range of programs. The cost per tenth of a standard deviation gain per child is 8.52 USD.19 This is higher than the interventions considered by Banerjee et al. (2007), Muralidharan and Sundararaman (2011), Muralidharan and Sundararaman (2010), and Das et al. (2011), all of which cost between 1.53 USD and 3.11 USD per tenth of a standard deviation per child for native language skills in India. It is, however, much lower than Machin and McNally (2009) whose UK- based program costs $46.42 USD per tenth of a stan-dard deviation per child.20
VII. Conclusion
We demonstrate that a short- term reading program that provides age- appropriate reading material and trains teachers to use it can have a signifi cant effect on the reading ability of primary school children. Reading test scores of students in-creased by 0.13 of a standard deviation immediately following the intervention. These gains in reading ability were still evident, albeit smaller at about 0.06 standard devia-tions, three months after the end of the intervention. We also fi nd that the additional focus on reading in school causes a small increase in the number of books children read on their own at home, but we fi nd no evidence that improved reading skills trans-lated into better performance in other subjects.
17. These comparisons require two important caveats. First, we restrict the set of programs to only those that attempted to improve students’ native language skills because the effects of these programs are usually much lower than effects observed for other subjects, such as math and foreign languages. (See Banerjee et al. 2007, for example.) Second, we focus on the effect of the program observed directly following program implemen-tation because these are the effects most often reported. While fade-out after program implemenimplemen-tation is an important issue, few studies estimate such longer-term treatment effects, and those that do, typically fi nd signifi cant fade-out. For example, Banerjee et al. (2007) fi nd that, while the effects of the remedial education program on reading persist for the weakest students, the 0.33 standard deviation overall treatment effect of a remedial education program after two years of treatment declines to a statistically insignifi cant 0.040 standard deviations a year after students leave the intervention.
18. The effect is, of course, larger than those of programs that are found to have no overall average effect such as Fryer (2011) and Kim and Guryan (2010).
19. All cost information has been adjusted to 2010 USD using the U.S. Consumer Price Index for All Urban Consumers including all available items.
These results suggest that providing additional resources along with training and support in their use can improve students’ test scores in the short run but in order to sustain these gains, additional support is necessary. We show that while the focus on reading in the curriculum diminished between the fi rst and second surveys, the ef-fectiveness of reading did not change. The decline in test scores seems to have been solely due to a reduction in the emphasis on reading in the curriculum after the direct support of the NGO was removed. This suggests that teachers retained the ability to teach reading more effectively but simply chose to do so less often. To make the additional resources effective, researchers may need to identify additional supports that can sustain teachers’ focus on reading. This might, for example, be a change in teachers’ incentives (for example, having principals change the reward structure faced by teachers to emphasize reading) or strategies for reminding teachers of the importance of allocating time for reading (such as text messages or even long- term periodic monitoring).
References
Banerjee, Abhijit, Shawn Cole, Esther Dufl o, and Leigh Linden. 2007. “Remedying Education: Evidence from Two Randomized Experiments in India.” Quarterly Journal of Economics
122(3):1235–64.
Bertrand, Marianne, Esther Dufl o, and Sendhil Mullainathan. 2004. “How Much Should We Trust Difference- in- Differences Estimates?” Quarterly Journal of Economics 119(1):249– 75.
Das, Jishnu, Stefan Dercon, James Habyarimana, Pramila Krishnan, Karthik Muralidharan, and Venkatesh Sundararaman. 2011. “School Inputs, Household Substitution, and Test Scores.” American Economic Journal: Applied Economics 5(2):29–57.
Fryer, Roland. 2011. “Financial Incentives and Student Achievement: Evidence from Random-ized Trials.” Quarterly Journal of Economics 126(4):1755–98.
Glewwe, Paul, and Michael Kremer. 2006. “Schools, Teachers and Education Outcomes in Developing Countries.” In Handbook of the Economics of Education, Vol. 2, ed. Eric Hanu-shek and Finis Welch, 945–1017. Amsterdam: Elsevier.
He, Fang, Leigh Linden, and Margaret MacLeod. 2009. “A Better Way to Teach Children to Read? Evidence from a Randomized Controlled Trial.” Working Paper. Department of Economics. The University of Texas at Austin.
Kim, James, and Jonathan Guryan. 2010. “The Effi cacy of a Voluntary Summer Book Reading Intervention for Low- Income Latino Children from Language Minority Families.” Journal of Educational Psychology 102(1):20–31.
Machin, Stephen, and Sandra McNally. 2009. “The Literacy Hour.” Journal of Public Econom-ics 92:1441–62.
Meyer, Marianne, and Rebecca Felton. 1999. “Repeating Reading to Enhance Fluency: Old Approaches and New Directions.” Annals of Dyslexia 49(1):283–306.
Muralidharan, Karthik, and Venkatesh Sundararaman. 2010. “Contract Teachers: Experimen-tal Evidence from India,” Working Paper. Department of Economics. The University of California at San Diego.
———. 2011. “Teacher Performance Pay: Experimental Evidence from India.” Journal of Political Economy 119(1):39–77.
UNESCO Institute for Statistics. 2012. “Adult and Youth Literacy.” UIS Fact Sheet