(IJSBAR)
I SSN 2 3 0 7 - 4 5 3 1 (Print & Online)
http://gssrr.org/index.php?journal=JournalOfBasicAndApplied
---
Financial Analysis Report: Malaysia Airlines 2007 - 2011
Gilbert O’Neil Mushure*
Department of Accountancy, University of Zimbabwe,P.O Box MP167 Mount Pleasant Harare Zimbabwe
Email: [email protected]
Abstract
This work is an analysis of the annual reports of Malaysia Airlines Berhad from 2007 to 2011. Profitability
analysis was done on the financial statements of the company from 2007 to 2011. Cash and working capital
management analysis were done on the financial statements of 2010 and 2011. It was found that Malaysia
Airlines Berhad was constantly suffering from high costs of operations which resulted in consecutive negative
gross profit over the years.Net profit remained positive only as a result of other income, gains and profits from
associate companies up to 2011. It was also found that Malaysia Airlines Berhad was in a bad working capital
position over the period covered.
Keywords: Malaysia Airlines, Profitability, Cash Flow, Working Capital Management, Gross Margin, Operating
Margin, Net Profit Margin, Return on Capital Employed, Trend Analysis, Current Ratio, Quick Ratio
1.Introduction
Malaysia Airlines is an international airline which flies around 37,000 passengers daily to about 80 destinations
worldwide [1]. The airline has been recognized for the quality of its services and practices, receiving notable
awards including World’s Best Cabin Crew in 2007 and 2009, and 5 Star Airline in 2007 and 2009 by Skytrax
UK [1]. Malaysia Airlines was incorporated on 12 October 1937 as Malayan Airways Limited following a joint
venture proposal by three companies to the then government to run an air service between Penang and
Singapore [1].
--- * Corresponding author.
E-mail address: [email protected]
Nearly 10 years later Malaysia Airlines had its first commercial flight as the national airline and in the following
decade it became an international airline [1]. In 1963 it changed its name to Malaysian Airlines Limited and
Borneo Airways was incorporated into the company [1]. In 1965 with the separation of Singapore from
Malaysia, Malaysian Airlines became a bi-national airline and renamed Malaysia-Singapore Airlines [1].
However in 1973 the company split from the bi-national arrangement and established itself as Malaysian Airline
Limited, subsequently renamed Malaysian Airline System or Malaysia Airlines [1].
Malaysia Airlines has been operating in a tough global economic environment because of the global financial
crisis which resulted in lower volumes of travelers [2]. This has been coupled with increased competition from
Low Cost Carriers (LCC) and Middle Eastern airlines [3]. As a result the company incurred losses in 2011 and
as a result it has adopted a business turnaround plan to return it to profitability by 2013.
2.Group Profitability Ratios 2007 – 2011
Table 1: Group profitability ratios 2007 – 2011
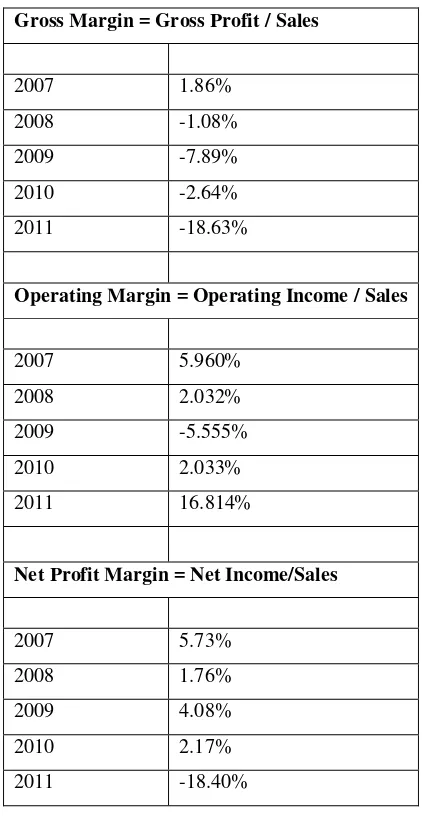
Gross Margin = Gross Profit / Sales
2007 1.86%
2008 -1.08%
2009 -7.89%
2010 -2.64%
2011 -18.63%
Operating Margin = Operating Income / Sales
2007 5.960%
2008 2.032%
2009 -5.555%
2010 2.033%
2011 16.814%
Net Profit Margin = Net Income/Sales
2007 5.73%
2008 1.76%
2009 4.08%
2010 2.17%
2011 -18.40%
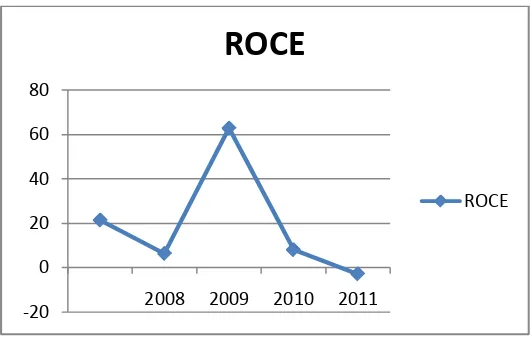
Table 2: Return on capital employed
Return on Capital Employed = Net Income / Capital Employed
2007 2008 2009 2010 2011
Return on capital 21.37% 6.32% 62.79% 8.00% -2.91%
3. Trend in Profitability Ratios 2007 – 2011
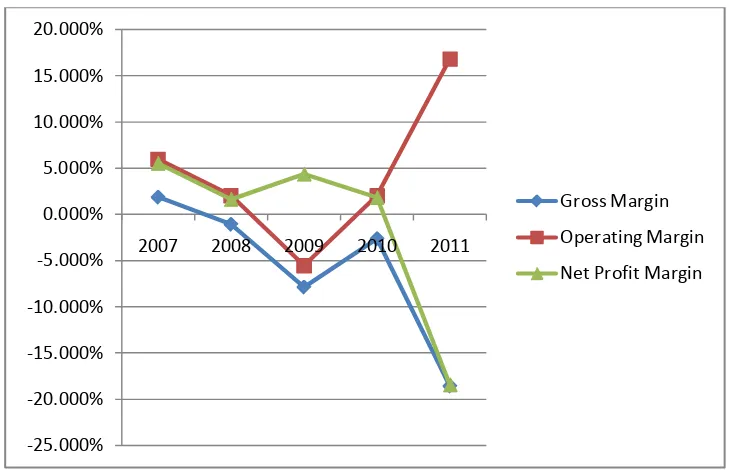
Table 3: Trend in profitability ratios 2007 - 2011
Gross Margin Operating Margin Net Profit Margin ROCE
2007 1.857% 5.960% 5.524% 21.37%
2008 -1.084% 2.032% 1.633% 6.32%
2009 -7.895% -5.555% 4.360% 62.79%
2010 -2.645% 2.033% 1.828% 8%%
2011 -18.627% 16.814% -18.466% -2.91%
Figure 1: Graph of trend in profitability ratios 2007 - 2011 -25.000%
-20.000% -15.000% -10.000% -5.000% 0.000% 5.000% 10.000% 15.000% 20.000%
2007 2008 2009 2010 2011
Gross Margin
Operating Margin
Net Profit Margin
Figure 2: Graph of trend in return on capital employed
4. Interpretation of Profitability Ratios
In 2007-8 and 2010-11 Malaysia Airlines had a negative gross margin and a positive operating margin [4]. This
indicated that the company had been selling its services lower than their cost in these years. From the analysis of
the financial statements, it was seen that the company had to rely on other operating income to make a positive
net profit overall in these years. In 2009 the company had a negative profit from operations, whichresulted in a
negative operating margin for 2009; this meant other operating income failed to offset the negative gross profit.
The net profit margin narrowly remained positive during from 2007-10 because it was boosted by derivative
gains and share of results from associated companies [4]. In 2011 however these gains and profit shares failed to
offset the high value of operating expenditure.
The trend wasthat Malaysia Airlines had been less and less profitable from 2007 to 2011 and its losses arising
from cost of sales higher than sales had often been offset by other operating income, gains and share of profits
from associated companies.
Meanwhile ROCE fluctuated during the 5 year period, reaching a peak of 62.79% in 2009 and becoming
negative in 2011 [4].
5. Evaluation of Cash and Working Capital Management
Malaysia Airlines Group was in a bad liquidity position in both 2010 and 2011. Though the company had cash
and cash equivalents of RM958 million in 2011 and RM1.9 billion in 2010 [4], the liquidity ratios indicated that
these were not sufficient compared to the company’s current liabilities.
Its Current Ratio, the ratio of current assets to current liabilities indicating its ability to settle its short term debts,
was 0.386 and 0.737 in 2011 and 2010 respectively [4]. A Current Ratio of 1 is considered safe, as it indicates -20
0 20 40 60 80
2008 2009 2010 2011
ROCE
ROCE
that a company has sufficient current assets to settle current debts. The company was in a worse cash position in
2011 than in 2010.
Its Quick Ratio, the ratio of current assets excluding inventory to current liabilities, indicating its actual ability
to settle current liabilities with assets more easily changed to cash than inventory, was 0.335 and 0.659 in 2011
and 2010 respectively [4]. The company was therefore also in a worse cash position in 2011 than in 2010
according to the Quick Ratio. The Net Working Capital of the company changed from 2010 to 2011 by -
RM2,945,546[4] which was unfavorable.
6. Limitations of the study
6.1 Concepts, conventions and regulations in the preparation of annual report
According to the Notes to the Financial Statements 2011, the annual reports were prepared on the historical cost
convention in accordance with the International Financial Reporting Standards (IFRS) and the Companies Act
1965 of Malaysia [4]. The concept of historic cost means assets and transactions are measured at historic cost in
the annual reports. Financial Reporting Standards give rules on how each transaction is treated for the purposes
of reporting in the annual report within the Statement of Income, Statement of Financial Position, Statement of
Cash Flows, Statement of Equity and Notes to the Financial Statement. The Companies Act provides further
guidelines about what companies should provide in the annual report.
6.2 Contents and significance of director’s report, auditors report and chairman’s statement
The Directors Report stated the principal activities of the company, a brief summary of the company’s
performance in the past financial year and stated the names of the directors, their participation in running the
company by attending board meetings, their remuneration and interests (shareholding or other) in the company.
The purpose of the Directors Report is to enable users of the annual report to assess the activities and
performance of directors to help them in decision making such as whether to vote in the directors for another
year at the Annual General Meeting [5].
The Auditors Report stated the auditor’s opinion as to the accuracy of the financial statements in giving a true
picture of the financial state of the company, and it also stated that the financial statements preparation are the
responsibility of the directors, and that the auditors responsibility is limited to assessing the statements only. The
Auditors Report’s purpose is to give users of the financial statements assurance that the financial statements are
correct so that they can rely on them in making decisions [5].
The Chairman’s Statement gave an introduction to the affairs of the company over the past financial year. It
stated in general how well the company performed, changes in directors, and the short term objectives of the
company and its future plans. The purpose of the statement is to give an overview of the annual report to the
users of the financial statements, in as much as it is to provide encouragement to all stakeholders about the
future prospects of the company [5].
The above are the inherent benefits and limitations of financial reporting, and the usefulness of information
about the financial performance and positioning of the company drawn from annual financial statements [6, 7].
7. Conclusion
In 2010 Malaysia Airlines was profitable, making a net profit after tax of RM167 million. However in 2011 it
made a huge loss of RM2.5 billion. The losses were attributed to high fuel costs and a substantial provision of
RM1.09 billion for delivery of aircraft, impairment of freighters and stock obsolescence [4]. In previous years
from 2007 to 2009 the company made net profits after tax with the highest profit recorded in 2007 amounting to
RM811 million; thereafter profits declined to RM245 million in 2008 and recovered to RM450 million in 2009.
This meant the company was faring well despite the economic and market environment highlighted;
characterized by the global financial crisis and increased competition. However the company was suffering from
high operating costs (cost of sales) as indicated by the profitability ratios, incurring consecutive gross profit
losses from 2008 to 2011; the company’s positive net profits after tax arose from other income, namely gains
and share of profits from associates. The company also went into negative net working capital in 2009 and its
working capital position was negative up to the financial year ended 2011.
Taking the above into account, from a quantitative point of view Malaysia Airlines needed to drastically reduce
its costs so it could have positive gross profit marginsin order to have a sustainable future – a company cannot
continue to operate if it sells its products below cost. Malaysia Airlines also needed to improve its working
capital management so it could be in a better liquidity position. From a qualitative standpoint, the company was
likely to continue providing quality services to flyers in future noting the investments made in new aircraft and
the awards it had won in the past for high standard of services. This would help the company improve its
performance and financial position in future.
References
[1] A promising start 2012 [On-line], Available
http://www.malaysiaairlines.com.my/my/en/corporate-info/our-story.html [Apr. 10, 2012]
[2] Malaysia Airlines Berhad 2011 Annual Report CEOs Statement [On-line],
Availablewww.malaysiaairlines.com.my[Apr. 10, 2012]
[3] Business Plan 2012 [On-line], Available
http://www.malaysiaairlines.com.my/my/en/corporate-info/our-story.html [Apr. 12, 2012]
[4] Malaysia Airlines Berhad - Company Annual Reports2007, 2008, 2009, 2010, 2011[On-line],
Available www.malaysiaairlines.com.my [Apr. 12, 2012]
[5] A. Atrill, G. Mclaney, Accounting and Finance for Non- Specialists, 6th ed. Prentice Hall, 2011,
pp.7-13
[6] G. Holmes, A.Sugden, A., P. Gee, Interpreting Company Reports and Accounts, 10th ed. Prentice Hall,
2011, p. 25
[7] M. Carey, C. Knowles, J. Tower-Clark, Accounting A Smart Approach, Oxford University Press, 2011,
p.11