The preparation of the
Financial Stability Review (FSR)
is one of the avenues
through which Bank Indonesia achieves its mission
≈to safeguard the stability of the Indonesian
Rupiah by maintaining monetary and financial system stability for sustainable national
economic development∆.
Publisher :
Bank Indonesia
Jl. MH Thamrin No.2, Jakarta Indonesia
Information and Orders:
This edition is published in September 2009 and is based on data and information available as of June 2009, unless stated otherwise.
The PDF format is downloadable from: http://www.bi.go.id
For inquiries, comments and feedback please contact:
Bank Indonesia
Directorate of Banking Research and Regulation Financial System Stability Bureau
Jl.MH Thamrin No.2, Jakarta, Indonesia Phone : (+62-21) 381 8902, 381 8075 Fax : (+62-21) 351 8629
Email : [email protected]
FSR is published biannually with the objectives:
To improve public insight in terms of understanding financial system stability.
To evaluate potential risks to financial system stability.
To analyze the developments of and issues within the financial system.
iii
Foreword vi
Overview 3
Chapter 1 Macroeconomic Conditions and
the Real Sector 9
Macroeconomic conditions 9
Real Sector Conditions 14
Chapter 2 The Financial Sector 21
Indonesian Financial System Structure 21
Financial Sector Resilience 22
Banking Industry 22
Funding and Liquidity Risk 22
Credit Growth and Risk 25
Market Risk 29
Profitability and Capital 31
Non-Bank Financial Institutions And The 34
Capital Market
Finance Companies 34
Insurance Companies 36
Capital Market 38
Table of Contents
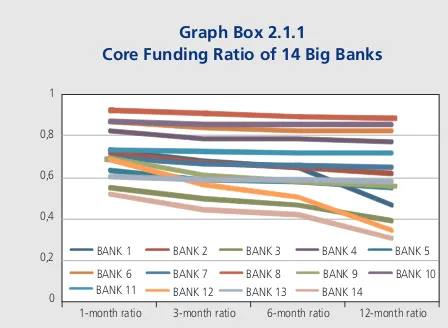
Box 2.1. Bank Liquidity Resilience Indicators 43
Box 2.1. Bancassurance Performance 45
Chapter 3 Financial Infrastructure and Risk
Mitigation 49
Payment System Performance 49
Financial Sector Assessment Program (FSAP) 52
Box 3.1. Implementation of
Payment-versus-Payment (PvP) Link 55
Box 3.2. ATM and Debit Card Fraud 57
Box 3.3. Credit Card Risk Mitigation 58
Chapter 4 Indonesian Financial System Outlook 61
Economic Prospects And Risk Perception 61
Bank Risk Profile : Level And Direction 62
Potential Vulnerabilities 64
Articles
Article 1 Market Competition, Interest Margin and
Indonesian Financial System Stability 67
Article 2 The impact of Monetary Shocks on
iv
List of Tables and Graphs
Tables
1.1 World Economic Indicators 11
1.2 The Effect of Rupiah Depreciation on Corporate
Equity 18
2.1 Bank Profitability 31
2.2 Integrated Stress Test Scenarios 33
2.3 Financial Ratios of Finance Companies 35
2.4 NPL Finance Companies 36
2.5 NPL of Finance Companies 36
2.6 Indices of Regional Markets 39
2.7 Sectoral Indices 40
2.8 VaR by SUN Tenure 41
2.9 SUN Ownership 41
4.1 Economic Indicator Projections 62
1.1 Consumer Confidence in G3 Countries 9
1.2 Purchasing Manager Index (PMI) and Industrial
Production (IP) Index in G3 Countries 10
1.3 Capital Inflows to Asian Market 10
1.4 Global Economic Growth 10
1.5 Total Layoffs U.S. Non-Agricultural Sector 10
1.6 GDP Growth in various Emerging
Market Economies 11
1.7 Household Consumption Ratio against
Domestic (output) Income (%) 11
1.8 Price Index of several Commodities 12
1.9 Non-oil/gas Export Value in Indonesia 12
1.10 Import/Export Growth 12
1.11 IDR/USD Exchange Rate 12
1.12 Estimation Results IDR/USD 13
1.13 Global Exchange Rates 13
1.14 Global Share Price Index 13
1.15 Share Price Indices by Sector 13
1.16 Inflation in ASEAN-5 Countries 14
1.17 Real Interest Rate in Indonesia 14
1.18 Production Index and Production Capacity
Utilization Industrial Sector 15
1.19 Growth of Industrial Sector Export Value
and Industrial GDP 15
1.20 Growth of Automobile and Motorcycle Sales
and Industrial GDP 15
1.21 Manufacturing Sector Credit and GDP 15
1.22 Leading Indicators for the
Trade, Hotels and Restaurants Sector 16
1.23 Composite Prompt Indicator
for the Trade, Hotels and Restaurants Sector 16
1.24 Retail Sales Index 16
1.25 Domestic Consumer Confidence Index 16
1.26 ROA and ROE of Public Listed Non-Financial
Companies 16
1.27 Key Indicators of Corporate Finance 17
1.28 DER and Debt/TA of Public Listed Non-Financial
Companies 17
1.29 Probability of Default (PD) of Public Listed
Non-Financial Companies (a) 17
1.29 Probability of Default (PD) of Public Listed
Non-Financial Companies (b) 17
1.30 Ratio of Net Foreign Exchange Liabilities
against Corporate Equity 18
v
2.1 Asset Composition of Financial Institutions 21
2.2 Financial Stability Index 22
2.3 Sources of Funds - Banks 22
2.4 Deposits by Component 23
2.5 Foreign Exchange Deposits IDR/USD
Exchange Rate 23
2.6 Bank Liquid Assets 24
2.7 Liquid Assets by Bank Group 24
2.8 Liquid Assets Ratio 25
2.9 Transaction Volume O/N Interbank
Money Market (daily average) 25
2.10 Interbank Money Market Interest Rate 25
2.11 Interbank Money Market Interest Rate 25
2.12 Growth of Credit and Deposits 26
2.13 Credit Growth by Type 26
2.14 Credit Growth by Economic Sector 26
2.15 Credit Growth by Currency 26
2.16 MSM and non-MSM Credit Growth 27
2.17 Non-performing Loans 27
2.18 NPL Ratio by Sector 27
2.19 NPL Ratio of the Manufacturing Sector 28
2.20 NPL Ratio of Trade Sector 28
2.21 NPL Ratio of Trade Subsectors 28
2.22 NPL Ratio by Usage Type 28
2.23 NPL Ratio for Consumption Credit 29
2.24 Credit Risk Stress Test 29
2.25 Rupiah Maturity Profile 29
2.26 Forex Maturity Profile 29
2.27 Interest Rate Risk Stress Test 30
2.28 Net Open Position (overall) 30
2.29 Exchange Rate Risk Stress Test 30
2.30 SUN Share 31
2.31 Stress Test - SUN Price Decline 31
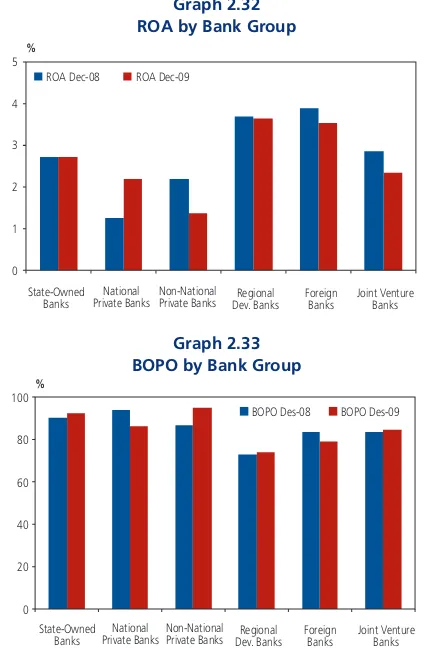
2.32 ROA by Bank Group 31
2.33 BOPO by Bank Group 31
2.34 Monthly Profit/Loss 32
2.35 Interest 32
2.36 Capital, Risk-Weighted Assets and CAR 32
2.37 CAR by Bank Group 32
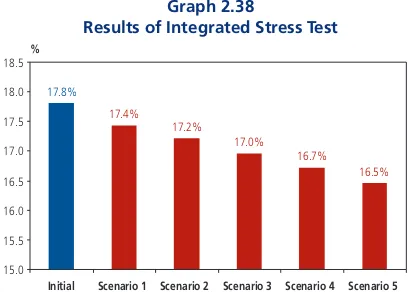
2.38 Results of Integrated Stress Test 33
2.39 Interbank Stress Tests 34
2.40 Business Activity of Finance Companies 34
2.41 Composition of Financing for Financing
Companies 35
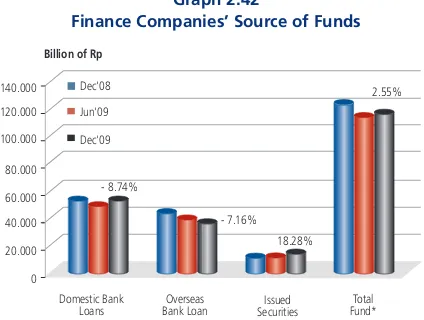
2.42 Finance Companies» Source of Funds 35
2.43 Penetration of General Insurance in several
Asian Countries 37
2.44 Penetration of Life Insurance in several
Asian Countries 37
2.45 Insurance Industry Performance
Assets-Gross Premiums-Investment 37
2.46 Insurance Industry Performance
Claims-Premiums 37
2.47 Performance of Life Insurance 37
2.48 Investment Performance by Business Type 38
2.49 Performance of Loss Insurance
and Re-assurance 38
2.50 Foreign Investment in SBI, SUN, Stock 38
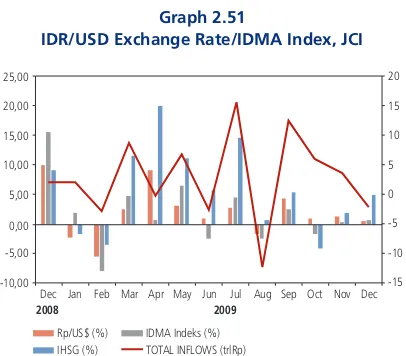
2.51 IDR/USD Exchange Rate/IDMA Index, JCI 39
2.52 JCI and Global and Regional Indices 39
2.53 Volatility of Several Asian Stock Indices 39
2.54 Bank Share Prices 40
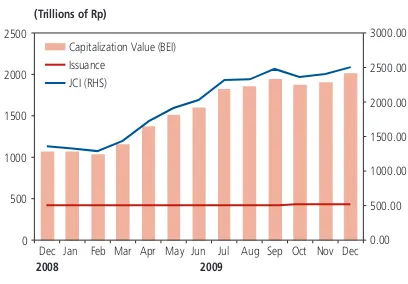
2.55 Stock Market Capitalization and Issuance Value 40
2.56 Benchmark FR Series SUN Price 41
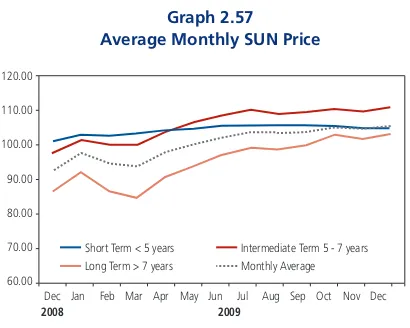
2.57 Average Monthly SUN Price 41
2.58 SUN VaR 41
2.59 SUN Maturity Profile 42
2.60 Issuance and Corporate Bonds Value 42
2.61 Growth of Mutual Funds 42
2.62 Net Asset Value by type of Mutual Fund 42
3.1 Nominal Transaction Value 49
3.2 Transaction Volume 50
3.3 BI-RTGS System Transaction in 2009 50
3.4 SKN-BI Transactions in 2009 51
3.5 Debit Card Transaction in 2009 52
3.6 Credit Card Transactions in 2009 52
3.7 E-money Transactions in 2009 52
4.1 Economic Growth Projections 61
4.2 Risk Perception in Indonesia 62
vi
I welcome the publication of Financial Stability Review No. 14 March 2010. The publication of the Review is critical
as it communicates to a large audience developments and prospects of financial system stability.
This issue of the Review comes to us at a time in which the world economy has started to show signs of recovery
even though the global crisis has not completely dissipated. In fact, we have actually recently witnessed the emergence of
new international issues such as the fiscal crisis in Greece. We view that recovery on a global level is very important as the
increasingly integrated global financial system potentially allows shocks from the international economy to immediately
impact Indonesia. It is therefore essential for us to maintain vigilant towards our financial system.
The Indonesian economy and financial sector has fared much better compared to that of on a global level. Such is
the result of various policies taken by the Government and Bank Indonesia in 2008 and 2009 aimed at taming impacts of
the crisis which peaked in November 2008. The successful policies allowed the economy to grow at a relatively high level
while inflation is kept relatively low and exchange rate adequately managed. With this background, the BI rate has been
maintained at a low and stable level of 6.5% since August 2009.
Riding on the back of such a conducive economy, the banking industry continues to showcase good performance.
At the end of December 2009 the Capital Adequacy Ratio was recorded as exceeding 17% with well-controlled earning
asset quality as reflected by gross and net NPLs of 3.3% and 0.3% respectively. With such well-managed asset quality,
banks were able to produce relatively high levels of profit with ROAs at approximately 2.6% while keeping liquidity
well-controlled.
Meanwhile the stock market and non bank financial market performance shows encouraging signs and thus
breed-ing optimism about better conditions in the financial system ahead. Such optimism appears to be appropriately called for
as the sovereign rating and rating of several of Indonesia»s big banks are increasing and nearing investment grade.
Such developments are encouraging, however, they should not distract us from the challenges which potentially
can become sources of instability. One of the challenges faced is the low credit growth level which in 2009 only reached
10% (year-on-year). The slow credit growth deserves our serious attention. If the credit slump continuous, the growth of
the economy as a whole will be at stake. Such credit slump also potentially impedes financing of the corporate and
vii
Another important challenge we must face is the increase in short term capital inflows. Such inflows potentiallyincrease as the economy improves and will put the financial system to be more vulnerable to sudden reversals. As such, it
is very important to maintain investors» trust by continuously promoting effective market discipline supported by
improve-ments in financial sector governance. The Financial Sector Assessment Program (FSAP) which was conducted from the
end of 2009 to early 2010 is expected to become an important reference for efforts in improving the financial sectorƒ
with the banking industry as no exception.
By knowing the opportunities and challenges faced by the financial sector as mentioned above, the financial sector
is expected to continue its advancement and be spared from excess risks. As such, improvements in surveillance must
continue. This can be achieved by, among others, renewing and perfecting the tools and methodologies used for early
detection. In closing, it is my hope that the Review is able to serve its mission to communicate to the public surveillance
results of financial system stability developments and its prospects ahead.
Jakarta, 31 March 2010
Deputy Governor of Bank Indonesia
viii
Overview
Overview
Overview
Overview
1. SOURCES OF INSTABILITY
1.1. Slow Global Recovery
The global economic crisis has not completely
subsided. While the crisis persists a number of new
problems have emerged triggering a subsequent rise in
global instability, for example the Dubai World financial
crisis and the fiscal crisis in Greece.
Therefore, tight vigilance is required to avoid a
domino effect creating vulnerabilities in the domestic
financial sector and economy.
1.2. Sluggish Credit Growth
Post-global crisis, bank credit growth experienced
a significant slowdown, in particular foreign exchange
(forex) credit. In 2009, total credit grew by just 10%
(y-o-y). This issue requires serious attention as languid credit
disbursements has the potential to spur instability. On a
macro scale, the decline in credit growth places additional
pressures on future economic growth. From a micro
perspective,∆the decline in credit growth causes
difficulties
Overview
for the corporate sector and households in terms of
obtaining funds to finance their business activities. This,
in turn, potentially undermines the debt repayment
capacity of the corporate and household sectors, which in
general are bank debtors. From a macro and micro
standpoint, both have the potential to raise
non-performing bank loans (NPL).
1.3. The Rise in Short-Term Capital Inflows
Short-term capital inflows are resurging back into
Indonesia. This is not only due to the attractive returns
offered by financial instruments in Indonesia, but also due
to the improved sovereign rating as a result of robust
domestic economic performance amid pressures stemming
from the global crisis. The rise in short-term capital inflows
requires close vigilance as it is vulnerable to sudden reversals
which could disrupt financial stability.
1.4. Possibility of Greater Operational Risk
Operational risk can arise due to, among others,
natural disasters and fraud. The recent trend of more
frequent natural disasters, like earthquakes and floods,
that have beset Indonesia has necessitated a contingency
plan that can maintain the functioning of financial
infrastructure under any conditions so as to minimize
potential losses. In addition, greater financial system
dependence on information technology, for example
through the pervasive use of ATM cards and Internet
banking, has dictated the immediate requirement for
all-encompassing security measures and risk mitigation against
fraud.
1.5. The Real Sector and Infrastructure
Real sector conditions remained suboptimal despite
corporate and household performance surpassing that
reported during the peak of the global crisis in quarter IV
2008. Nevertheless, a number of new challenges continue
to emerge, including the inauguration of the ASEAN China
Free Trade Area (ACFTA) at the beginning of 2010.
Furthermore, infrastructure in the country remains
unsatisfactory reflected by, among others, disruptions in
the distribution network that precipitated inefficiencies and
created a high-cost economy. If the problems confronting
the real sector are permitted to persist and no resolution
is sought, financial sector instability will materialize in the
long term.
1.6. Inadequate Legal Protection
Financial sector instability will appear if policymakers
do not receive adequate legal protection. Without clear
legal protection, public officials in the financial sector will
be unwilling to take the immediate decisions necessary to
avoid the widespread impacts of a crisis. This issue requires
the attention of all related stakeholders to ensure that
financial system stability remains under control.
2. RISK MITIGATION
2.1. Strengthening Capital
The most important risk mitigation measure is to
increase capital. The Indonesian banking industry uses
capital strengthening as one method to mitigate risk. As
such commercial banks in Indonesia-are required to
maintain a minimum core capital of Rp100 billion by the
end of 2010. Previously, in 2008, commercial banks were
required to maintain a minimum core capital of Rp80
billion, for which all banks complied. Despite the fact that
in December 2009 several banks had core capital levels of
less than Rp100 billion, experience garnered from the
previous requirement of Rp80 billion indicates that all
Overview
2.2. Increasing Loan Loss Provisions
Loan loss provisions are an effective method of
mitigating credit risk. In 2009, banks increased their
provisions by Rp12.7 trillion. Therefore, despite a rise in
the gross NPL ratio of the banking industry from 3.2%
(December 2008) to 3.3% (December 2009), the net NPL
ratio actually declined from 0.8% to just 0.3%.
Although loan loss provisions are an effective method
of mitigating credit risk, it is important that the amount of
provisions is not excessive or insufficient. Excessive
provisions erode potential bank revenues and insufficient
provisions undermine their effectiveness as an instrument
to mitigate risk.
2.3. Risk Management and Good Governance
Strengthening risk management and good
governance in the financial sector is another method to
mitigate risk. To this end, the risk management certification
program was continued for banks. Bank supervisors are
also obliged to participate in a certification program for
supervisors and apply Risk Based Supervision when in
supervising banks. Additionally, banks are encouraged to
improve the quality of their governance, not only to meet
Bank Indonesia»s regulations but also to nurture market
discipline.
For risk mitigation to be effective from a risk
management and good governance standpoint, banks
should obviously not merely orient themselves towards
acquiring certificates and fulfilling formal aspects;
practicing these disciplines in their business operations on
a daily basis is far more important.
2.4. Surveillance
Risk mitigation is also achieved through the relevant
authorities by strengthening micro and macro prudential
aspects. Microprudential surveillance is implemented on
individual banks by emphasizing the fulfillment of
prudential regulations, through onsite and offsite
supervision. Conversely, macroprudential surveillance
concentrates more on industry-level analysis.
In order to reinforce microprudential surveillance,
supervisors participate in a certification program. In
addition, to strengthen macroprudential surveillance, the
tools and methodologies used in surveillance are
continuously refined, including stress testing, probability
of default analysis, transition matrices, as well as other
early warning mechanisms. One of the techniques used
to refine the tools and methodologies associated with
surveillance is to utilize the assessment results of the
Financial Sector Assessment Program (FSAP) conducted in
September/October 2009 (first mission) and February/
March 2010 (second mission).
3. PROSPECTS FOR FINANCIAL
SYSTEM STABILITY
The prospects for financial system stability looking
forward remain favorable. Despite the ongoing global crisis
and emerging challenges, there are a number of reasons
behind the expectations of a positive outlook. First is that
the global economic recovery is continuing. Furthermore,
domestic economic performance up until now has
remained robust and is expected to improve further in time.
This, in turn, will stimulate banks to actively extend credit,
making a tangible contribution to the economy. In addition,
greater credit disbursements by banks will invigorate the
business community and catalyze business activity, which
will underpin the economy as a whole.
Second, Indonesia»s ratings - the sovereign rating
and the individual ratings of large banks - have improved
and are approaching investment grade. This will attract
more investors and, therefore,-capital inflows into
Overview
short term in nature, the current emphasis on financial
deepening is expected to avail a number of longer-term
financial instruments and minimize the risk of sudden
reversal. Consequently, financial system stability is forecast
to improve in the future.
Third, the banking industry is currently quite prudent
and conservative, concentrating on applying good
governance. Looking ahead, therefore, banks are expected
to become more aware of risk and set out appropriate risk
mitigation measures before taking business decisions.
From 2010 onwards, banks will begin applying
international standards, including the implementation of
Basel II as well as the Indonesian Statement of Financial
Accounting Standard (PSAK) No.50 and 55. In
addition,-follow-up measures extracted from the results of FSAP are
expected to raise the quality of the financial sector and
banks in Indonesia to the benefit of the national economy.
In order to realize these favorable prospects for
financial system stability, support and cooperation is
required from all relevant stakeholders, including creating
conducive conditions legally, politically and in terms of
Chapter 1 Macroeconomic Conditions and the Real Sector
Chapter 1
Chapter 1 Macroeconomic Conditions and the Real Sector
Chapter 1 Macroeconomic Conditions and the Real Sector
1.1. MACROECONOMIC CONDITIONS
Entering semester II of 2009 the global economy
began to display signs of a recovery. This was further
supported by a stabilization process implemented in the
financial market, as well as additional support from
economic stimuli and a low interest rate. Moreover,
consumer confidence was restored and the business sector,
in particular the rapid recovery of domestic demand-based
economies such as in China, further supported the global
economic recovery process. As a result of such
improvements the rate of global economic contraction
began to abate.
Economic conditions in developed countries,
particularly G3-member countries such as the United
States, Japan and European countries using the Euro, also
Macroeconomic stability in Indonesia was well maintained during semester
II of 2009 on the back of strong domestic demand, a stable banking
industry and increasingly optimistic expectations of a global economic
recovery. In addition, an accommodative fiscal and monetary policy stance
buoyed the Indonesian economy in the midst of widespread pressures
stemming from the global crisis. Against this propitious backdrop,
domestic economic growth in Indonesia outpaced that of various other
countries. Looking ahead, the Indonesian economy has the potential to
continue improving in accordance with the growing momentum of the
global economic recovery. Notwithstanding, several risk factors, external
and internal, require continued attention, for example potential hikes in
the global oil price as well as domestic micro-structural challenges, which
include weak industrial sector competitiveness and stagnant infrastructural
development.
Macroeconomic Conditions and
the Real Sector
began to show signs of improvement. The global economic
recovery continued as a result of fiscal stimulus packages
introduced by various governments. In general, public
consumption strengthened, which was reflected by
increasing consumer confidence in G3 countries. From the
Graph 1.1
Consumer Confidence in G3 Countries
Current Condition
Left Scale Future ExpectationRight Scale
Source : Bloomberg (Japan-Economic Watchers Survey, Euro-IFO Survey, US-Univ. Michigan Survey)
Index, ma3m Index, ma3m
0 20 40 60 80 100 120
0 20 40 60 80 100 120
Japan Japan
US US
Euro Euro
JanMarMayJul SepNovJanMarMayJul SepNovJanMarMayJul SepNovJanMarMayJul SepNovJanMarMayJul SepNovJanMarMayJul SepNov
2007 2008 2009 2007 2008 2009
Chapter 1 Macroeconomic Conditions and the Real Sector
production side, it was observed that the Purchasing
Manager Index (PMI) and Industrial Production (IP) index
followed an increasing trend. Nonetheless, the process of
economic recovery in developed countries was still
overshadowed by a number of risk factors such as high
unemployment as well as an income level that remains
sub-optimal.
activity would begin to intensify. Economic growth in
emerging Asian countries has occurred more rapidly than
in other regions and has, therefore, become an engine of
world economic growth.
Economic recovery is inseparable from successful
performance improvements in the financial sector, among
others, characterized by a rebound in asset prices on the
global financial markets and a resurgence of net foreign
capital flows into Asian markets. Consequently, such
improvements would lead to increased optimism of an
economic recovery in the real sector and global economic
Real sector indicators in developed countries, such
as the declining trend in U.S. job layoffs in the
non-agricultural sector, continued to improve indicating that
the economic contraction was beginning to ease.
According to the ADP National Employment Report the
number of layoffs in the U.S. non-agricultural sector from
December 2009 to January 2010 declined from 61,000 to
22,000.
Graph 1.4 Global Economic Growth
Graph 1.5 Total Layoffs U.S. Non-Agricultural Sector Graph 1.2
Purchasing Manager Index (PMI) and Industrial Produc-tion (IP) Index in G3 Countries
Index, 50 =neutral % yoy, ma 3m
Source : Bloomberg
PMI Manuf US
IP US
PMI Manuf JPN
IP JPN
PMI Manuf EU IP EU
25 30 35 40 45 50 55 60 -38 -33 -28 -23 -18 -13 -8 -3 2 7
Jan Jul Jan Jul Jan Jul Jan Jul Jan Jul Jan Jul
2007 2008 2009 2007 2008 2009
Graph 1.3
Capital Inflows to Asian Markets
Juta USD
Source : Bloomberg
-1.3 -0.8 -0.3 0.2 0.7 1.2
Jan Apr Jul Oct Jan Apr Jul Oct
2008 2009
average of 1 week movement average of 4 weeks movement
Source : IMF (WEO Oct-09)
% -6 -4 -2 0 2 4 6 8 10
2006 2007 2008 2009
I II III IV I II III IV I II III IV I II III IV World GDP
Advance GDP Developing Country GDP
2009 Thousands of People
Source : The ADP National Employment Report, January 2010
Total NonFarm Private
(50) -50 100 150 200 250 Service providing Goods producing
Chapter 1 Macroeconomic Conditions and the Real Sector
Expansive economic growth in Indonesia, amid
widespread pressures stemming from the global crisis, was
accomplished due to a favourable economic structure and
sound financial system as well as accommodative fiscal and
monetary policy. The Indonesian economy was principally
underpinned by unrelenting domestic demand, especially
household consumption. During the global economic
contraction, household consumption in Indonesia continued
at a high level, driven by relatively stable purchasing power
and unwavering consumer confidence. Thus, despite the
global economic downturn, strong domestic demand
successfully sustained national economic activity and
ensured a deep correction could be avoided. With improving trends reported for a number of
economic indicators, the global economy in 2009 is
expected to contract by just 0.8% based on the latest
projections by the International Monetary Fund (IMF),
compared to initial projections of more than 1%. In 2010,
the global economy is expected to achieve 3.9% growth1.
In contrast to a number of other countries, the
Indonesian economy in 2009 performed well. Despite an
inevitable decline, economic growth in 2009 achieved
4.5%, establishing Indonesia as one of the few countries
in the world that recorded positive growth.
Graph 1.6
GDP Growth in various Emerging Market Economies
Source : CEIC
%
(11.00) (8.00) (5.00) (2.00) 1.00 4.00 7.00 10.00 13.00
2000 2001 2002 2003 2004 2005 2006 2007 2008 2009
Q2 Q3 Q4 Q1Q2Q3Q4 Q1Q2Q3Q4Q1Q2Q3Q4 Q1Q2Q3Q4Q1Q2Q3Q4 Q1Q2Q3Q4 Q1Q2Q3Q4 Q1Q2Q3Q4Q1Q2Q3
Indonesia Singapore Thailand
South Korea China India Table 1.1
World Economic Indicators
World Output: 3.0 (0.8) 3.9 4.3
Advanced Economies 0.5 (3.2) 2.1 2.4 United States 0.4 (2.5) 2.7 2.4 Emerging & Developing Countries 6.0 2.0 6.0 6.3
Consumer Price:
Advanced Economies 3.4 0.1 1.3 1.5 Emerging & Developing Countries1) 9.2 5.2 5.4 4.4 LIBOR2)
US Dollar Deposit 3.0 1.1 0.7 1.8
Euro Deposit 4.6 1.2 1.3 2.3
Yen Deposit 1.0 0.7 0.6 0.7
Oil Price (USD) - rata-rata3) 36.4 (36.1) 22.6 7.9 Category 2008 2009
(%) (%)(%) (%)(%) Projection
2010 2011
Source : World Economic Outlook - January 2010
1 World Economic Outlook - January 2010
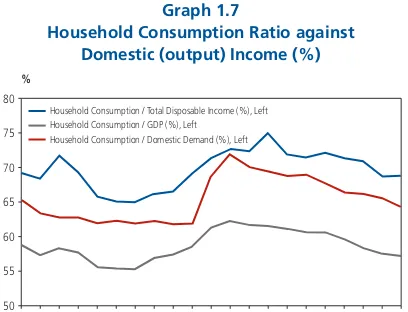
Graph 1.7
Household Consumption Ratio against Domestic (output) Income (%)
The favourable characteristics of the Indonesian
financial system, namely a relatively conservative and simple
banking industry utilizing instruments that are considered
traditional, protected domestic banks and the financial
system from the negative impacts of the global financial
crisis. Furthermore, the accommodative fiscal and monetary
policy stance also reinforced domestic economic resilience.
The application of a free-floating exchange rate system, a
more flexible implementation of an Inflation Targeting
Framework (ITF) monetary policy and a consistent fiscal
policy ensured that the array of policies instituted were
optimal in response to the pressures emanating from the
global economic turmoil. %
50 55 60 65 70 75 80
Household Consumption / Total Disposable Income (%), Left Household Consumption / GDP (%), Left
Household Consumption / Domestic Demand (%), Left
Chapter 1 Macroeconomic Conditions and the Real Sector
Increased economic activity, particularly in emerging
Asian markets that enjoyed a more expeditious recovery
process, strengthened demand for exported goods,
particularly natural resources. This precipitated a rise in
commodity prices on international markets; however, prices
remained lower than that of the previous year. The global
oil price, which had plummeted to US$41.7 per barrel in
January 2009, began to rebound in semester II 2009; rising
to US$79.4 per barrel by December 2009. This hastened
an increase in other commodity prices such as aluminium,
copper, tin, rice and coffee.
Conversely, imports witnessed a significant decline
consistent with weak demand for imported raw materials
from export-oriented industries and a decline in imports
of consumer goods.
Graph 1.8
Price Index of several Commodities
Source : BI 0 100 200 300 400 500 600 0 50 100 150 200 250 300 350 400 450 500
2000 2001 2002 2003 2004 2005 2006 2007 2008 2009
Oil Copper
Tin Gold
Palm Oil Coffee Rice Aluminium
Strong demand and rising commodity prices boosted
export performance. Despite recording negative annual
growth, monthly non-oil exports began to experience
positive growth of 6.0% (Y-o-Y) in quarter IV 2009.
Graph 1.9
Non-oil/gas Export Value in Indonesia
USD Million USD Million Source: BI 0 2000 4000 6000 8000 10000
2006 2007 2008 2009
0 2000 4000 6000 8000 10000 Manufacturing
Mining and Quarrying Agriculture, Hunting, Fishing Total
The Indonesian external sector in general performed
better than previously predicted. In 2009, Indonesia»s
balance of payments»ran a surplus of USD12.5 billion.
Foreign exchange reserves totalled US$66.1 billion;
equivalent to 6.5 months of import payments and servicing
government foreign debt. Consequently, the rupiah
exchange rate strengthened and experienced less volatility.
Compared to the end of semester I 2009, the rupiah
gained about 8% on the US dollar reaching Rp9,404/US$
by the end of the year. The rupiah was strongest during
quarter IV; averaging Rp9,467/$. Meanwhile, rupiah
Graph 1.10 Import/Export Growth % (60) (40) (20) -20 40 60 80 Export Import
2007 2008 2009
Jan Mar May Jul Sep Nov Jan Mar May Jul Sep Nov Jan Mar May Jul Sep Nov
Graph 1.11 IDR/USD Exchange Rate
Source : Bloomberg
0 2,000 4,000 6,000 8,000 10,000 12,000 14,000
2007 2008 2009
0 2000 4000 6000 8000 10000 12000 14000
Chapter 1 Macroeconomic Conditions and the Real Sector
exchange rate volatility against the U.S. dollar during
semester II 2009 averaged 0.36%; lower than average
volatility during the previous semester at 0.65%.
Accordingly, the Indonesian rupiah appreciated strongly
compared to other Asian and major world currencies
during semester II with the exception of the South Korean
won.
2009 reached 2,534.36; surpassing that of the previous
semester totalling 2,026.78. Superior domestic stock
market performance was in harmony with the enhanced
performance of regional stock markets and markets in
developed countries. By sector, the strongest share price
index gain occurred in the basic industry sector; increasing
by 41.9% from 192.9 in late June 2009 to 273.93 in
December 2009.
Graph 1.12 Estimation Results IDR/USD
Volatility -4 -3 -2 -1 0 1 2 3 4
Period (263 days)
1 31 61 91 121 151 181 211 241 Lower Limit
Upper Limit Actual
Graph 1.13 Global Exchange Rates
2009 Index
30 June 2009 = 100
Increase of Index = Exchange Rate Appreciation 85 90 95 100 105 110 115
Jun Jul Aug Sep Oct Nov Dec IDR SGD THB PHP
KRW EUR JPY
In the financial sector, optimism surrounding a global
economic recovery as well as sound domestic economic
conditions, in turn, attracted foreign capital flows into
Indonesian markets. Therefore, domestic financial market
performance improved; characterized by an improvement
in stock market performance and rupiah appreciation. The
Jakarta Composite Index (JCI) at the end of semester II
Graph 1.14 Global Share Price Index
0 5000 10000 15000 20000 25000 30000 35000
2006 2007 2008 2009
Singapore NYA New York Indonesia Nikkei Source: Bloomberg 0 5000 10000 15000 20000 25000 30000 35000 Graph 1.15
Share Price Indices by Sector
Source : Bloomberg 0 500 1000 1500 2000 2500 3000 3500 4000
2006 2007 2008 2009
0 500 1000 1500 2000 2500 3000 3500 4000 Basic Industry Financial Infrastructure Manufacture Mining Property Consumer
The trend of exchange rate appreciation reinforced
by the full panoply of measures taken by the Government
during the crisis to maintain the supply and distribution of
food commodities helped maintain volatile food inflation
at a level below its historical average. This consequently
alleviated inflationary pressures. Headline inflation, measured
Chapter 1 Macroeconomic Conditions and the Real Sector
December 2009, compared to 3.65% (y-o-y) in June 2009.
Nevertheless, when contrasted against other ASEAN
countries, inflation in Indonesia is still considered high
particularly when compared to Malaysia and Singapore.
Notwithstanding, the investment climate in Indonesia
remained attractive because the interest rate exceeded
inflation despite a gradual decline in Bank Indonesia»s policy
rate since late 2008. The real interest rate in Indonesia
surpassed several other ASEAN countries as well as the
United States.
are replete with challenges, including potential hikes in
the global oil price as well as weak industrial sector
competitiveness amid increasing competition stemming
from the inauguration of ACFTA (ASEAN-China Free Trade
Area). In addition, despite slight improvements, high
unemployment in the U.S. and Europe is a risk factor that
continues to overshadow the global economic recovery
process and inevitably impacting prospects for the domestic
economy.
2. 2. REAL SECTOR CONDITIONS
Along with gradual improvements in global economic
conditions as well as strong domestic demand, the real
sector began to display positive signs of progress,
particularly in the beginning of semester II 2009. Strong
external demand drove growth in tradeables sectors,
namely manufacturing (food, beverages and tobacco
subsector, textile subsector, chemical subsector and
transport subsector, machinery and equipment), agriculture
(plantation subsector), and mining sector (non-oil/gas
mining subsector). Furthermore, growth in non-tradeables,
namely the trade sector, transport and communications
as well as construction, was driven on the strength of stable
domestic demand.
During quarter IV 2009, the manufacturing sector
as well as trade, hotels and restaurants showed a significant
improvement in performance. The manufacturing sector
expanded (y-o-y) from 1.3% in quarter III to 4.2% by
quarter IV. Meanwhile, trade, hotels and restaurants grew
by 4.17% (y-o-y) in quarter IV, after contracting by 0.23%
(y-o-y) in quarter III.
Robust manufacturing sector performance was
reflected by increases in related indices as well as greater
utilization of production capacity, and further supported
by demand side indicators, including industry sector exports
and sales of automobiles and motorcycles.
Graph 1.16
Inflation in ASEAN-5 Countries
Graph 1.17
Real Interest Rate in Indonesia
y-o-y %
Source : CEIC (5)
0 5 10 15
Jan Jun Nov Apr Sep Feb Jul Dec
2007 2008 2009
Philippines Singapore Thailand Malaysia Indonesia
%
Sources : Bloomberg and CEIC
-8.00 -6.00 -4.00 -2.00 0.00 2.00 4.00
2004 2005 2006 2007 2008 2009
Indonesia U S Singapore
Looking forward, the Indonesian economy is
expected to continue expanding despite a variety of risk
factors and potential uncertainty, internally and externally,
that should not be overlooked. Efforts to strengthen
Chapter 1 Macroeconomic Conditions and the Real Sector
In terms of financing, from the beginning of 2009
until the end of quarter III, bank loans to the industrial
sector slowed. Nonetheless, in quarter IV bank financing
to the industrial sector began to recover slightly, despite
not attaining overall average growth for 2009.
Graph 1.18
Production Index and Production Capacity Utilization Industrial Sector Index (%) 95 100 105 110 115 120
2007 2008 2009
1 2 3 4 1 2 3 4 1 2 3 4 60 70 80 90 Utilization of Production Capacity (rhs)
Production Index
Graph 1.19
Growth of Industrial Sector Export Value and Industrial GDP
(%,yoy) (%,yoy) 0,0 1,0 2,0 3,0 4,0 5,0 6,0
1 2 3 4 1 2 3 4 1 2 3 4
2007 2008 2009
-40 -20 0 20 40 60 80 GDP of Industry
Export Value of Industrial Sector (rhs)
Graph 1.20
Growth of Automobile and Motorcycle Sales and Industrial GDP
(%, yoy) (%, yoy)
0,0 1,0 2,0 3,0 4,0 5,0 6,0 2008 2009
1 2 3 4 5 6 7 8 9 10 11 12 1 2 3 4 5 6 7 8 9 10 11 12 -80 -40 0 40 80 120 GDP of Industry
Car Sales (rhs) Motorcycle Sales (rhs)
Government policy to encourage real sector
development, in this case the industrial sector, yielded a
number of positive results, particularly in terms of
improving industrial sector resilience against the impacts
of the global economic crisis. Government policy included
programs to utilize domestic products in the procurement
of government goods and services, programs to restructure
the textile and footwear industry (machinery/equipment),
as well as restrictions on food imports, footwear, clothing,
toys and electronic goods. Pro real sector policies taken to
stimulate industrial sector growth were introduced through
the provision of fiscal stimuli in the form of Government
Borne Import Duty (BMDTP). The industrial sector
successfully absorbed 29.4% of the fiscal stimuli introduced
by the government.
Improved performance in the trade, hotels and
restaurants sector was primarily driven by improvements
in the large trade subsector due to increasing imports and
exports; supported by greater purchasing power. Leading
indicators pointed towards entering an expansionary phase
in the following quarter. The Composite Prompt Indicator
for the trade sector also improved up until mid-quarter IV
2009.
Graph 1.21
Manufacturing Sector Credit and GDP
(%, y-o-y) (%, y-o-y)
0 1 2 3 4 5 6 7
2007 2008 2009 2010
GDP of Industry Manufacturing Credit (rhs) Average Manufacturing Credit (rhs)
Chapter 1 Macroeconomic Conditions and the Real Sector
Stronger public purchasing power stimulated public
consumption for both durable and consumable goods.
Indications of improved trade performance were also
reflected by the Retail Sales Index, which increased up to
the end of quarter IV 2009.
In line with the nascent global economic recovery,
domestic consumption continued at a high level during
semester II 2009 driven by a relatively stable public
purchasing power and robust consumer confidence.
Graph 1.26 ROA and ROE of
Public Listed Non-Financial Companies
Q1 Q2 Q3 Q4 Q1 Q2 Q3 Q4 Q1 Q2 Q3 Q4 Q1 Q2 Q3 Q4 Q1 Q2 Q3 Q4 Q1 Q2 Q3 Q4 Q1 Q2 Q3 -300 -200 -100 0 100 200 300 400 500 600 700
2003 2004 2005 2006 2007 2008 2009
-200 -100 0 100 200 300 400 ROA (left) ROE (right) Graph 1.24
Retail Sales Index
(%, yoy) (%, yoy)
-2 0 2 4 6 8 10
2008 2009 2009
1 2 3 4 5 6 7 8 9 10 11 12 1 2 3 4 5 6 7 8 9 10 11 12 1 2 3 -20 -10 0 10 20 30 40 GDP of Trading
gSPE_BI (cma, rhs) Graph 1.22 Leading Indicators for the Trade, Hotels and Restaurants Sector
Graph 1.23
Composite Prompt Indicator for the Trade, Hotels and Restaurants Sector
Composite Indicators :
CPI, Hotel Occupancy Jakarta, IPI Machinery Equipments, IPI Paper Products, IPI Rubber Plastic Products,
Exchange Rate, Visitors Arrival at 13 Main Gates
avg. of contraction fase :15.2 month avg. of expansion fase :19.2 month
98 99 99 100 100 101 101 102
2002 2003 2004 2005 2006 2007 2008 2009 2010
I II III IV I II III IV I II III IV I II III IV I II III IV I II III IV I II III IV I II III IV I Trade GDP
CLI
(%, yoy) Index
r = 0.961
-2 0 2 4 6 8 10
2008 2009 2009
1 2 3 4 5 6 7 8 9 10 11 12 1 2 3 4 5 6 7 8 9 10 11 12 1 2 3 -2,0 -1,5 -1,0 -0,5 0,0 0,5 1,0 1,5 GDP of Trading
Composite Prompt of Trading (rhs)
Strong exports and household consumption, in turn,
boosted corporate sector performance, which was
evidenced by the improving financial position of
non-financial companies listed on the Indonesia Stock Exchange
(BEI) that had previously suffered intense pressures during
the first half of 2009. Increases in the Return on Assets
(ROA) and Return on Equity (ROE) were indications of
improved corporate performance compared to the same
period of the previous year.
Graph 1.25
Domestic Consumer Confidence Index
Indeks 140,0 130,0 120,0 110,0 100,0 90,0 80,0 70,0 60,0
Current Economic Condition Index Consumer Expectation Index Consumer Confidence Index
1 2 3 4 5 6 7 8 9 10 11 12 1 2 3 4 5 6 7 8 9 10 11 12 1 12
2008 2009 2010
2007
Chapter 1 Macroeconomic Conditions and the Real Sector
Credit risk in the corporate sector is expected to
intensify in the future, especially for export-oriented
companies due to ACFTA (ASEAN China Free Trade Area).
The potential for increased credit risk is reflected by the
rising trend in the Probability of Default (PD) of public listed
non-financial companies. Estimation results show that the
number of companies with a PD greater than 0.5 will
increase from 24 companies in September 2009 to 27
companies in September 2010.
Graph 1.27
Key Indicators of Corporate Finance
Current Ratio
ROA
ROE
Inventory Turn Over Ratio Collection Period
DER
0 1 2 3 4 5
2008:Q3 2009:Q3 The recovery in Indonesia»s corporate conditions was
evident from the current ratio (liquid assets divided by liquid
liabilities) and inventory turnover ratio (inventory divided
by total sales). During the reporting period, the current
ratio increased while the inventory turnover ratio declined.
The rise in the current ratio reflects an improvement in
corporate liquidity conditions, while the decline in inventory
turnover indicates that the corporate sector was able to
manage its inventory more efficiently. However, the
collection period did not alter significantly.
In terms of financing, there were indications that the
corporate sector continued to rely more on internal capital,
reducing their borrowings, either from banks or through
the issuance of bonds and other securities. This was shown
by the decline in debt-to-equity ratio (DER) and the ratio
of total debt to total assets (Debt/TA).
Graph 1.28 DER and Debt/TA of Public Listed Non-Financial Companies
Q1 Q2 Q3 Q4 Q1 Q2 Q3 Q4 Q1 Q2 Q3 Q4 Q1 Q2 Q3 Q4 Q1 Q2 Q3 Q4 Q1 Q2 Q3 Q4 Q1 Q2 Q3 0.00
0.20 0.40 0.60 0.80 1.00 1.20 1.40 1.60 1.80
2003 2004 2005 2006 2007 2008 2009
DER Debt/TA
Probability of Default Total
0 50 100 150 200 250
0.0-0.1 0.1-0.2 0.2-0.3 0.3-0.4 0.4-0.5 0.5-0.6 0.6-0.7 0.7-0.8 0.8-0.9 0.9-1.0 201
5 4 4 0 0 1 0 0
23 Graph 1.29
Probability of Default (PD) of Public Listed Non-Financial Companies (a)
Graph 1.29
Probability of Default (PD) of Public Listed Non-Financial Companies (b)
Probability of Default Total
0 50 100 150 200 250
0.0-0.1 0.1-0.2 0.2-0.3 0.3-0.4 0.4-0.5 0.5-0.6 0.6-0.7 0.7-0.8 0.8-0.9 0.9-1.0 193
11 1 4
2 1 1 0 1
24
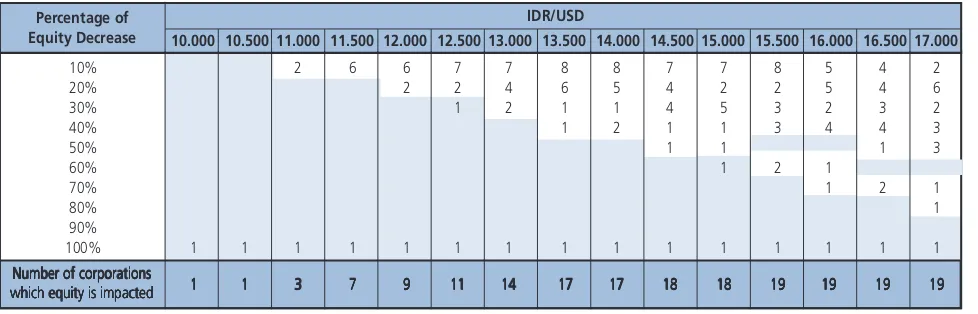
In addition to credit risk, companies in the real sector
could also face exchange rate risk, partly due to
approximately 16 large conglomerates that have a ratio
of foreign exchange net liabilities against capital of more
Chapter 1 Macroeconomic Conditions and the Real Sector
Percentage of Equity Decrease
IDR/USD
10.000 10.500 11.000 11.500 12.000 12.500 13.000 13.500 14.000 14.500 15.000 15.500 16.000 16.500 17.000
Table 1.2
The effect of Rupiah Depreciation on Corporate Equity
10% 2 6 6 7 7 8 8 7 7 8 5 4 2
20% 2 2 4 6 5 4 2 2 5 4 6
30% 1 2 1 1 4 5 3 2 3 2
40% 1 2 1 1 3 4 4 3
50% 1 1 1 3
60% 1 2 1
70% 1 2 1
80% 1
90%
100% 1 1 1 1 1 1 1 1 1 1 1 1 1 1 1
11111 11111 33333 77777 99999 1111111111 1414141414 1717171717 1717171717 1818181818 1818181818 1919191919 1919191919 1919191919 1919191919
of over 100%.In addition, the results of stress tests on 46
large conglomerates in Indonesia as of September 2009
indicate that if the rupiah weakens to Rp17,000/USD, there
Graph 1.30
Ratio of Net Foreign Exchange Liabilities against Corporate Equity
%
(150) (100) (50)
0 50 100 150
R Z AD AK AN AM A AI N F AC AL AO S K M AE AQ I T Q AR W Ratio of Net Forex to
Equity > 25%
is the potential risk that the capital of one conglomerate
would decline by 80%. Therefore, the conglomerate in
question must introduce adequate risk mitigation measures
in order to prevent losses in the event of an exchange rate
shock.
Despite an improvement in real sector performance
during semester II 2009 severe challenges remain, among
others related to financial system stability and economic
resilience. Unstable global financial market conditions could
potentially trigger a sudden foreign capital flow reversal if
the current indicators of economic recovery, especially in
developed countries, weaken again. This would disrupt
domestic financial system stability. In addition, various
micro-structural issues in the real sector remain, such as
weak industrial sector competitiveness and stagnant
infrastructural development, which require close
observation particularly in the face of tighter market
competition following the inauguration of ACFTA.
Chapter 2 The Financial Sector
Chapter 2
Chapter 2 The Financial Sector
Chapter 2 The Financial Sector
The Financial Sector
Chapter 2
2.1. INDONESIAN FINANCIAL SYSTEM
STRUCTURE
There were no significant changes in the structure
of the Indonesian financial system during the reporting
semester. The banking industry, consisting of commercial
banks and rural banks, remained dominant with an 80%
share of total financial sector assets. Meanwhile, the shares
of other financial industry components such as insurance,
pension funds, finance companies, securities and
pawnshops remained relatively low.
In addition, total assets of commercial banks
increased by Rp224.3 trillion (9.7%) to Rp2,534.1 trillion
at the end of December 2009. Due to the merger of two
large banks, 70% of bank assets are no longer owned by
15 large banks (as reported in previous editions of the
Financial Stability Review (FSR)) but are currently owned
by 14 major banks. Meanwhile, the non-bank financial
The financial sector Indonesia expanded during semester II 2009 and
stability was maintained due to conducive domestic economic conditions
as well as clearer signs of a global economic recovery. The banking industry
as the dominant industry in the Indonesian financial sector, continued to
perform positively despite suboptimal implementation of the intermediary
function. Notwithstanding, domestic stock market and Government bond
(SUN) market performance improved, thus raising their attractiveness to
investors, both domestic and foreign.
market also demonstrated favorable growth in semester II
2009, evidenced by a 25.04% rally in the Jakarta
Composite Index (JCI) to 2,534.36, whereas the IDMA price
index of Government bonds (SUN) climbed 4.02% to
94.33.
Graph 2.1
Asset Composition of Financial Institutions
1,1%
8,8%3,1%
4,4% 2,7% 0,4%
79,5%
Commercial Banks
Rural Banks
Insurance Companies
Pension Fund
Finance Companies
Securities Companies
Chapter 2 The Financial Sector
2. 2. FINANCIAL SECTOR RESILIENCE
One indicator used to evaluate financial sector
resilience is the Financial Stability Index or FSI.1 Financial
sector resilience improved during the reporting semester,
as reflected by a decline in FSI from 1.94 (June 2009) to
1.91 (December 2009). Consequently, the FSI projection
of 1.90 by the end of 2009 was successfully achieved.
This improvement in FSI was supported by good quality
bank credit, as well as less volatility on the stock market
and SUN market.
As detailed in previous editions of FSR, the maximum
indicative limit of FSI is 2.00. As a comparison, when the
global crisis befell Indonesia FSI peaked at 2.43 in
November 2008. Meanwhile, at the height of the 1997/
1998 crisis FSI soared to 3.23.
It is worth noting that in June 2009 FSI dropped to
1.94, which was the first time below the 2.00 threshold
since the onset of the global crisis. Previously, in the first
half of 2009 (until May), FSI remained consistently above
2.00. Nevertheless, from June 2009 until February 2010
FSI was below 2.00, declining to just 1.90 in January and
February 2010. Such a downward trend in FSI was clear
evidence of greater financial stability.
With distinct improvements in global and domestic
economic conditions, FSI at the end of semester I (June) of
2010 is projected to lie in the range of 1.59 - 2.16, with a
baseline of 1.87. This projection is based on the premise
that bank credit risk will intensify, however, stock market
and SUN market stability will improve. Increasing stability
in both markets is inseparable from improved expectations
regarding economic fundamentals and the shift in
Indonesia»s sovereign rating towards investment grade.
1 Met hodology and approach to calculate FSI can be found in FSR No. 8 March 2007 and No. 9 September 2007.
2.3. BANKING INDUSTRY
2.3.1. Funding and Liquidity Risk
Deposits
Indonesian banks continued to rely upon third party
funds (deposits) as their primary source of funds up to the
end of semester II 2009. When extrapolated over a longer
timeframe, since 2000 deposits have accounted for
86.04%, on average, of banks» funds. Other sources of
funds, such as securities issued, loans and capital make
up 0.95%, 1.24% and 11.77% respectively. Graph 2.2
Financial Stability Index
Crisis 1997/1998 : 3,23
Global Crisis (Nov 2008) : 2.43 Mini Crisis 2005 : 2,33
0.00 0.50 1.00 1.50 2.00 2.50 3.00 3.50 2.16 1.59
1 5 9 1 5 9 1 5 9 1 5 9 1 5 9 1 5 9 1 5 9 1 5 9 1 5 9 1 5 9 1 5 9 1 5 9 1 5 9 1 5 9 1 5 9
19961997 1998 19992000 2001 20022003200420052006 2007 2008 2009 2010 Des
2009: 1.91
Jun 2010 (p): 1.87
FSI 1996 - 2010
Share of Deposits (%)
Time Deposits Savings Capital Giro Loans Marketable Securities 1.000 900 800 700 600 500 400 300 200 100
-2000 2001 2002 2003 2004 2005 2006 2007 2008 2009 89 88 87 86 85 84 83 82 Graph 2.3 Sources of Funds - Banks
As of December 2009, deposits accrued by banks
totaled Rp1,973.00 trillion, representing an increase of
Rp148.8 trillion (8.2%) compared to that of the previous
semester, easily surpassing that of the semester I at Rp71.0
trillion (4.1%). This is verification that improving economic
Chapter 2 The Financial Sector
All components contributed to the increase in
deposits during the reporting period, namely giro accounts,
saving accounts and time deposits. Of the three
components, saving accounts experienced the greatest
increase (Rp90.5 trillion or 17.6%) followed by time
deposits and giro accounts with Rp39.6 trillion (4.6%) and
Rp18.8 trillion (4.2%) respectively.
2 Primary Reserves include Cash and GiroAccounts held at BI. Meanwhile, Secondary Reserves consist of BI Certificates,other placements atBI (BI Facilities/Contraction Adjustments), and SUN (Trading and Available for Sale). Finally, Tertiary Reserves are SUN (Held to maturity).
Rupiah appreciation in 2009 encouraged the general
public to increase placements at banks in the form of
foreign exchange. It is highly probable that this was
motivated by profit-taking behavior in anticipation of a
subsequent decline in the rupiah exchange rate.
Accordingly, during semester II 2009, foreign denominated
deposits increased by USD5.1 billion, equivalent to Rp24.7
trillion, which affected all components with the largest
increases reported for time deposits and checking accounts.
In terms of time deposits, the increase could be due to
expectations of high returns. Whereas giro accounts, the
most liquid component, are easily withdrawn or switched
as necessary.
Liquidity Adequacy
The significant increase in funding sources, moreover
during the period of languid credit growth, provided
relatively widespread opportunities for banks to increase
placements in liquid assets. During semester II 2009, bank
liquid assets consisting of primary reserves, secondary
reserves and tertiary reserves grew by Rp34.2 trillion
(5.1%)2, surpassing that of the previous semester. In the
first half of 2009, banks increased placements in liquid
assets to the tune of Rp23.1 trillion (3.5%).
Significant growth in liquid assets occurred in
December 2009 in harmony with a sharp rise in deposits
triggered by an adjustment to the Statutory Reserve
Requirement that obliged banks to maintain secondary
reserves of 2.5%. This encouraged banks to stockpile liquid
assets in the form of BI Certificates and SUN. However,
the emerging trend of banks exploiting profit taking
through SUN ownership in mid-semester II 2009
precipitated a decline in SUN ownership by banks of around
9.4%.
Based on type, the increase in bank liquid assets
during semester II 2009 principally stemmed from a rise
in primary reserves amounting to Rp27.3 trillion (21.0%) Graph 2.4
Deposits by Component
Rp T
350 400 450 500 550 600 650 700
Dec Oct Dec Feb Apr Jun Aug Oct Dec
2008 2009
600 700 800 900 1.000 Demand Deposits (lhs)
Savings (lhs) Time Deposits (rhs)
2007
Graph 2.5
Foreign Exchange Deposits IDR/USD Exchange Rate
Rupiah USD Billion
22 26 30 34 38 42
Dec Oct Dec Feb Apr Jun Aug Oct Dec
2007 2008 2009
8.000 9.000 10.000 11.000 12.000 13.000 Foreign Exchange Deposits (lhs)
Chapter 2 The Financial Sector
and secondary reserves, excluding SUN, totaling Rp25.9
trillion (6.4%), more specifically BI Facilities/Contraction
Adjustments. The prevalence of short-term liquid assets
indicated widespread caution by the banks in order to
anticipate their liquidity requirement.
assets at a specific amount to alleviate liquidity risk. The
ratio of liquid assets3 to short-term liabilities, i.e. non-core
deposits (NCD)4, demonstrated adequate liquidity. This ratio
confirms the ability of banks to meet their short-term
liquidity requirement.
The liquid asset ratio improved continuously during
2009 after slumping to its nadir (84.9%) in December 2008
due to the global crisis. The ratio subsequently climbed to
114.6%, exceeding the minimum threshold of 100%, and
surpassing its position at the beginning of 2009.
Liquid asset ownership was dominated by banks with
total assets exceeding Rp15 trillion, accounting for 85.72%
of total bank liquid assets. In general, secondary reserves,
consisting primarily of BI Certificates, remained the most
favored component with a share of more than 50%.
3 Liquid assets included in this ratio include Cash and Placements at BI.
4 NCD is made up of 30% checking account + 30% savings acount + 10% certificate deposits with a tenure of up to 3 months.
Graph 2.6 Bank Liquid Assets
Rp T
0 90 180 270 360 450
500 550 600 650 700 750
Des Mar Jun Sep Des
2008 2009
Primary Reserves Secondary Reserves Tertiary Reserves TOTAL AL (rhs)
Graph 2.7
Liquid Assets by Bank Group
TA <1 T TA 1-5 T TA 5-15 T TA >15 T 0.71% 4.18% 9.39%
85.72%
Liquid assets were principally accrued by banks in
order to anticipate their immediate and short-term liquidity
requirement. Consequently, banks maintained their liquid
Graph 2.8 Liquid Assets Ratio
60 120 180
0 100 200 300 400
Jul '08 Oct'08 Jun '09 Dec'09
Rp T
Liquid Assets NCD Liquid Assets/NCD
%
Dec '07 147.7
119.3
102.5 92.0
84.9 101.4
95.497.6 109.1
109.2 107.8
104.7 114.6
Interbank Money Market
Activity in the interbank money market intensified
on the back of abundant bank liquidity. In general,
transactions on the Interbank Money Market, both in
rupiah and foreign exchange, during semester II 2009
eclipsed those of the same period in 2008 (during the
global crisis) as well as during semester I 2009.
Nevertheless, observation of data shows that the
Interbank Money Market volume during the last quarter
of 2009 decreased. Such is due to high levels of
day-to-day liquidity and thus causing the need to transact in the
Chapter 2 The Financial Sector
transaction volume level continued to the end of the year.
Such was supported by the following factors:
1. The inflow of currency after the Idul Fitri holidays
causing the majority of market players experienced
better evenly distributed excess liquidity
2. The allocation of funds from the Government to fund
projects nearing the yearend
3. Banks anticipate the withdrawal of cash as
anticipation of the Christmas and New Year»s holidays
by maintaining availability of day-to-day liquidity
through BI Facilities (Fasbi) and Contraction
Adjustments (FTK).
No irregular interbank transactions were apparent
during the reporting semester. Average daily transaction
volume on the interbank money market, in rupiah,
increased slightly despite a small decrease in the final quarter
of 2009. Conversely, average daily forex transaction volume
increased steadily but failed to achieve pre-crisis levels.
conditions reflect relatively well-controlled liquidity risk by
the banking industry.
2.3.2. Credit Growth and Risk
Credit Growth
Similar to conditions in the first half of 2009, credit
growth during semester II was not favorable; following an
opposite trend to the relatively buoyant deposit growth.
However, significant credit allocation did emerge in the
final two months of 2009, amounting to around Rp60
trillion. Consequently, credit growth in 2009 only achieved
10%, which falls far below the target stipulated in the
Bank Business Plan of around 15%. Sluggish credit
allocation was due to several factors, mainly stemming
from the impact of the global crisis, and was reflected by
slow working capital credit growth, lackluster credit
extension to the manufacturing industry and the corporate
sector as well as negative forex credit growth. Graph 2.9
Transaction Volume
O/N Interbank Money Market (daily average)
USD Million Rp T
Jan'08 Jun'08 Nov'08 Apr'09 Sept'09
0 4 8 12
0 100 200 300 400 500 Rupiah PUAB Foreign Exchange
The rate of interest for rupiah interbank money
market transactions remained relatively under control with
normal fluctuations. No transactions applied an interest
rate that deviated far from the weighted average during
the reporting semester. Since the middle of 2009 the
weighted average overnight interbank money market
interest rate remained below the BI rate. In general, such
Graph 2.10
Interbank Money Market Interest Rate (P)
Graph 2.11
Interbank Money Market Interest Rate (O) %
Lowest Overnight Interest Rate Highest Overnight Interest Rate Weighted Average Overnight Interest Rate BI Rate
01/05/09 03/11/09 05/18/09 07/24/09 10/01/09 12/04/09
5 6 7 8 9 10
%
01/05/09 03/11/09 05/18/09 07/24/09 10/01/09 12/04/09 5
6 7 8 9 10
Chapter 2 The Financial Sector
Listless economic growth undermined credit
extension to the manufacturing sector in 2009, achieving
just 8.8% compared to 32% in 2008.
In 2009, bank loans primarily funded consumption
with around 54% of the growth in total credit contributed
by consumption credit. The share of working capital credit,
which falls under the category of productive credit, was
only 14%. During 2009, working capital credit expanded
by just 2.7%. In the two years prior (2007 and 2008),
working capital credit achieved growth of 28%. The decline
in working capital credit growth was due to a slowdown
in economic activity as a result of the global crisis.
However, investment credit growth remained
favorable and in 2009 expanded by 16.4% (Rp42 trillion).
As investment credit is mid/long term in nature and is used
for the procurement of capital goods, relatively strong
growth indicates positive economic prospects according
to the banks.
Graph 2.13 Credit Growth by Type
2009 2008 2007 KMK KI KK %
0,0 10,0 20,0 30,0 40,0
28,6% 28,4% 2,7% 23,2% 37,4% 16,4% 24,9% 29,9% 19,0% Graph 2.14
Credit Growth by Economic Sector % -20 0 20 40 60 80 100 Agriculture Mining Manufacturing Electricity Construction Trade Transportation Business Services Social Services Others 2007 2008 2009 16.1% 9.3% 33.1% 17.0% 8.2% 15.2% -1.0% 18.8% 32.9% -8.8% Graph 2.15 Credit Growth by Currency % -30 -20 -10 0 10 20 30 40 50 2007 2008 2009
Rupiah Foreign Exchange Total
24.0% 33.2% 16.5% 36.8% 20.4% -17.4% 26.5%30.5% 10.0% Graph 2.12
Growth of Credit and Deposits (% y-o-y)
% 0 5 10 15 20 25 30 35 40 45
2003 2004 2005 2006 2007 2008 2009
G_Kredit
G_DPK
In 2009, forex denominated credit contracted by
17.4% as a result of declining exports/imports due to
deteriorating economic conditions in several key trade
partners. The close relationship between forex credit and
export/import activities was clearly evidenced by the high
respective correlation coefficient at around 0.92. Even
when forex credit contracted, rupiah denominated credit
grew at a relatively high rate of around 16.5%.
Banks tended to focus on Micro, Small and Medium
(MSM) credit. Consequently, in 2009 MSM credit expanded
by 16.3% compared to just 4% for non-MSM credit or
corporate credit (credit with a nominal value of above Rp5
Chapter 2 The Financial Sector
an economic recovery as well as the relatively successful
credit-restructuring program. Furthermore, banks
maintained relatively large loan loss provisions in order to
mitigate credit risk. In 2009, loan loss provisions increased
by Rp12.7 trillion, thus precipitating a significant decline
in the net NPL ratio from 0.8% at the end of 2008 to
0.3% by yearend 2009. Conversely, the gross NPL ratio
increased slightly from 3.2% to 3.3% for the same period. Rp500 million, dominated MSM credit as a whole. In
addition to fallout from the global crisis, slow corporate
credit growth was also due to widespread alternative
financing options available to large corporations, such as
through the issuance of bonds or shares, which were
cheaper than credit because of soaring lending rates that
exceeded 13%.
Graph 2.16
MSM and non-MSM Credit Growth
%
2007 2008 2009
22,5% 26,1% 16,3% 30,8% 35,0% 4,0% 0 5 10 15 20 25 30 35 40 MSM Non-MSM
In addition to demand-side factors, slow credit
growth was also affected by internal bank policy (supply
factors). Several banks, mostly those affiliated with foreign
banks, chose to consolidate and reorganize internally
through, among others, credit restructuring in order to
anticipate and mitigate the global crisis. This was reflected
by an unusual decline in non-performing loans in the
manufacturing sector, which should have actually increased
as a result of the global crisis.
Credit Risk
Sluggish credit growth was inseparable from
mounting credit risk, as reflected by the upward trend in
non-performing bank loans. In general, this condition was
a result of the global crisis. Banks tended to become more
selective when extending credit as the probability of
non-performing loans increased.
After peaking in July 2009, credit risk gradually began
to ease in semester II in accordance with the prospects of
Graph 2.17 Non-performing Loans
Loan Loss Provision (rhs)
Nominal NPL (rhs)
(%) (Trillion)
NPL Gross
NPL Net (lhs)
-1 2 3 4 5 6 7 8 9
2006