For further information, please contact:
Economic Outlook & Policy Dissemination
Economic Outlook & Policy Dissemination
Economic Outlook & Policy Dissemination
Economic Outlook & Policy Dissemination
Economic Outlook & Policy Dissemination
Bureau of Monetary Policy
Bureau of Monetary Policy
Bureau of Monetary Policy
Bureau of Monetary Policy
Bureau of Monetary Policy
Directorate of Economic Research and Monetary Policy
Directorate of Economic Research and Monetary Policy
Directorate of Economic Research and Monetary Policy
Directorate of Economic Research and Monetary Policy
Directorate of Economic Research and Monetary Policy
Telephone :
+62 61 3818163
+62 21 3818206
Fax.
:
+62 21 3452489
:
BANK INDONESIA
The Monetary Policy Report is published quarterly by Bank Indonesia after the Board of
Governors» Meetings in January, April, July, and October. In addition to fulfilling the
mandate of article 58 of Act Number 23 of 1999 concerning Bank Indonesia, amended
by Act No. 3 of 2004, the report has two main purposes: (i) to function as a tangible
product of a forward-looking working framework in which formulation of monetary
policy is based on economic and inflation forecasts; and (ii) as a medium for the Board of
Governors of Bank Indonesia to present to the public the various policy considerations
underlying its monetary policy decisions.
The Board of Governors
Boediono
Governor
Miranda S. Goeltom
Senior Deputy Governor
Hartadi A. Sarwono
Deputy Governor
Siti Ch. Fadjrijah
Deputy Governor
S. Budi Rochadi
Deputy Governor
Muliaman D. Hadad
Deputy Governor
Ardhayadi Mitroatmodjo
Deputy Governor
Budi Mulya
Deputy Governor
BANK INDONESIA
Monetary Policy Strategy
Basic Principles
• With the ITF, inflation target is the overriding objective and nominal anchor of monetary policy. In this regard, Bank Indonesia will apply a forward-looking strategy to steer present monetary policy towards achievement of the medium-term inflation target.
Inflation
• Application of the ITF does not mean that monetary policy will not take account of economic growth. This policy will retain the fundamental paradigm of monetary policy in striking an optimal balance between inflation and economic growth in both the establishment of the inflation target and in monetary policy response, which will be targeted towards low, stable inflation in the medium and long-term.
The Inflation Target
• The Government, after consultation with Bank Indonesia, has established and announced targets for CPI inflation targets at 8%±1%, 6%±1%, and 5%±1% for 2006, 2007, and 2008 (Based on press release on 17 March 2006 from the Coordinating Ministry for Economic Affairs. These inflation targets are consistent with the process of gradual disinflation towards a medium to long-term inflation target of about 3%, competitive with other nations.
Instruments and Monetary Operations
• The BI Rate is used to convey the monetary policy stance and operational targets. The BI Rate is a one-month interest rate regularly announced by Bank Indonesia for a specific time frame.
• The BI Rate is implemented through open market operations (OMO) using 1-month SBIs. To strengthen the effectiveness of liquidity control on the market, Fine Tune Operations (FTO) will be carried out on a daily basis using SBIs and Government Securities as underlying instruments.
Policymaking Process
• The BI Rate is determined by the Board of Governors in the quarterly Board of Governors» Meeting held each January, April, July, and October. Under certain conditions, if necessary, the BI Rate may be adjusted in the Board of Governors» Meeting convened in other months. Changes in the BI Rate are indicative of Bank Indonesia»s assessment of the inflation forecast in relation to the established inflation target.
Transparency
• From time to time, monetary policy will be communicated through customary media communications, such as statements to the press and market players, the website, and the publication of the Monetary Policy Report (MPR). This transparency is intended to strengthen understanding and build public expectations of the economic outlook and future inflation as well as the monetary policy response pursued by Bank Indonesia.
Coordination with the Government
• To provide coordination in inflation targeting, monitoring, and control, the Government and Bank Indonesia have set up a team made up of officials from various relevant agencies. In the course of its work, the Team deliberates and issues recommendations concerning the necessary policies for both the Government and Bank Indonesia in curbing inflationary pressure to achieve the established inflation target.
Enhanced Monetary Policy Measures
Under Inflation Targeting Framework
Monetary Policy Report - Quarter III-2008
Contents
BANK INDONESIA
Contents
1. General Review ... 1
2. Latest Macroeconomic Indicators ... 5
Economic Growth ... 5
The Balance of Payments ... 11
3. Monetary Indicators and Policy, Q3/2008 ... 14
Inflation ... 14
Rupiah Exchange Rate ... 16
Monetary Policy ... 18
4. Outlook for the Indonesian Economy ... 23
Assumptions and Scenarios ... 24
Economic Growth Outlook ... 25
Inflation Forecast ... 29
Risks ... 30
5. Monetary Policy Response Q3-2008 ... 31
1. General Review
Inflationary pressure in Indonesia remained strong during Q3/2008. Driving this were high public expectations of inflation, buoyant domestic demand and the impact of imported inflation related to the potential for rupiah depreciation brought about by the US financial crisis. In their policy response to these developments, the Bank Indonesia Board of Governors sees the need for curbing of inflationary pressure to achieve the medium-term inflationary target and safeguard the stability of the economy as a whole.
Q3/2008 was dominated by global financial markets woes and the fallout of these problems on the Indonesian economy. The world economic slowdown has now taken hold in several industrialised nations and begun spreading to emerging markets, including Indonesia. The turmoil on global markets has spread inexorably further, with the Indonesian economy also affected. Despite Indonesia»s robust economic fundamentals, the negative sentiment engendered by the crisis prompted a new wave of capital outflows. This has put pressure on both the stock market and the rupiah exchange rate. The stock index plunged dramatically alongside depreciation in the exchange rate. Both developments augur for a pessimistic outlook for the domestic economy. In response, Bank Indonesia and the Government have maintained close policy coordination and continue to monitor developments in the economy on a regular basis.
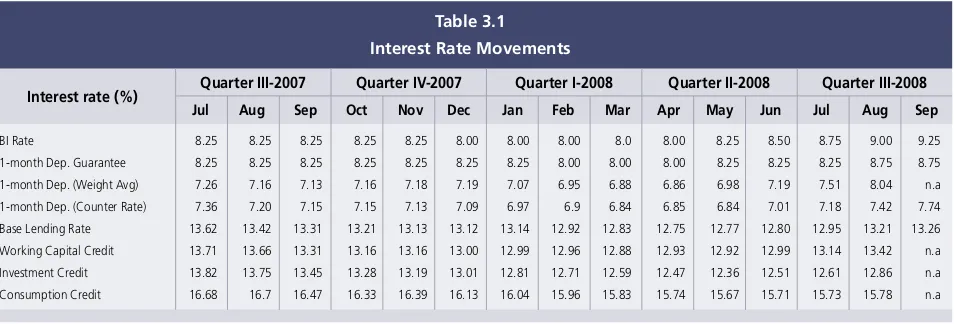
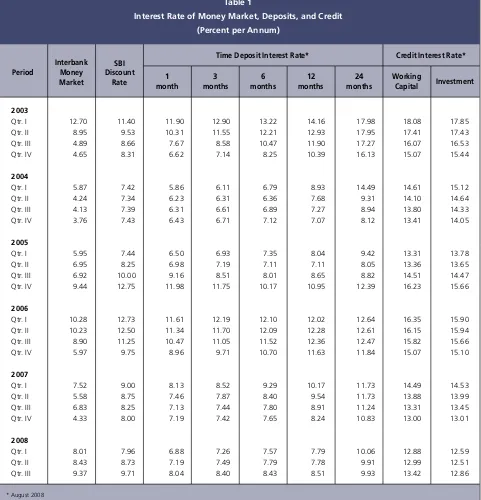
With conditions still shrouded in these problems, inflation and economic stability remain the primary focus of Bank Indonesia. Efforts to strike an overall balance between inflation control and the risk of instability on the money market are ongoing. To curb inflation, Bank Indonesia has pursued a tight bias monetary stance by raising the BI Rate 75 bps during Q3/2008 and optimising the use of all monetary policy instruments at its disposal. The upward movement in the BI Rate was followed by higher rates for bank time deposit and lending rates. As of August 2008, time deposit rates had climbed faster than the BI Rate, with rates for working capital credit and investment credit following suit. Rates for consumption credit, however, were relatively stable.
to this will be the expansionary trend in government accounts during Q4/2008. To resolve the problem of tight liquidity, Bank Indonesia has pursued a series of measures through improvements in monetary operations.
Amid the global financial turmoil of Q3/2008 and slowing world economic growth, the Indonesia economy still managed to chart healthy growth. In preliminary figures, the GDP grew by 6.3% (yoy) in Q3/2008, following 6.4% growth (yoy) in Q2/ 2008. Household consumption was again indicated as the main driving force for this growth. Vigorous growth in consumption was bolstered by continued strength of purchasing power and increased availability of consumer finance. Investment, another component of domestic demand, also recorded high growth, particularly for non-construction activities. Nevertheless, the slowdown in the world economy has also taken the edge off Indonesia»s export growth, although growth remains strong. Alongside this, imports are forecasted to expand rapidly as suggested by the strength of domestic demand and export production needs.
Global economic developments subsequently put pressure on Indonesia»s balance of payments in Q3/2008. Export growth is lagging behind that of imports. Imports maintained a rapid pace of expansion, driven by heavy domestic demand and also price increases. The combination of the economic slowdown in the developed world and falling world commodity prices is set to bear down on Indonesia»s export performance. However, this decline is not expected to be excessive, given that Indonesia»s exports are natural resource-based and therefore less sensitive to an economic slowdown in the developed world. In addition, international trade in the Asia-Pacific region, led by rapid expansion in China and India in recent years, is adequate to keep exports from steeper decline.
Analysis of the composition of imports reveals that import growth has taken place mainly in raw materials and capital goods. This in turn will spur growth in domestic production and production capacity, which will benefit the economy in the medium to long-term. Leading importers were the industry sector (specifically the chemical industry subsector, the base metals, iron and steel subsector and the transportation equipment, machinery and tools subsector) and the transport and communications sector, both of which have substantial backward and forward linkages.
In the capital and portfolio account, negative sentiment spurred by the turbulence on global financial markets prompted a wave of capital outflows. In portfolio investments, foreign capital recorded net outflows. To cover the costs of rising imports, domestic economic actors have drawn on assets placed overseas and some have availed foreign financing, as indicated by the other investment component that recorded net inflows. In the upshot of these developments, international reserves reached USD57.1 billion, equivalent to 4.2 months of imports and servicing of official debt.
exchange rate under the forex market stabilisation policy aimed at mitigating pressures and easing rupiah volatility. As a result, the average value of the rupiah in Q3/2008 appreciated further over the earlier period. Measured as a quarterly average, the rupiah gained 0.47% from Rp 9,259 to the USD to Rp 9,216 to the USD. Downward pressure began to set in near the end of Q3/2008 as foreign investor behaviour came under the influence of global economic developments. Risk aversion among investors led to pressure on the rupiah. Downward pressure was also sustained by regional currencies that weakened from the spillover effects of external turbulence. On the other hand, the rupiah still offered attractive investment yields, reflected in the broad interest rate differential. This in turn eased pressures and helped stem further capital outflows from rupiah instruments.
In related developments, the Indonesian Composite Index (IDX) closed at 1,832 at the end of the period under review (September 2008), a drop of 21.9% compared to end Q2/2008. The disappointing Q3/2008 performance of the IDX Index is explained more by the influence of deteriorating global financial markets as more and more international financial institutions faced bankruptcy.
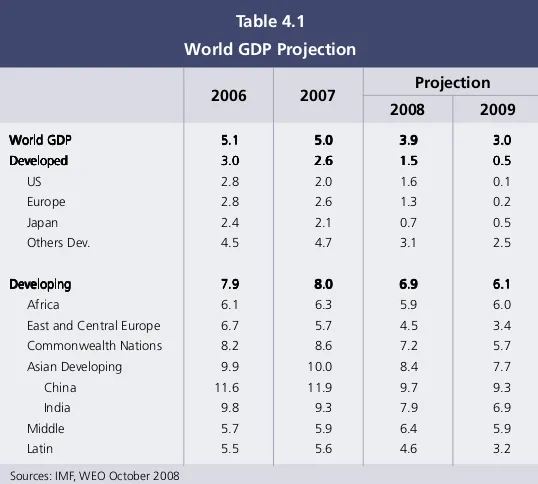
Looking forward, economic growth is predicted to remain at a healthy 6.2%-6.4% amid the turmoil besetting the world economy in 2008 before tapering off slightly in 2009. The continued strength of economic growth is driven primarily by domestic demand. In turn, domestic demand is not only supported by availability of financing, but also the continued strength of public purchasing power. Household consumption is forecasted to maintain momentum. At the same time, investment growth is being fuelled mainly by non-construction investment. Externally, the fast-rising imports of capital goods and raw materials are expected to boost the future capacity of the Indonesian economy. Underlying this optimism are the substantial multiplier effects on the economy in the industry sectors importing these capital goods and raw materials. On the other hand, growth in exports of goods and services is forecasted to decline in keeping with the slowdown in the world economy and falling international commodity prices. Inflationary pressure is also predicted to remain high during the coming months. CPI inflation in 2008 is forecasted in the range of 11.5%-12.5% (yoy). In 2009, inflationary pressure is expected to ease midway through the year in response to the current monetary policy stance and falling imported inflation as international commodity prices maintain a downward trend. Accordingly, inflation in 2009 is forecasted in the range of 6.5%-7.5% (yoy).
Looking forward, the Indonesian economy is also confronted by various risks. These risks are explained largely by developments in the world economy, and most importantly the outworking of the global financial crisis. Economic growth may take a downward bias due to the crisis, which is also likely to affect balance of payments performance given the potential for falling international commodity prices.
2. Latest Macroeconomic Indicators
Amid the uncertainties of global economic developments, the Indonesian economy continued to chart high growth in Q3/2008, albeit down slightly from the preceding quarter. The high rate of growth was bolstered by vigorous domestic demand and especially household consumption. Household consumption maintained reasonably brisk growth, albeit slightly less than in the preceding quarter. Supporting this was relative stability in public purchasing power and an upswing in consumer confidence. However, preliminary figures for exports suggest that growth was held back by weakening economic conditions in key developed nations. Consistent with slowing export performance, figures also point to modest decline in investment growth momentum. However, this slowdown is not expected to have excessive impact, given the continued robust growth in household consumption and improving business optimism for future economic conditions. On the other hand, indicators suggest that import growth was curbed to some extend by the effects of slowing exports and investment.
On the supply side, key sectors driving the economy maintained relatively stable growth in preliminary figures with the exception of agriculture, which shed some growth. Nevertheless, the slowing growth in agriculture was adequately offset by high growth in non-tradable sectors such as transport and telecommunications and services and resumption of positive growth in the mining sector. Based on this assessment, third quarter growth in the Gross Domestic Product (GDP) reached an estimated 6.3% (yoy).
ECONOMIC GROWTH
Indonesia charted another quarter of strong growth in preliminary figures for Q3/ 2008, consistent with the high growth outcome for the preceding quarter. Despite this, various indicators point to slowing growth, even though significant downturn is not suggested. Accordingly, GDP growth in Q3/2008 is estimated at 6.3% (yoy) (Graph 2.1).
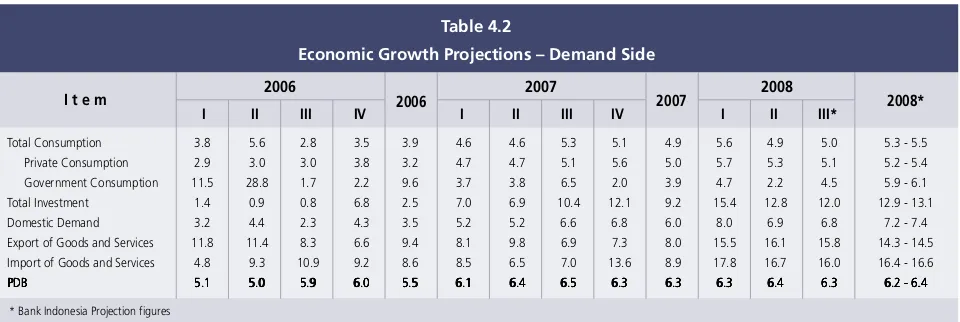
Aggregate Demand
On the demand side, Q3/2008 GDP growth was again high, On the demand side, Q3/2008 GDP growth was again high, On the demand side, Q3/2008 GDP growth was again high, On the demand side, Q3/2008 GDP growth was again high, On the demand side, Q3/2008 GDP growth was again high, bolstered to strong domestic demand and especially consumption bolstered to strong domestic demand and especially consumption bolstered to strong domestic demand and especially consumption bolstered to strong domestic demand and especially consumption bolstered to strong domestic demand and especially consumption (Table 2.1).
(Table 2.1). (Table 2.1). (Table 2.1).
(Table 2.1). The relative stability in public purchasing power, improving consumer optimism and seasonal factors with the religious festivities provided an added boost to household consumption growth. However, the accelerated export growth in the preceding quarter is expected to let up slightly in the figures for Q3/2008 due to the slowdown in the global economy and falling prices for oil and other commodities. Consistent with this
Graph 2.1
Growth of Gross Domestic Product (GDP)
% y-o-y
2005 2006 2007 2008
I II III IV 5.0
6.0 7.0
6.5
5.5
4.5
Graph 2.2
Leading Indicators of Private Consumption
%Y-o-Y, Base Year 2000
2005
I II III IV I II III IV I II III IV I II III*
I t e m
Table 2.1
Economic Growth - Demand Side
2005 2007
* Bank Indonesia Projection figures
Total Consumption 2.0 2.6 5.5 6.7 4.3 3.8 5.6 2.8 3.5 3.9 4.6 4.6 5.3 5.1 4.9 5.6 4.9 5.0
Private Consumption 3.4 3.8 4.4 4.2 4.0 2.9 3.0 3.0 3.8 3.2 4.7 4.7 5.1 5.6 5.0 5.7 5.3 5.1
Government Consumption -9.6 -6.7 14.7 24.9 6.6 11.5 28.8 1.7 2.2 9.6 3.7 3.8 6.5 2.0 3.9 4.7 2.2 4.5
Total Investment 14.9 16.7 10.4 2.7 10.9 1.4 0.9 0.8 6.8 2.5 7.0 6.9 10.4 12.1 9.2 15.4 12.8 12.0
Domestic Demand 5.0 5.9 6.7 5.7 5.8 3.2 4.4 2.3 4.3 3.5 5.2 5.2 6.6 6.8 6.0 8.0 6.9 6.8
Export of Goods and Services 22.0 17.6 12.3 15.6 16.6 11.8 11.4 8.3 6.6 9.4 8.1 9.8 6.9 7.3 8.0 15.5 16.1 15.8
Import of Goods and Services 22.2 23.6 17.7 8.9 17.8 4.8 9.3 10.9 9.2 8.6 8.5 6.5 7.0 13.6 8.9 17.8 16.7 16.0
GDP GDP GDP GDP
GDP 6.06.06.06.06.0 5.95.95.95.95.9 5.85.85.85.85.8 5.15.15.15.15.1 5.75.75.75.75.7 5.15.15.15.15.1 5.05.05.05.05.0 5.95.95.95.95.9 6.06.06.06.06.0 5.55.55.55.55.5 6.16.16.16.16.1 6.46.46.46.46.4 6.56.56.56.56.5 6.36.36.36.36.3 6.36.36.36.36.3 6.36.36.36.36.3 6.46.46.46.46.4 6.36.36.36.36.3
2007 2008 2006
2006
trend, some slackening is also expected in investment growth and import growth.
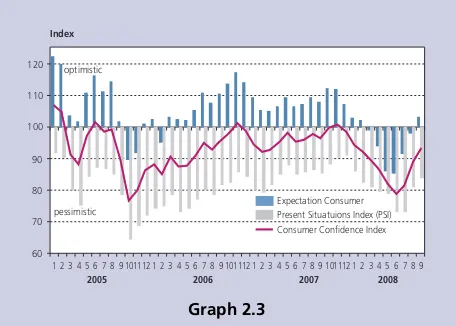
In estimates, household consumption maintained robust In estimates, household consumption maintained robust In estimates, household consumption maintained robust In estimates, household consumption maintained robust In estimates, household consumption maintained robust expansion, although down slightly from the preceding quarter expansion, although down slightly from the preceding quarter expansion, although down slightly from the preceding quarter expansion, although down slightly from the preceding quarter expansion, although down slightly from the preceding quarter as suggested by leading indicators (Graph 2.2). In Q3/2008, growth in household consumption reached 5.1% (yoy) in preliminary figures on the strength of relative stability in public purchasing power and improved consumer confidence. Also contributing to the strong growth in household consumption was expanded consumer financing extended by banks and other finance institutions. Consumption of durable goods, such as electronics and motor vehicles, maintained vigorous expansion. Growth in consumer goods imports was also quite strong early in Q3/2008. At the same time, the findings of the Bank Indonesia Consumer Survey point to an upsurge in consumer confidence (Graph 2.3), largely attributable to rising income expectations and availability of jobs. This indicates that the public has begun to recover from the impact of the fuel price hike, despite the looming threat of diminished sources of income. Also pointing to relatively stable conditions was the upward movement in the retail sales index. The stable index growth is largely the result of real sales growth in the household articles and the clothing and accessories categories.
Estimated investment growth in Q3/2008 is slightly down from Estimated investment growth in Q3/2008 is slightly down from Estimated investment growth in Q3/2008 is slightly down from Estimated investment growth in Q3/2008 is slightly down from Estimated investment growth in Q3/2008 is slightly down from the preceding quarter, in line with the trend in investment leading the preceding quarter, in line with the trend in investment leading the preceding quarter, in line with the trend in investment leading the preceding quarter, in line with the trend in investment leading the preceding quarter, in line with the trend in investment leading indicators (Graph 2.4).
indicators (Graph 2.4). indicators (Graph 2.4). indicators (Graph 2.4).
indicators (Graph 2.4). However, no significant decline is expected in view of the relatively stable public purchasing power and growing business optimism for future economic conditions. Reinforcing this confidence were developments in several leading
Graph 2.3
Consumer Confidence Index √ BI Consumer Survey
Expectation Consumer Present Situatuions Index (PSI) Consumer Confidence Index
Index 60 70 80 90 100 110 120
2005 2006 2007 2008
1 2 3 4 5 6 7 8 9 101112 1 2 3 4 5 6 7 8 9 101112 1 2 3 4 5 6 7 8 9 101112 1 2 3 4 5 6 7 8 9 optimistic
pessimistic
gGDPHousehold Consumer2 (Reference Series) and Cli1
Import of Consumer Goods, Real M1, CPI
99 99 99 100 100 100 100 100 101
gGDPHousehold Consumer2 CLI
97.50 98.00 98.50 99.00 99.50 100.00 100.50 101.00 101.50
investment indicators, such as relatively strong imports of capital goods and investment credit expansion (Graph 2.5). Investment in Q3/2008 is therefore estimated to have charted 12% growth (yoy).
Analysed by component, Q3/2008 investment growth was Analysed by component, Q3/2008 investment growth was Analysed by component, Q3/2008 investment growth was Analysed by component, Q3/2008 investment growth was Analysed by component, Q3/2008 investment growth was supported by vigorous growth in non-construction investment supported by vigorous growth in non-construction investment supported by vigorous growth in non-construction investment supported by vigorous growth in non-construction investment supported by vigorous growth in non-construction investment (Graph 2.6)
(Graph 2.6) (Graph 2.6) (Graph 2.6)
(Graph 2.6). Indications of this are evident in renewed increase in the production index for the domestic machinery industry alongside high growth in imports of capital goods. In contrast, cement consumption, a key indicator relevant to construction investment, showed some decline.
On the other hand, indications of business interest in investment On the other hand, indications of business interest in investment On the other hand, indications of business interest in investment On the other hand, indications of business interest in investment On the other hand, indications of business interest in investment remain strong
remain strong remain strong remain strong
remain strong. The business tendency index published in a survey by the Central Statistics Agency (BPS) points to improvement, reflected in rising orders for input goods and domestic and foreign orders in Q3/2008 (Graph 2.7). The findings of the Business Confidence Survey (SKDU) also point to a growing number of business actors interested in investing during the second half of 2008. Even so, investment continues to be hampered by such factors as interest rates, licensing and access to bank credit.
Exports again recorded high growth in preliminary figures for Exports again recorded high growth in preliminary figures for Exports again recorded high growth in preliminary figures for Exports again recorded high growth in preliminary figures for Exports again recorded high growth in preliminary figures for Q3/2008, albeit down slightly from the preceding quarter. Q3/2008, albeit down slightly from the preceding quarter. Q3/2008, albeit down slightly from the preceding quarter. Q3/2008, albeit down slightly from the preceding quarter. Q3/2008, albeit down slightly from the preceding quarter. Weakening export growth was closely linked to the world economic slowdown and falling international commodity prices, particularly for agricultural and mining products. In the preceding quarter, export demand from emerging market countries such as China and India contributed significantly to Indonesia»s export growth, but this demand gradually slackened due to depressed growth in advanced economies. Nevertheless, the cumulative measure of exports for January-August 2008 was still high at USD95.45 billion, representing 29.87% growth (yoy) over the same period in 2007. Accordingly, preliminary figures for Q3/ 2008 suggest export growth at 15.8% (yoy), buoyed mainly by agricultural and mining products (Graph 2.8).
Imports are expected to show slightly less vigorous expansion in Imports are expected to show slightly less vigorous expansion in Imports are expected to show slightly less vigorous expansion in Imports are expected to show slightly less vigorous expansion in Imports are expected to show slightly less vigorous expansion in Q3/2008 in keeping with the softening performance of exports Q3/2008 in keeping with the softening performance of exports Q3/2008 in keeping with the softening performance of exports Q3/2008 in keeping with the softening performance of exports Q3/2008 in keeping with the softening performance of exports and investment (Graph 2.9).
and investment (Graph 2.9). and investment (Graph 2.9). and investment (Graph 2.9).
and investment (Graph 2.9). Despite this, no major downturn in import growth is expected, given the continued strength of household consumption and improving business optimism for future economic conditions. Preliminary figures for Q3/2008 place import growth at 16.0% (yoy), down from the earlier quarter. Analysed by category of goods, import growth was driven mainly
Graph 2.4
Investment Leading Indicators
Graph 2.5
Real Investment Credit Growth
Gross Fixed Capital Formation2 (Reference Series) and Cli1
IPI, Sales Commercial Car, IPI Machinery and Equipment, Industrial Electricity Consumption, Cement Consumption
99 99 100 100 101 101 102 102
2002 2003 2004 2005 2006 2007 2008
I II III IV I II III IV I II III IV I II III IV I II III IV I II III IV I Gross Fixed Capital Formation2 CLI
II III IV
(%) -25.0 -20.0 -15.0 -10.0 -5.0 0.0 5.0 10.0 15.0 20.0 -10.0 -5.0 0.0 5.0 10.0 15.0 20.0 25.0 (%)
2005 2006 2007 2008
1 3 5 7 9 11 1 3 5 7 9 11 1 3 5 7 9 11 1 3 5 7 9 Gross Fixed Capital Formation (y-o-y)
Real Invesment Credit_Seasonal Adjusted_CMA (m-t-m) Real Invesment Credit (y-o-y)
Graph 2.6
Construction and Non-Construction Investment Growth (%,yoy) 0 2 4 6 8 10 12 14 16 18 -30 -20 -10 0 10 20 30 40 50
2005 2006* 2007** 2008*** (%,yoy)
I II III IV I II III IV I II III IV I II III Manufacturing
by raw materials and capital goods. In the latest data released by BPS, cumulative imports for the January-August 2008 period reached USD89.83 billion, an increase of 91.19% (yoy) over the same period in 2007.
Government Financial Operations
Government financial operations in Q3/2008 (July-August) again Government financial operations in Q3/2008 (July-August) again Government financial operations in Q3/2008 (July-August) again Government financial operations in Q3/2008 (July-August) again Government financial operations in Q3/2008 (July-August) again produced a budget surplus.
produced a budget surplus. produced a budget surplus. produced a budget surplus.
produced a budget surplus. In Q3/2008 (July-August), the budget surplus reached Rp 20 trillion (0.5% of GDP), which compares to the deficit of 0.1% of GDP recorded for the same period one year before. Accordingly, realised Government financial operations during the first eight months of 2008 charted a surplus at Rp 81.8 trillion, equal to 1.8% of GDP. This was considerably higher than the surplus for the same period in 2007 at Rp 14 trillion (0.1% of GDP).
The hefty surplus came as the result of considerably improved revenue performance compared to the same period last year. At end-Q3/2008, total revenues and grants stood 67.9% of the Revised 2008 Budget target, well ahead the same period in 2007 when revenues and grants came to 57.9% of the Revised 2007 Budget. The improvement in state revenues was achieved mainly in taxation, non-tax revenues from oil and natural gas resources, profit share from SOEs and other non-tax revenues.
On the expenditures side, Budget implementation has just On the expenditures side, Budget implementation has just On the expenditures side, Budget implementation has just On the expenditures side, Budget implementation has just On the expenditures side, Budget implementation has just reached 53.2% of the Revised 2008 Budget, largely on par with reached 53.2% of the Revised 2008 Budget, largely on par with reached 53.2% of the Revised 2008 Budget, largely on par with reached 53.2% of the Revised 2008 Budget, largely on par with reached 53.2% of the Revised 2008 Budget, largely on par with the outcome for the same period one year earlier at 51.5% of the outcome for the same period one year earlier at 51.5% of the outcome for the same period one year earlier at 51.5% of the outcome for the same period one year earlier at 51.5% of the outcome for the same period one year earlier at 51.5% of the Revised 2007 Budget
the Revised 2007 Budget the Revised 2007 Budget the Revised 2007 Budget
the Revised 2007 Budget. Budget expenditure absorption in Q3/ 2008 was again dominated by transfer payments with subsidies at Rp 52.1 trillion, including Rp 31.3 trillion for the fuel subsidy. Line ministry/government agency expenditure items, i.e. personnel expenditures, material expenditures and capital expenditures, did not undergo significant expansion. Concerning regional expenditures, Transfers to the Regions were lower during the period under review compared to the same period one year before. These funds were derived mainly from Profit Sharing Funds, Special Allocation Funds and Special Autonomy and Fiscal Balance Funds. Measured for the whole year, Transfers to the Regions reached only 55.2% of target in the Revised 2008 Budget. This was down from the same period in 2007, when these transfers reached 61.2% of target.
Concerning budget financing, the less conducive conditions on Concerning budget financing, the less conducive conditions on Concerning budget financing, the less conducive conditions on Concerning budget financing, the less conducive conditions on Concerning budget financing, the less conducive conditions on financial markets have exacerbated the constraints on issuing financial markets have exacerbated the constraints on issuing financial markets have exacerbated the constraints on issuing financial markets have exacerbated the constraints on issuing financial markets have exacerbated the constraints on issuing
Graph 2.7 Business Sentiment - BPS
Graph 2.8 Export Growth by Sector
0 5 10 15 20 25 (%) (%)
I II III IV I II III IV I II III IV I II III IV I II III
2004 2005 2006 2007 2008
-50 -20 10 40 70 100 130
gExport (yoy) rhs agriculture export industry export mineral export
Graph 2.9 Leading Import Indicators
imp_gdp (Reference Series) and Cli1
98 99 99 100 100 101 101 102 102
2002 2003 2004 2005 2006 2007 2008
I II III IV I II III IV I II III IV I II III IV I II III IV I II III IV I II imp_gdp CLI 99.2 99.4 99.6 99.8 100.0 100.2 100.4 100.6 100.8 III IV Industrial Production Index, Volume of Industrial Electricity, Automotive Production, Japan Manufacturing Index, Paper/Paper Products Production Index, Clothing and, Rp to Accessories Production Index, Korea Production and Services Index, Rp to USD, Rp to JPY, Real Consumption Credit, Real M1
Index
2005 2006 2007 2008
80 90 100 110 120 130 140 80 90 100 110 120 130 Index 2004
Government Securities. Government Securities. Government Securities. Government Securities.
Government Securities. The increased yield on Government Securities, all to be expected in the present conditions of global financial market turmoil and tight liquidity since mid-way through the period under review, have impacted issuances of Government Securities. For year-to-date, net issuance of Government Securities is only at 87% of the targeted level in the Revised 2008 Budget.1
Government consumption and investment is estimated to have charted more Government consumption and investment is estimated to have charted more Government consumption and investment is estimated to have charted more Government consumption and investment is estimated to have charted more Government consumption and investment is estimated to have charted more vigorous growth in Q3/2008 compared to Q2/2008
vigorous growth in Q3/2008 compared to Q2/2008 vigorous growth in Q3/2008 compared to Q2/2008 vigorous growth in Q3/2008 compared to Q2/2008
vigorous growth in Q3/2008 compared to Q2/2008. In July-August 2008, Central Government expenditures and Transfers to the Regions measured 65.5% against projections, indicating that the targeted Government consumption for Q3/2008 was achievable. However, the low rate of capital expenditures, only at 53% of the budget projection, indicates that Government investment in Q3/2008 will fall short of projects even though Transfers to the Regions are estimated to be on track. Nevertheless, the overall rate of realised Government investment in Q3/2008 is expected to surpass the levels reached in Q2/2008.
Aggregate Supply
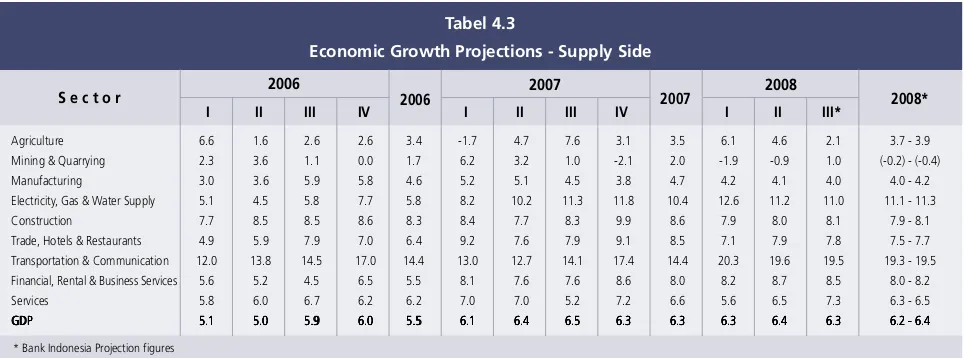
Consistent with supply-side developments, the economy is estimated to have Consistent with supply-side developments, the economy is estimated to have Consistent with supply-side developments, the economy is estimated to have Consistent with supply-side developments, the economy is estimated to have Consistent with supply-side developments, the economy is estimated to have maintained strong supply-side growth during Q3/2008.
maintained strong supply-side growth during Q3/2008. maintained strong supply-side growth during Q3/2008. maintained strong supply-side growth during Q3/2008.
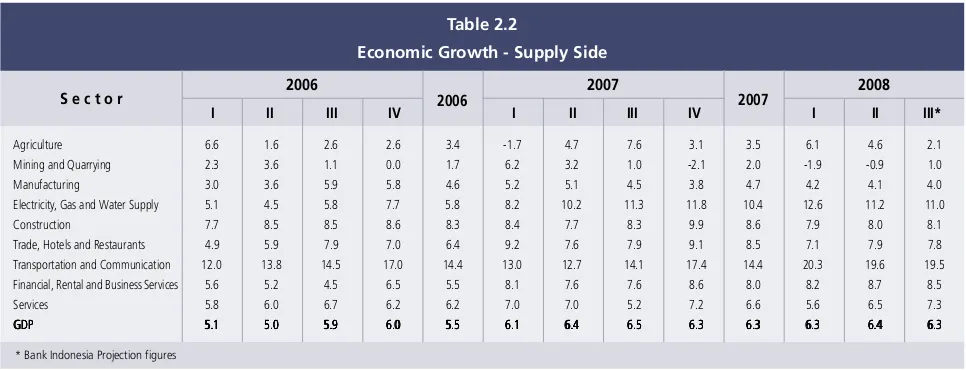
maintained strong supply-side growth during Q3/2008. In preliminary figures, most economic sectors charted high growth (Table 2.2). The leading growth sectors, manufacturing and trade, hotels and restaurants, maintained relatively stable performance with growth at 4.0% (yoy) and 7.8% (yoy). Despite this, the agriculture sector recorded lower estimated growth at 2.1% (yoy) as expected with the passing of the harvest season. On the other hand, estimated growth in other sectors, such as transport and communications, the electricity, gas and water utilities sector and construction, was again strong at 19.5% (yoy), 11.0% (yoy) and 8.1% (yoy). Supporting these sectoral growth estimates were various sectoral indicators generally pointing to improvement, such as the capacity utilisation based on the Bank Indonesia Production Survey and the machinery and tools production index. The findings of the Business Tendencies Survey conducted by BPS also indicate positive sentiment in business expectations during Q3/2008, fuelled by increased domestic and foreign orders and orders of input goods. Alongside this, capacity utilisation in the Business Survey was relatively stable. Analysis of sectoral distribution shows that manufacturing, the trade, hotels and restaurants sector and agriculture were again the dominant areas of economic activity. However, when analysed by contribution to GDP growth, the leading sectors were transport and communications, the trade, hotels and restaurants sector and manufacturing.
Manufacturing maintained relatively stable growth in Q3/2008 at 4.0% (yoy). Manufacturing maintained relatively stable growth in Q3/2008 at 4.0% (yoy). Manufacturing maintained relatively stable growth in Q3/2008 at 4.0% (yoy). Manufacturing maintained relatively stable growth in Q3/2008 at 4.0% (yoy). Manufacturing maintained relatively stable growth in Q3/2008 at 4.0% (yoy). Rising demand driven by the religious festive season at end-Q3/2008 was on factor spurring growth, particularly in the food, beverages and tobacco industry subsector and the textile industry subsector. In addition, some leading indicators for industry, such as
the Manufacturing Production Index released by BPS, maintained stable movement. Also reflecting this was the stable level of vehicle production. In contrast, the Production and Capacity Utilisation Index in the Bank Indonesia Production Survey showed a rising trend. Financial statements of several industrial companies reported improvement, with sales growth matched by increased inventory. As regards financing, the industry sector continued to show credit expansion. Another leading indicator, the high level of bank lending to industry as of mid-Q3/2008, offers further confirmation of industry sector growth.
The trade, hotels and restaurants sector recorded another quarter of strong growth The trade, hotels and restaurants sector recorded another quarter of strong growthThe trade, hotels and restaurants sector recorded another quarter of strong growth The trade, hotels and restaurants sector recorded another quarter of strong growth The trade, hotels and restaurants sector recorded another quarter of strong growth at an estimated 7.8% (yoy) for Q3/2008.
at an estimated 7.8% (yoy) for Q3/2008. at an estimated 7.8% (yoy) for Q3/2008. at an estimated 7.8% (yoy) for Q3/2008.
at an estimated 7.8% (yoy) for Q3/2008. Vigorous household consumption, especially in advance of the religious festivities at the end of Q3/2008, was one factor driving growth in the trade, hotels and restaurants sector. Furthermore, some leading indicators for trade, hotels and restaurants also provide confirmation of high growth. As of early Q3/2008, the Bank Indonesia Retail Index maintained stable growth. Similar upward trends were also visible in the corporate sales and inventory within the trade sector to the end of Q2/2008. The indicator for the hotels subsector, i.e. hotel occupancy rates in Jakarta and Bali, showed relatively stable growth as of end-Q2/2008. In regard to financing, bank lending to the trade sector maintained brisk expansion in activity until mid-Q3/2008.
Growth in the agriculture sector slowed from the preceding quarter to an estimated Growth in the agriculture sector slowed from the preceding quarter to an estimatedGrowth in the agriculture sector slowed from the preceding quarter to an estimated Growth in the agriculture sector slowed from the preceding quarter to an estimated Growth in the agriculture sector slowed from the preceding quarter to an estimated 2.1% (yoy) in Q3/2008.
2.1% (yoy) in Q3/2008. 2.1% (yoy) in Q3/2008. 2.1% (yoy) in Q3/2008.
2.1% (yoy) in Q3/2008. The less vigorous growth in the agriculture sector is explained, among others, by the end of the rice harvest. Added to this, the slowdown in the estates subsector caused by falling export demand put further brakes on agriculture sector performance. Nevertheless, the foodcrops subsector remained stable as demonstrated by the relatively stable figures released by BPS for rice production (ARAM II - 2008) compared to the preceding year. Reinforcing this was the high growth in agriculture sales and inventory as of Q2/2008. In the financing
%Y-o-Y, Base Year 2000
I II III IV I II III IV I II III*
S e c t o r
Table 2.2
Economic Growth - Supply Side
2007
* Bank Indonesia Projection figures
Agriculture 6.6 1.6 2.6 2.6 3.4 -1.7 4.7 7.6 3.1 3.5 6.1 4.6 2.1
Mining and Quarrying 2.3 3.6 1.1 0.0 1.7 6.2 3.2 1.0 -2.1 2.0 -1.9 -0.9 1.0
Manufacturing 3.0 3.6 5.9 5.8 4.6 5.2 5.1 4.5 3.8 4.7 4.2 4.1 4.0
Electricity, Gas and Water Supply 5.1 4.5 5.8 7.7 5.8 8.2 10.2 11.3 11.8 10.4 12.6 11.2 11.0
Construction 7.7 8.5 8.5 8.6 8.3 8.4 7.7 8.3 9.9 8.6 7.9 8.0 8.1
Trade, Hotels and Restaurants 4.9 5.9 7.9 7.0 6.4 9.2 7.6 7.9 9.1 8.5 7.1 7.9 7.8
Transportation and Communication 12.0 13.8 14.5 17.0 14.4 13.0 12.7 14.1 17.4 14.4 20.3 19.6 19.5
Financial, Rental and Business Services 5.6 5.2 4.5 6.5 5.5 8.1 7.6 7.6 8.6 8.0 8.2 8.7 8.5
Services 5.8 6.0 6.7 6.2 6.2 7.0 7.0 5.2 7.2 6.6 5.6 6.5 7.3
GDP GDP GDP GDP
GDP 5.15.15.15.15.1 5.05.05.05.05.0 5.95.95.95.95.9 6.06.06.06.06.0 5.55.55.55.55.5 6.16.16.16.16.1 6.46.46.46.46.4 6.56.56.56.56.5 6.36.36.36.36.3 6.36.36.36.36.3 6.36.36.36.36.3 6.46.46.46.46.4 6.36.36.36.36.3
2007 2008 2006
area, indications of slowing agriculture performance were also reflected in the downturn in agriculture sector lending during mid-Q3/2008.
Q3/2008 growth in the mining sector is estimated at a positive 1.0% (yoy), even Q3/2008 growth in the mining sector is estimated at a positive 1.0% (yoy), even Q3/2008 growth in the mining sector is estimated at a positive 1.0% (yoy), even Q3/2008 growth in the mining sector is estimated at a positive 1.0% (yoy), even Q3/2008 growth in the mining sector is estimated at a positive 1.0% (yoy), even though not fully reflected in leading indicators.
though not fully reflected in leading indicators. though not fully reflected in leading indicators. though not fully reflected in leading indicators.
though not fully reflected in leading indicators. Mining performance was bolstered by exports of coal, metal ores, clinker and concentrates, alongside indications of rising aluminium exports. However, mining sales and inventory still showed a downward trend. As regards financing, lending growth in the mining sector was marked by slowing momentum.
The transport and communications sector again forged ahead in Q3/2008 with The transport and communications sector again forged ahead in Q3/2008 with The transport and communications sector again forged ahead in Q3/2008 with The transport and communications sector again forged ahead in Q3/2008 with The transport and communications sector again forged ahead in Q3/2008 with growth estimated at 19.5% (yoy).
growth estimated at 19.5% (yoy). growth estimated at 19.5% (yoy). growth estimated at 19.5% (yoy).
growth estimated at 19.5% (yoy). The continued strength of growth in this sector is attributable largely to performance in the communications subsector, reflected in ongoing growth trend in cellular telephone subscribers during Q2/2008. Alongside this, the transportation subsector also showed signs of an upward trend, reflected in rising numbers of rail passengers. Financing in the transport and communications sector maintained growth with credit expansion on the rise. The high rate of credit expansion in this sector was driven mainly by the telecommunications subsector, where strong prospects are underpinned by the still enormous potential market.
The construction sector achieved estimated Q3/2008 growth at 8.1% (yoy). The construction sector achieved estimated Q3/2008 growth at 8.1% (yoy). The construction sector achieved estimated Q3/2008 growth at 8.1% (yoy). The construction sector achieved estimated Q3/2008 growth at 8.1% (yoy). The construction sector achieved estimated Q3/2008 growth at 8.1% (yoy). Confirming the growth in this sector were various indicators, such as growth in commercial property construction. From the financing side, loan disbursements for property credit and construction credit maintained stable growth, even surpassing the averages of 2007.
THE BALANCE OF PAYMENTS
Strong economic growth and the onset of decline in world commodity prices led to Strong economic growth and the onset of decline in world commodity prices led to Strong economic growth and the onset of decline in world commodity prices led to Strong economic growth and the onset of decline in world commodity prices led to Strong economic growth and the onset of decline in world commodity prices led to changes in performance of the balance of payments, most importantly in the current changes in performance of the balance of payments, most importantly in the current changes in performance of the balance of payments, most importantly in the current changes in performance of the balance of payments, most importantly in the current changes in performance of the balance of payments, most importantly in the current account.
account. account. account.
account. The current account began to record a deficit as a result of continued strength of imports. Leading in import growth were imports of capital goods and raw materials in support of investment and production. In a similar vein, the capital and financial account sustained pressure from the shift in investor interest in response to the turbulence on global financial markets. In the final outcome, international reserves reached USD57.1 billion, equivalent to 4.2 months of imports and servicing of official debt. Measured annually, indicators of external vulnerability showed further improvement with the continued positive performance in exports and subdued foreign debt indicators. Like before, the condition of external balances was conducive to Indonesia»s economic performance.
The Current Account
In preliminary figures for Q3/2008, the current account came under pressure from In preliminary figures for Q3/2008, the current account came under pressure from In preliminary figures for Q3/2008, the current account came under pressure from In preliminary figures for Q3/2008, the current account came under pressure from In preliminary figures for Q3/2008, the current account came under pressure from accelerated import growth that outpaced the rise in exports
accelerated import growth that outpaced the rise in exports accelerated import growth that outpaced the rise in exports accelerated import growth that outpaced the rise in exports
robust domestic demand. Leading in import growth were imports of capital goods and raw materials in support of investment and production. On the other hand, despite indications of slowdown, exports maintained positive performance. Indonesia»s exports to several developed nations continued to rise, as to be expected with the nature of Indonesia»s resource-based and low-end technology exports that are less sensitive to changing incomes in developed countries. The slowing trend in export growth resulted mainly from the downward trend in international commodity prices.
Based on data for the January-August 2008 period, non-oil and gas exports reached USD72.9 billion, representing growth of 19.3% (yoy) over the same period one year before. The high rate of export growth was driven by growth in agricultural and industrial exports at 37.5% and 22.8%. In contrast, mining commodities slowed considerably, with export growth at a mere 0.8% over the same period last year. This is explained by a drop in coal exports brought on by the shift to meeting growing domestic energy needs and the onset of decline in international metal prices. On the other hand, non-fossil fuel imports for January-August 2008 mounted 42.6% (yoy) to USD67.5 billion, with import growth for consumer goods, raw materials and capital goods recorded at 29.9%, 41.6% and 55.6% respectively. The growth in non-fossil fuel imports is expected to benefit the domestic economy, given that since 2006, positive trends in import growth have been positively correlated with growth in consumption and investment.
In the oil and gas sector, the trade balance was strengthened by gas exports. During January-July 2008, oil and natural gas exports reached US$10.4 billion and US$10.1 billion, up 64.0% and 58.2% over the same period one year earlier. On the other hand, soaring prices resulted in spiralling oil imports during January-July 2008 (up 72.7%, yoy), pushing Indonesia»s oil trade deficit for that period to USD6.2 billion. Despite this, with the solid performance in gas exports, the oil and gas sector still managed a surplus of USD3.9 billion.
The Capital and Financial Account
In preliminary figures, the capital and financial account recorded yet another surplus In preliminary figures, the capital and financial account recorded yet another surplusIn preliminary figures, the capital and financial account recorded yet another surplus In preliminary figures, the capital and financial account recorded yet another surplus In preliminary figures, the capital and financial account recorded yet another surplus in Q3/2008
in Q3/2008in Q3/2008 in Q3/2008
International Reserves
3. Monetary Indicators and Policy,
Q3/2008
Developments in the Indonesian economy were marked by a series of external and internal shocks during Q3/2008. Inflationary pressure remained high, fuelled by robust domestic demand and high inflation expectations. The annual measure of CPI inflation was again markedly higher in comparison to Q2/2008. Q3/2008 CPI inflation was recorded at 2.88% (qtq) or 12.14% (yoy). Despite the increase in annual CPI inflation (yoy), quarterly inflation (qtq) in the CPI showed some movement in return to the normal trend. The average rupiah exchange rate for Q3/2008 appreciated 0.47% from Rp 9,259/USD to Rp 9,216/USD albeit with a build-up of downward pressure at the end of the period. Stable macroeconomic conditions, the continued attractiveness of rupiah-denominated yields and broad interest rate differential proved adequate to rein in capital outflows from rupiah instruments and prevent the rupiah from steeper decline.
To safeguard macroeconomic stability, Bank Indonesia decided to raise the BI Rate 75 bps to 9.25% at end-Q3/2008. This rate policy was bolstered by a range of actions to maintain rupiah stability and other measures designed to reinforce monetary control operations.
INFLATION
Monthly inflation maintained a rising trend during Q3/2008, mainly in response to Monthly inflation maintained a rising trend during Q3/2008, mainly in response toMonthly inflation maintained a rising trend during Q3/2008, mainly in response to Monthly inflation maintained a rising trend during Q3/2008, mainly in response to Monthly inflation maintained a rising trend during Q3/2008, mainly in response to heavy domestic demand and the seasonal factor of religious festivities (Eid-ul-Fitr) heavy domestic demand and the seasonal factor of religious festivities (Eid-ul-Fitr)heavy domestic demand and the seasonal factor of religious festivities (Eid-ul-Fitr) heavy domestic demand and the seasonal factor of religious festivities (Eid-ul-Fitr) heavy domestic demand and the seasonal factor of religious festivities (Eid-ul-Fitr). Measured annually, CPI inflation at end-Q3/2008 reached 12.14% (yoy), up from 11.03% (yoy) in the preceding quarter (Graph 3.1). In September 2008, monthly inflation came to 0.97% (mtm). Analysed by expenditure category, inflation in Q3/ 2008 was driven primarily by the foodstuffs category; housing, water, electricity, gas and fuels; and the processed foods, beverages, cigarettes and tobacco category (Graph 3.2).
The CPI inflation rate is explained by the non-fundamentals of The CPI inflation rate is explained by the non-fundamentals ofThe CPI inflation rate is explained by the non-fundamentals of The CPI inflation rate is explained by the non-fundamentals of The CPI inflation rate is explained by the non-fundamentals of rising pressure in volatile foods and administered prices, rising pressure in volatile foods and administered prices,rising pressure in volatile foods and administered prices, rising pressure in volatile foods and administered prices, rising pressure in volatile foods and administered prices,11111 and and and and and
fundamental factor of core inflation made up of inflation fundamental factor of core inflation made up of inflationfundamental factor of core inflation made up of inflation fundamental factor of core inflation made up of inflation fundamental factor of core inflation made up of inflation expectations, demand-side pressure and the output gap. expectations, demand-side pressure and the output gap.expectations, demand-side pressure and the output gap. expectations, demand-side pressure and the output gap. expectations, demand-side pressure and the output gap. Pressure from volatile foods inflation was commensurate with the high international food commodity prices and the seasonal trends associated with the Ramadan fasting month and Eid-ul-Fitr festivities. Administered prices inflation, which mounted due to the ongoing shortages of energy commodities in some regions,
Graph 3.1 CPI Inflation
%, mtm %, yoy
0 1 2 3 4 5
2006 2007 2008
1 2 3 4 5 6 7 8 9 10 11 12 1 2 3 4 5 6 7 8 9 10 11 12 1 2 3 4 5 6 7 8 9 -3 2 7 12 17 22 MtM
YoY (RHS)
also exacerbated Q3/2008 CPI inflation. At the same time, inflationary pressure from fundamentals, as reflected in the trend in core inflation, also remained high. The main factors influencing core inflation were persistently high inflation expectations and imported inflation and swelling aggregate demand.
Volatile foods inflation mounted higher in Q3/2008 in both Volatile foods inflation mounted higher in Q3/2008 in both Volatile foods inflation mounted higher in Q3/2008 in both Volatile foods inflation mounted higher in Q3/2008 in both Volatile foods inflation mounted higher in Q3/2008 in both quarterly and annual figures.
quarterly and annual figures. quarterly and annual figures. quarterly and annual figures.
quarterly and annual figures. The surge in volatile foods inflation is related to high international foodstuff prices and escalating seasonal demand at the time of the fasting month and Eid-ul-Fitr festivities. Commodities in this category that underwent inflation in Q3/2008 included eggs and broiler chicken. In the case of broiler chicken and eggs, prices increases resulted mainly from increased international market prices for corn and soy beans, used as raw material for domestic animal feeds. On the other hand, prices for other volatile food items, such as cooking oil, rice and seasonings, helped to mitigate the surge in inflationary pressure. The drop in international CPO prices in line with the drastic fall in world crude oil prices to below USD100 per barrel prompted manufacturers to hold back from raising domestic cooking oil prices. Furthermore, despite the end of the harvest, rice prices were relatively stable due to the maintenance of adequate rice buffer stocks by the National Logistics Agency (Bulog) for market operations in the event of price increases beyond reasonable limits. Positive developments were also evident in the seasonings category (shallots, red chilli peppers and tomatoes), which underwent deflation as a result of plentiful supply.
Monthly administered prices inflation showed an upward trend in Q3/2008, but Monthly administered prices inflation showed an upward trend in Q3/2008, but Monthly administered prices inflation showed an upward trend in Q3/2008, but Monthly administered prices inflation showed an upward trend in Q3/2008, but Monthly administered prices inflation showed an upward trend in Q3/2008, but was lower in the quarterly measure compared to Q2/2008
was lower in the quarterly measure compared to Q2/2008 was lower in the quarterly measure compared to Q2/2008 was lower in the quarterly measure compared to Q2/2008
was lower in the quarterly measure compared to Q2/2008. The increased administered prices inflation resulted largely from increases in bottled LPG and kerosene prices, due to shortages. Teething troubles in the conversion programme caused by shortages of LPG and kerosene supplied by Pertamina were exploited by some parties to sell LPG and kerosene at marked-up prices. Besides kerosene and LPG, prices mounted for clove cigarettes and filter clove cigarettes, although the impact was minimal. Despite the prevailing upward trend, the quarterly measure of administered prices inflation (qtq) was well below that of the earlier quarter, due to the absence of lingering impact from the past fuel price hike.
Core inflation was again strong in Q3/2008. Core inflation was again strong in Q3/2008. Core inflation was again strong in Q3/2008. Core inflation was again strong in Q3/2008.
Core inflation was again strong in Q3/2008. The most important factors influencing core inflation during the quarter originated from external pressures comprising heightened inflation in trading partner countries (Graph 3.3) and high international foodstuff prices. In a similar trend, public expectations generally remained high during Q3/2008 (Graph 3.4). Expectations were not only
Graph 3.2
Inflation and Contribution to Inflation by Category, Goods and Services Q3/2008 (q-t-q)
0 1 2 3 4 5 6 2.62 3.58 1.64 3.77 0.92 0.77 4.75 % Share (m-t-m) Inflation (m-t-m)
Proccesed Food Food, Beverages, Cigarattes & Tobacco Housing, Electricity, Water, Gas, and Fuel Clothing Health Education, Recreation & Sport Transportation, Communication & Financial Service
Graph 3.3
Exchange Rate and Trade Partner Countries Inflation
Trade Partner Countries Inflation (RHS)
%,yoy CPI (LHS) %,yoy 12.14 0.45 3.89 -12 -7 -2 3 8 13 18 23 0 1 2 3 4 5
2004 2005 2006 2007 2008
1 3 5 7 9 11 1 3 5 7 9 11 1 3 5 7 9 11 1 3 5 7 9 11 1 3 5 7 9
Graph 3.6
Rupiah Exchange Rate Volatility Graph 3.5
Rupiah Exchange Rate
2006 2007 2008
9385 9,216 9700 10000 9400 9100 8800 8500 2
JanFeb15Mar31May16Jun29Aug14Sep27Nov10Dec26Feb8Mar26May9Jun22Aug7Sep20Nov5Dec19Feb1Mar18May1Jun1630JulSep12 Daily Exchange rate Quarterly Average
Exchange Rate, Rp/USD Volatility, %
8,000 8,500 9,000 9,500 10,000 -1.0 2.0 3.0 4.0 5.0 6.0 7.0 9385 1.51 1.42 0.61 1.11 2 Jan
2006 2007 2008
13 Feb 27 Mar 8 May 19 Jun 31 Jul 11 Sep 23 Oct 4 Dec 15 Jan 26 Feb 9 Apr 21 May 2 Jul 13 Aug 24 Sep 5 Nov 17 Dec 28 Jan 10 Mar 21 Apr 2 Jun 14 Jul 25 Aug Daily Exchange Rate
Volatility
Quarterly Average Volatility
fuelled by external pressures, but also by the hike in domestic fuel prices in the preceding quarter. Analysed by demand-supply interaction, inflationary pressure from the output gap is forecasted to be negative due to the continued supply-side responsiveness to rising demand. Even so, the steadily rising demand-side pressures call for continued vigilance.
Analysed by contribution, price increases in the categories of processed foods, beverages, cigarettes and tobacco and education, recreation and sports accounted for the strongest rise in core inflation. This is to be expected with the pattern of the Eid-ul-Fitr festive season, marked by soaring demand. On the other hand, falling prices for gold jewellery as world gold prices slipped to a low of USD779 per ounce helped keep core inflation from climbing higher.
RUPIAH EXCHANGE RATE
Despite downward pressure at the end of the period under review, the average value of the rupiah exchange rate appreciatedthe rupiah exchange rate appreciatedthe rupiah exchange rate appreciatedthe rupiah exchange rate appreciatedthe rupiah exchange rate appreciated further during Q3/2008
further during Q3/2008 further during Q3/2008 further during Q3/2008
further during Q3/2008. Measured as an average, the rupiah gained 0.47% in Q3/2008, climbing from Rp 9,259 in Q2/2008 to Rp 9,216 to the USD (Graph 3.5). Due to strong depreciating pressure at the end of the quarter, the rupiah closed 1.76% down from Rp 9,220 to the USD at Q2/2008 at the end-Q3/2008 position of Rp 9,385 to the USD. During end-Q3/2008, movement in the rupiah maintained a fluctuating trend due to the escalation of pressure at the end of the period. Rupiah volatility widened in Q3/2008 to 1.11% from 0.61% in the preceding quarter (Graph 3.6).
The mounting risk of global economic slowdown, the The mounting risk of global economic slowdown, the The mounting risk of global economic slowdown, the The mounting risk of global economic slowdown, the The mounting risk of global economic slowdown, the intensifying financial crisis in the US and perceptions of the intensifying financial crisis in the US and perceptions of the intensifying financial crisis in the US and perceptions of the intensifying financial crisis in the US and perceptions of the intensifying financial crisis in the US and perceptions of the balance of payments outlook all affected movement in the rupiah balance of payments outlook all affected movement in the rupiah balance of payments outlook all affected movement in the rupiah balance of payments outlook all affected movement in the rupiah balance of payments outlook all affected movement in the rupiah during Q3/2008
during Q3/2008 during Q3/2008 during Q3/2008
during Q3/2008. The global economic slowdown and the strengthening of the dollar prompted a slide in international commodity prices, which also affected Indonesia»s mainstay export commodities. This has led to perceptions of deterioration in the balance of payments outlook for Indonesia, with focus on the current account. The US slide into financial crisis has also triggered capital flight from emerging market assets prompted by renewed risk aversion among foreign investors. These jitters set off a round of capital reversal from assets in countries in the region accompanied by downward pressure on regional currencies. Despite the considerable pressure on the rupiah, on
Graph 3.4
Inflation Expectation - Consensus Forecast
%, yoy 5.0 5.5 6.0 6.5 7.0 7.5 8.0 8.5 9.0 9.5 10.0 10.5 11.0
1 2 3 4 5 6 7 8 9 10 11 12 1 2 3 4 5 6 7 8 9
2007 2008
the regional level the rupiah maintained relative stability in comparison to other currency rates in the region. Conducive factors in the domestic economy in tandem with the tight bias monetary policy stance and Bank Indonesia»s stabilisation of the forex market helped to fend off pressure for steeper depreciation in the rupiah.
Risks have escalated in the wake of external developments near Risks have escalated in the wake of external developments near Risks have escalated in the wake of external developments near Risks have escalated in the wake of external developments near Risks have escalated in the wake of external developments near the end of Q3/2008
the end of Q3/2008 the end of Q3/2008 the end of Q3/2008
the end of Q3/2008. The global repricing of risk brought on by the weakening in the global economy and the financial crisis in the US has dampened the risk appetite for emerging market assets. Reflecting this is the widening in the yield spread between Indonesia global bonds and US T-notes from 370 bps in Q2/ 2008 to 411 bps at end Q3/2008 (Graph 3.7). Another risk indicator pointing in a similar direction was the renewed increase in the EMBIG (Emerging Market Bond Index Global) spread and the persistently high level of the swap premium at the end of the period under review (Graph 3.8).
The tight bias policy stance adopted by Bank Indonesia at a time The tight bias policy stance adopted by Bank Indonesia at a time The tight bias policy stance adopted by Bank Indonesia at a time The tight bias policy stance adopted by Bank Indonesia at a time The tight bias policy stance adopted by Bank Indonesia at a time of declining interest rates in advanced economies has widened of declining interest rates in advanced economies has widened of declining interest rates in advanced economies has widened of declining interest rates in advanced economies has widened of declining interest rates in advanced economies has widened the yield spread for the rupiah.
the yield spread for the rupiah. the yield spread for the rupiah. the yield spread for the rupiah.
the yield spread for the rupiah. This has become one incentive for investing in rupiah-denominated assets. Yield on rupiah investments, indicated by the interest rate differential and the yield spread of government bonds (domestic currency) over US T-Notes, widened further, placing Indonesia ahead of all other countries in the region (Graph 3.9). Uncovered interest parity widened from 6.38% at end-Q2/2008 to 7.05% in the quarter under review, and was the highest among countries in the region. With this yield adjusted for risk,2 the covered interest rate parity
came to 3.27% for the quarter, still ahead of the region. At the same time, the other yield indicator, the yield spread between Government Securities and US T-Notes, retained its edge in the region.
The escalation in external risks linked to the spreading impact of The escalation in external risks linked to the spreading impact of The escalation in external risks linked to the spreading impact of The escalation in external risks linked to the spreading impact of The escalation in external risks linked to the spreading impact of the global economic slowdown and uncertainty in the condition the global economic slowdown and uncertainty in the condition the global economic slowdown and uncertainty in the condition the global economic slowdown and uncertainty in the condition the global economic slowdown and uncertainty in the condition of the US financial sector prompted foreign investors to pull their of the US financial sector prompted foreign investors to pull their of the US financial sector prompted foreign investors to pull their of the US financial sector prompted foreign investors to pull their of the US financial sector prompted foreign investors to pull their money out of SBIs, even in spite of ongoing gains in Government money out of SBIs, even in spite of ongoing gains in Government money out of SBIs, even in spite of ongoing gains in Government money out of SBIs, even in spite of ongoing gains in Government money out of SBIs, even in spite of ongoing gains in Government Securities and stocks.
Securities and stocks. Securities and stocks. Securities and stocks.
Securities and stocks. However, efforts to sustain foreigner confidence in macro policy management and the high yields on Government Securities encouraged inflows of capital into
Graph 3.7
Yield Spread between Global Bond RI and UST-Note
%
2007 2008
Yield Global Bond Indonesia
Yield UST-Note 514 bps Spread 2.50 3.50 4.50 5.50 6.50 7.50 8.50 9.50
Mar Apr May Jun Jul Jul Aug Sep Oct Nov Dec Jan Feb Mar Apr May Jun Jun Aug Sep
Graph 3.8
Swap Premium in Various Tenors
Source : Reuters (processed)
%
2007 2008
JanFebMarAprMayJunJulAugSepOctNovDec JanFebMarAprMayJunJulAugSep -2.0 0.0 2.0 5.0 6.0 8.0 9.0 7.0 4.0 3.0 1.0 -1.0
6-Months Premium 12-Months Premium 1-Month Premium 3-Months Premium
2 In this regard, the risk indicator used is yield spread between Indonesian Government foreign currency bonds and US T-Notes.
Graph 3.9
Comparison of Yields Across Various Countries
2006 2007 2008
Indonesia Malaysia Philippines Thailand Singapore -4 -2 0 2 4 6 8 10 12
Jan Mar May Jul Sep Nov Jan Mar May Jul Sep Nov Jan Mar May Jul Sep 8.982
Government Securities. Foreign ownership of Government Securities mounted Rp 10.13 trillion (USD1.11 billion) to the end-quarter position of Rp 104.23 trillion (USD11.15 billion), bringing total foreign placements in SBIs and Government Securities to Rp 124.6 trillion (USD13.33 billion). On the stock market, foreign investors again recorded a net purchase in Q3/2008 at Rp 2.16 trillion (USD230.35 million). In the outcome of these developments, Q3/2008 recorded a net outflow of foreign capital at USD1.9 billion.
Domestic demand for foreign currencies was again dominated Domestic demand for foreign currencies was again dominated Domestic demand for foreign currencies was again dominated Domestic demand for foreign currencies was again dominated Domestic demand for foreign currencies was again dominated by corporate demand.
by corporate demand. by corporate demand. by corporate demand.
by corporate demand. Rising imports led to increased foreign currency demand from the corporate sector, led by SOEs (Graph 3.10). Average corporate forex demand during the quarter edged upwards to about USD354 million per day from the preceding quarter when daily demand averaged USD329 million.
MONETARY POLICY Policy Strategy
During Q3/2008, Bank Indonesia raised the BI Rate by 75 bps to 9.25% at the end During Q3/2008, Bank Indonesia raised the BI Rate by 75 bps to 9.25% at the endDuring Q3/2008, Bank Indonesia raised the BI Rate by 75 bps to 9.25% at the end During Q3/2008, Bank Indonesia raised the BI Rate by 75 bps to 9.25% at the end During Q3/2008, Bank Indonesia raised the BI Rate by 75 bps to 9.25% at the end of the quarter
of the quarterof the quarter of the quarter
of the quarter. These decisions were taken to safeguard the achievement of the medium-term inflation target while monitoring a range of developments and taking account of overall macroeconomic conditions and financial system stability. This level of the BI Rate was subsequently reflected in rate movement on the overnight interbank market.
In view of recent developments on the global financial market, Bank Indonesia decided to lower the overnight Repo Rate from the former BI Rate plus 300 bps to the BI Rate plus 100 bps and to raise the FASBI Rate from the BI Rate minus 200 bps to the BI Rate minus 100 bps. This decision was taken to ensure adequate banking liquidity while safeguarding monetary policy effectiveness in inflation control. Accordingly, the overnight interest rate corridor will move symmetrically with the BI rate at ± 100 bps. In addition, on 23 September 2008, Bank Indonesia decided to extend the term of fine tune operations (FTO) from 1-14 days to 1 day-3 months. The extension of the FTO tenor is intended to provide greater room for liquidity management, which comprises part of the Open Market Operations (OMO) conducted by Bank Indonesia. More flexible management of liquidity on the interbank money market will improve the effectiveness of Bank Indonesia»s actions to safeguard the proper functioning of the market. Accordingly, interest rate stability and unimpeded liquidity flows will be maintained on the interbank money market in the event of any heightened uncertainties, such as has happened on global money markets in recent times.
During the third quarter, transmission of the BI Rate to the financial sector operated through several channels. On the money marketOn the money marketOn the money marketOn the money marketOn the money market, rates for various tenors tracked
Graph 3.10 Forex Demand and Supply
Million USD IDR/USD
8600 8700 8800 8900 9000 9100 9200 9300 9400 9500
2007 2008
Excess Supply
Excess Demand -1000
-5000 -3000 1000 3000 5000
Jun Aug Oct Apr
Feb Dec
Jan Mar May Jul Sep Nov JanFebMarAprMayJunJulAugSep
movement in the BI Rate and forward perceptions. Alongside this, the BI Rate was transmitted more strongly to bank deposit and lending rates. However, the increases in the BI Rate were not transmitted into funding growth and credit expansion. Growth in depositor funds continued to slide, while credit expansion gathered momentum. On the stock marketOn the stock marketOn the stock marketOn the stock marketOn the stock market, IDX Index performance was heavily influenced by the fallout from escalating global risks, resulting in 21.9% correction. On theOn theOn theOn theOn the Government Securities market
Government Securities market Government Securities market Government Securities market
Government Securities market, the global turmoil drove up yields on short-term tenors. During Q3/2008, yields on short-term Government Securities continued to rise. However, on the mutual funds marketmutual funds marketmutual funds marketmutual funds market, NAV faltered in keeping with the weakermutual funds market performance of underlying assets.
Concerning the exchange rate, Bank Indonesia steadily pursued a series of measures Concerning the exchange rate, Bank Indonesia steadily pursued a series of measures Concerning the exchange rate, Bank Indonesia steadily pursued a series of measures Concerning the exchange rate, Bank Indonesia steadily pursued a series of measures Concerning the exchange rate, Bank Indonesia steadily pursued a series of measures to maintain stability in the rupiah.
to maintain stability in the rupiah. to maintain stability in the rupiah. to maintain stability in the rupiah.
to maintain stability in the rupiah. Key actions focused on implementation of prudent monetary policy and consistent sterilisation of the exchange rate to prevent excessive volatility by maintaining international reserves at a level commensurate to the fundamental needs of the economy. Other actions in support of this policy included a revamped communications strategy, improved effectiveness in prudential regulations and continual monitoring of forex payments.
Interest Rates
In Q3/2008, the 75 bps increase in the BI Rate to 9.25% at end-September 2008 In Q3/2008, the 75 bps increase in the BI Rate to 9.25% at end-September 2008 In Q3/2008, the 75 bps increase in the BI Rate to 9.25% at end-September 2008 In Q3/2008, the 75 bps increase in the BI Rate to 9.25% at end-September 2008 In Q3/2008, the 75 bps increase in the BI Rate to 9.25% at end-September 2008 was reflected in stable movement in overnight money market rates at around the was reflected in stable movement in overnight money market rates at around the was ref