QSAR STUDY OF INSECTICIDES OF PHTHALAMIDE DERIVATIVES
USING MULTIPLE LINEAR REGRESSION AND ARTIFICIAL NEURAL NETWORK METHODS
Adi Syahputra
1,*, Mudasir
1,2, Nuryono
2, Anifuddin Aziz
3, and Iqmal Tahir
1,21
Austrian-Indonesian Centre (AIC) for Computational Chemistry, Universitas Gadjah Mada, Sekip Utara Yogyakarta 55281, Indonesia
2
Department of Chemistry, Faculty of Mathematics and Natural Sciences, Universitas Gadjah Mada, Sekip Utara, Yogyakarta 55281, Indonesia
3
Computer Sciences Study Program, Faculty of Mathematics and Natural Sciences, Universitas Gadjah Mada, Sekip Utara, Yogyakarta 55281, Indonesia
Received December 10, 2013; Accepted March 26, 2014
ABSTRACT
Quantitative structure activity relationship (QSAR) for 21 insecticides of phthalamides containing hydrazone (PCH) was studied using multiple linear regression (MLR), principle component regression (PCR) and artificial neural network (ANN). Five descriptors were included in the model for MLR and ANN analysis, and five latent variables obtained from principle component analysis (PCA) were used in PCR analysis. Calculation of descriptors was performed using semi-empirical PM6 method. ANN analysis was found to be superior statistical technique compared to the other methods and gave a good correlation between descriptors and activity (r2= 0.84). Based on the obtained model, we have successfully designed some new insecticides with higher predicted activity than those of previously synthesized compounds, e.g. 2-(decalinecarbamoyl)-5-chloro-N’-((5-methylthiophen-2-yl)methylene) benzohydrazide, 2-(decalinecarbamoyl)-5-chloro-N’-((thiophen-2-yl)-methylene) benzohydrazide and 2-(decaline carbamoyl)-N’-(4-fluorobenzylidene)-5-chlorobenzohydrazide with predicted log LC50 of 1.640, 1.672, and 1.769
respectively.
Keywords: QSAR; phathalamide; hydrazone; multiple linear regression; principle component regression; artificial neural network
ABSTRAK
Telah dilakukan kajian analisis Hubungan Kuantitatif Struktur Aktivitas (HKSA) insektisida baru turunan ftalamida yang mengandung hidrazon (FMH) menggunakan metode regresi multilinear (MLR), regresi komponen utama (PCR) dan jaringan syaraf tiruan (JST). Ada lima deskriptor yang masuk dalam model MLR dan JST, dan lima variabel laten yang diperoleh dari analisis PCA yang digunakan dalam analisis PCR. Perhitungan deskriptor dilakukan menggunakan metode semiempirik PM6. Hasil penelitian menunjukkan analisis JST merupakan metode statistik paling baik yang ditunjukkan oleh nilai koefisien korelasi deskriptor dan aktivitas yang relatif tinggi (r2= 0,84). Berdasarkan model yang diperoleh, telah dilakukan desain beberapa insektisida baru yang mempunyai aktivitas prediksi yang lebih tinggi dari senyawa yang telah disintesis sebelumnya yaitu (Dekalinkarbamoil)-5-kloro-N’-((5-metiltiopen-il)metilen)benzohidrazid, (Dekalinkarbamoil)-5-kloro-N’-((tiopen-yl)-metilen)benzohidrazid dan 2-(Dekalinkarbamoil)-N’-(4-fluorobenzilidin)-5-klorobenzohidrazid dengan nilai log LC50masing-masing sebesar 1,640,
1,672 dan 1,769.
Kata Kunci: HKSA; ftalamida; hidrazon; semiempirik; regresi multilinear; regresi komponen utama; jaringan syaraf tiruan
INTRODUCTION
Computational Chemistry has grown so rapidly in last two decades mainly due to its application in helping to design molecules in silico. Computational chemistry methods most widely used so far is the Quantitative Structure Activity Relationship (QSAR). This method is
Table 1.Insecticidal activities of PCH derivatives [4] Substituent type
Compound
Ar R
LC50
(mg/L) log LC50
1 2-chlorophenyl isopropyl 170.664 2.232
2 2-chlorophenyl cyclohexyl 148.396 2.171
3 2-fluorophenyl butyl 121.941 2.086
4 2-fluorophenyl cyclohexyl 276.113 2.441
5 4-fluorophenyl isopropyl 68.005 1.833
6 4-fluorophenyl butyl 309.938 2.491
7 4-(trifluoromethyl)phenyl butyl 130.043 2.114
8 4-hydroxyphenyl isopropyl 128.575 2.109
9 4-hydroxyphenyl cyclohexyl 244.229 2.388
10 2-furanyl isopropyl 161.476 2.208
11 2-furanyl butyl 234.069 2.369
12 2-furanyl cyclohexyl 221.334 2.345
13 2-methyl-5-furanyl isopropyl 121.636 2.085
14 2-methyl-5-furanyl cyclohexyl 271.415 2.434
15 2-thienyl isopropyl 70.515 1.848
16 2-thienyl butyl 124.039 2.094
17 2-thienyl cyclohexyl 113.217 2.054
18 3-methyl-2-thienyl isopropyl 124.447 2.095
19 3-methyl-2-thienyl cyclohexyl 58.903 1.770
20 5-methyl-2-thienyl isopropyl 76.178 1.882
21 5-chloro-3-methyl-1-phenyl-1H-pyrazol-4-yl cyclohexyl 266.287 2.425
Fig 1.Chemical structure of PCH
This method can be use to help in searching new insecticides with maximum activity against insect pest. Research to obtain a new insecticide is highly required with respect to the phenomenon of insecticide-resistant cases of insect pests [3]. One type of insecticide that has the potential to be developed is phthalamide derivatives containing hydrazone (PCH). This insecticide has been used against Myzus persicae [4]. Action mechanism of these compounds is similar to flubendiamide, which is active in the calcium release channel (ryanodine receptors, RyR) in insects [5] and has the impact on the modulation of of RyR on Ca2+pump [6]. The compound caused several symptoms such as gradual contraction, thickening and shortening of the insect body without convulsions immediately after treatment, which can be clearly distinguished from the symptoms caused by conventional insecticides [7].
In this study, QSAR model of phthalamide insecticides is derived from the data set of chemical
structure and biological activities using multiple linear regressions (MLR and PCR) as well as artificial neural network (ANN) methods. The best models obtained from these methods were used to predict the biological activity of new designed insecticides of PCH derivatives.
Specifically, the purpose of this study was to determine the physicochemical properties (descriptors) of the compounds that influence the insecticidal activity of PCH derivatives. The widely used calculation of descriptors is AM1 and PM3. In this study, we used semi-empirical PM6 method for the calculation of descriptors. This method was selected because of inadequate and the calculation is more accurate in terms of the core-core interactions and hydrogen bonding [8].
MATERIAL AND METHODS
Data Set
PMH derivatives insecticides were taken from literature [4]. Lethal concentration values, represented as LC50 were used as the dependent variable. The lethal concentration fifty (LC50) was expressed in milligram of toxicant per liter of body weight (see Table 1).
Instrumentation
Table 2.Statistical parameters of 10 selected QSAR models of PCH derivatives of training-set compounds
Model Descriptors n r r2 SE Fcal/Ftab
1 qC4, qN1, qC5, SA, Log P, qO1, qC2, MD, qC3, ELUMO,
qC6, qCl, qC1, qN3
16 0.997 0.995 0.062 0.054
2 qC4, qN1, qC5, SA, Log P, qO1, qC2, MD, qC3, ELUMO,
qC6, qCl, qN3
16 0.996 0.993 0.052 1.067
3 qC4, qN1, qC5, SA, Log P, qO1, qC2, MD, qC3, ELUMO,
qCl, qN3
16 0.994 0.988 0.053 2.436
4 qC4, qN1, qC5, SA, Log P, qO1, qC2, qC3, ELUMO, qCl,
qN3
16 0.987 0.974 0.068 2.329
5 qC4, qN1, qC5, SA, Log P, qO1, qC2, qC3, ELUMO, qN3 16 0.977 0.955 0.081 2.244
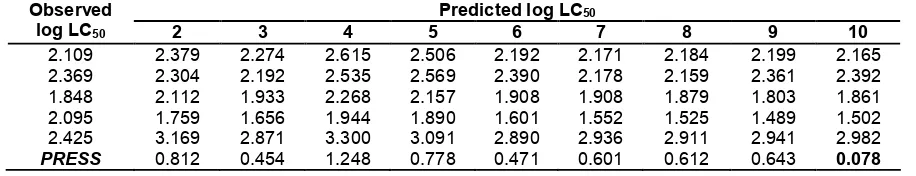
Table 3. Comparison between predicted and observed values of insecticidal activity for 5 compounds of test set calculated by 9 selected candidate QSAR models
Predicted log LC50
Observed
log LC50 2 3 4 5 6 7 8 9 10
2.109 2.379 2.274 2.615 2.506 2.192 2.171 2.184 2.199 2.165
2.369 2.304 2.192 2.535 2.569 2.390 2.178 2.159 2.361 2.392
1.848 2.112 1.933 2.268 2.157 1.908 1.908 1.879 1.803 1.861
2.095 1.759 1.656 1.944 1.890 1.601 1.552 1.525 1.489 1.502
2.425 3.169 2.871 3.300 3.091 2.890 2.936 2.911 2.941 2.982
PRESS 0.812 0.454 1.248 0.778 0.471 0.601 0.612 0.643 0.078 was used. The software programs extensively used in
this study were Gaussian® 09W, HyperChemTM 8.0.10, statistical programs IBM® SPSS® Version 19 and MATLAB 7.0.1.
Method
Calculation of descriptors
Descriptors used in this study were electronic parameters, e.g. atomic net-charge (q), moment dipole (μ), highest occupied molecular orbital (HOMO) and lowest unoccupied molecular orbital (LUMO) energy as well as molecular parameters, i.e. partition coefficient (log P), refractivity (R), polarizability, molecular weight (MW), surface area (SA), volume (V) and hydration energy (HE). Electronic parameters were taken from log file of the optimized structure of insecticides (Fig. 1) using semiempirical PM6 method within G09W package. Molecular parameters were calculated using Hyperchem package software.
Model development
Multiple linear regression.QSAR models derived from
MLR analysis was done by making regression analysis between descriptors and log LC50 directly using the backward method in SPSS version 19. Before analysis, the data were separated into training data and test data, consisting of 16 and 5 compounds, respectively. The
regression analysis was done according to the following linear equation:
Log LC50 = α + β1X1 + … + βiXi + ε (1)
Equation (1) represents the general QSAR equation model. The symbolαandβin the equations stand for a constant and fitting coefficient of corresponding descriptors (X), respectively andεis error.
Principle component regression. QSAR models in PCR analysis obtained by regressing insecticidal activity with latent variables resulting from Principle Component Analysis (PCA). PCA technique is useful in summarizing the information from the structure and also help in understanding the distribution of the compound. PCA analysis was evaluated using SPSS version 19. MLR between latent variables and log LC50 was conducted similar to MLR analysis process in equation (1).
Generation QSAR model using Artificial Neural network (ANN) analysis.ANN analysis was evaluated
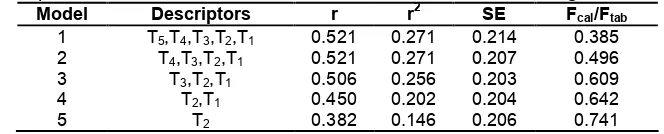
Table 4.Statistical parameters of 5 selected QSAR models of PCH derivatives generated by PCR analysis
(training-set compounds) were used. ANN models were designed and trained using these data. The training-set data were used in the ANN learning to recognize the relationship between input and output. Finally, the testing-set data consisting of five compounds were prepared to validate the obtained model from the ANN training before it was being applied to predict the activity of new designed insecticides.
Design of new compounds. The new compounds of PCH insecticides was designed with the guidance of the best QSAR model obtained to maximize activity of the designed compounds compared to those previously has been synthesized. In designing new compounds, we refer to the some synthesized compounds which experimentally have been proven to exhibit high activity, i.e. compounds number 5, 15, 19 and 20 in Table 1. The design of the new molecules was focused on altering substituentsRand Arand considering the availability of precursors/reagents so that the obtained new molecules will be possible to be synthesized in laboratory.
RESULT AND DISCUSSION
Multiple Linear Regression Analysis
To obtain the best QSAR model that correlates independence variables and dependence variable, multiple linear regression analysis using SPSS software has been performed. All variables were included in the model set-up. At the first step, all variables are included in the model and the less relevant variables were eliminated from the model by backward method automatically. This procedure finally gives 10 candidates of QSAR models as listed in Table 2. It is immediately emerged from Table 2, that all selected models show a good correlation (r≈ 0.9) between biological activity and
selected descriptors in the fitting process. Selection of models are based on the statistical parameters such as correlation coefficient (r), coefficient of determination (r2), the calculation error (SE) and significance of the model (Fcal/Ftab). It is clearly shown that one of the ten candidate models have value of Fcal/Ftab less than 1, therefore the model is automatically rejected and does not included in the model validation.
Further selection of the model is done by looking at the ability of the model to predict the activity of five test compounds, i.e. insecticide compounds which are not
included in the model building. The best model is chosen from those giving predictive activity close to the insecticidal activity of experimental results as shown by their PRESS(predictive residual sum of square) given in Table 3. Based on the value of the PRESS, it is evidenced that model-10 gives the smallest PRESS
value; therefore this model is finally selected as the best MLR QSAR model.
Principle Component Regression Analysis
In this study, PCA method is used to obtain the latent variables from all possible original descriptors/variables, e.g. electronic and molecular variables, for 21 compounds of PCH derivatives prior to PCR analysis using SPSS. From PCA analysis, five components of the matrix (latent variables) are obtained, giving total information of representation variants as much as 90.313%. The percentage contribution of each component to the total information of representation variants is 37.981; 22.309; 16.295; 8.302 and 5.426 for the components F1, F2, F3, F4 and F5, respectively.
By using latent variables, QSAR models has been generated using PCR analysis that correlate independence variables (five latent variables) and dependence variable (log LC50) within SPSS software package. At the beginning, all latent variables are included in the model and then the variables which have weak correlation with insecticidal activity will be gradually excluded from the model by backward method. From the PCR analysis, five models were obtained as listed in Table 4. However, no single model is satisfied from the statistical points of view because the correlation coefficient (r) between log LC50 and activity is considerably small (<0.521) and furthermore, the significance of the five models is also very low, i.e. less than 95% as can be seen from their Fcal/Ftabvalues which are lower than unity. Thus, all PCR QSAR models are not adequate and automatically eliminated for further model validation.
Artificial Neural Network Analysis
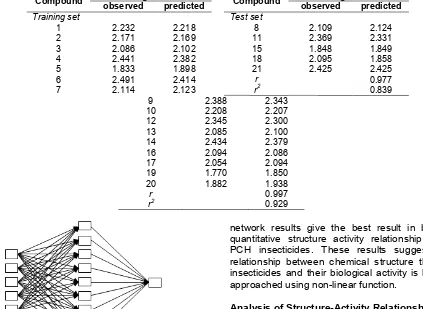
Table 5.Comparison between predicted and observed values of insecticide activity obtained from ANN analysis
log LC50 log LC50
Compound
observed predicted Compound observed predicted
Training set Test set
1 2.232 2.218 8 2.109 2.124
2 2.171 2.169 11 2.369 2.331
3 2.086 2.102 15 1.848 1.849
4 2.441 2.382 18 2.095 1.858
5 1.833 1.898 21 2.425 2.425
6 2.491 2.414 r 0.977
7 2.114 2.123 r2 0.839
9 2.388 2.343
10 2.208 2.207
12 2.345 2.300
13 2.085 2.100
14 2.434 2.379
16 2.094 2.086
17 2.054 2.094
19 1.770 1.850
20 1.882 1.938
r 0.997
r2 0.929
Fig 2. The best ANNs architecture (5-9-1)
previous MLR analysis as an input. The training set of data is needed in ANN to help the system learn and recognize the relationship between the input and output data. Similar to those used in MLR and PCR analysis, five compounds of insecticides are randomly separated and used as testing-set compounds to validate the ANN model prior to the application of the network in predicting the activity of new designed insecticides.
From the ANN analysis, it is revealed that the best architecture of neural network is 5-9-1 pattern as illustrated in Fig. 2 with optimum learning rate of 0.2 and 5000 iterations operated on Matlab 7.0.1 for WindowsTM. Results of ANN analysis indicates a strong relationship between descriptors and log LC50. The plot of observed and calculated values for the training and test set of insecticide compounds has linear regression coefficient (r) of 0.997 and 0.977 respectively as listed in Table 5. Clearly, it has been demonstrated that artificial neural
network results give the best result in building the quantitative structure activity relationship models of PCH insecticides. These results suggest that the relationship between chemical structure this class of insecticides and their biological activity is better to be approached using non-linear function.
Analysis of Structure-Activity Relationship
Table 6.Comparison between observed and predicted values of insecticide activity calculated by selected model of MLR and ANN together with their values of 2
_
pred r and 2 m
r
Predicted log LC50
Observed
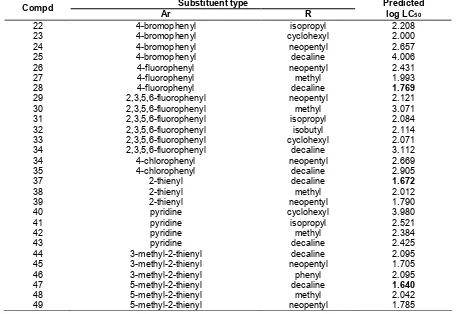
Table 7.New designed PCH insecticide molecules and predicted log LC50calculated using the best QSAR model Substituent type
Compd
Ar R
Predicted log LC50
22 4-bromophenyl isopropyl 2.208
23 4-bromophenyl cyclohexyl 2.000
24 4-bromophenyl neopentyl 2.657
25 4-bromophenyl decaline 4.006
26 4-fluorophenyl neopentyl 2.431
27 4-fluorophenyl methyl 1.993
28 4-fluorophenyl decaline 1.769
29 2,3,5,6-fluorophenyl neopentyl 2.121
30 2,3,5,6-fluorophenyl methyl 3.071
31 2,3,5,6-fluorophenyl isopropyl 2.084
32 2,3,5,6-fluorophenyl isobutyl 2.114
33 2,3,5,6-fluorophenyl cyclohexyl 2.071
34 2,3,5,6-fluorophenyl decaline 3.112
34 4-chlorophenyl neopentyl 2.669
35 4-chlorophenyl decaline 2.905
37 2-thienyl decaline 1.672
38 2-thienyl methyl 2.012
39 2-thienyl neopentyl 1.790
40 pyridine cyclohexyl 3.980
41 pyridine isopropyl 2.521
42 pyridine methyl 2.384
43 pyridine decaline 2.425
44 3-methyl-2-thienyl decaline 2.095
45 3-methyl-2-thienyl neopentyl 1.705
46 3-methyl-2-thienyl phenyl 2.095
47 5-methyl-2-thienyl decaline 1.640
48 5-methyl-2-thienyl methyl 2.042
49 5-methyl-2-thienyl neopentyl 1.785
Model Validation
In this study, we need to compare the QSAR models obtained from MLR and ANN analysis in order to determine which one is the best model. The statistical parameters used for this purpose arepred_r2
and
r
m2. The pred_r2
parameter is determined on the basis of the following equation (2).
where yi, and y^i are respectively the experimental and
predicted activity of theith molecule in the test set.ymean
is the average activity of all molecules in the training set. The pred_r2 value of greater than 0.5 is an indicator of good external predictability [14].
The parameter rm2 is determined by the following equation (3).
where r2 and r02 respectively are the determination coefficient of the plot between the observed and predicted activities of the test set compounds calculated with and without intercept. In general,r2and
2 0
r would not differ significantly, and an 2
m
concluded that ANN QSAR model is the best model because it gives the statistical parameters ofpred_r2and
2
m
r higher than those of MLR method. Detailed results of
pred_r2 and rm2 calculation are presented at in Table 6. Based on these results, for further study, therefore, ANN QSAR model is used as guidance in designing new insecticide of the class.
Design of New Insecticide
The design of new insecticide of PCH derivatives has been done on the basis of the best QSAR model obtained and this equation model was then used to predict their activity. In designing the structure of the new insecticide molecule, R and Ar substituents attached to the main structure were modified so that the higher insecticide activity of the new designed molecule compared to that of the previously synthesized molecules was achieved.
For that purposes, R of electron donating substituent has been selected to examine the influence of electron distribution in the phenyl ring on insecticide activity. Furthermore, variation of substituent at this position will also influence the polarity of the molecule. On the other hand, replacing Ar substituent with electron withdrawing moeties is expected to give impact on the electronegativity of the compound, resulting in high activity of the molecule. Table 7 lists the detailed structure/substituent of new insecticide molecule that have been designed on the basis of the above assumption along with their predicted activity values calculated using the best QSAR model.
In this study, R has been replaced using more and less bulkier substituent to evaluate the effect of electron resonance and polarization on the insecticide activity. The evaluation was done by comparing the predicted log LC50values of the corresponding compounds. Results of the study show that there is a significant difference in the value of predicted log LC50 when R is varied and Ar substituent is kept the same. For example, compound number 47 where R is decaline, the bulkier substituent has predicted log LC50of 1.640 while compound 48 with R = methyl, less bulk substituent has predicted log LC50 of 2.042. This result indicates that bulkier substituent enhances electron resonance so that the electron is more distributed on the phenyl ring, resulting in the higher solubility of the compound.
The effect of electron withdrawing substituent at Ar position on the value of predicted activity has also been investigated. Replacement of fluorine atom with bromine where substitueny R kept constant has significant effect on their predicted activity due to the differences in their electronegativity. As clearly seen in Table 7, compound number 24 (Ar = bromophenyl) and 28 (Ar =
4-fluorophenyl) have predicted log LC50 of 4.006 and 1.769 respectively. This suggests that more electronegative substituent at Ar position increases the activity of the molecule.
CONCLUSION
It has been demonstrated that semi-empirical PM6 is good computational method for the calculation of descriptors in QSAR analysis of PCH derivatives such as electronic and hydrophobic parameters. From QSAR equation model, it is revealed that electronic and hydrophobic descriptors have significant contribution to the insecticidal activity. The existence of non-linear relationship between chemical structure and biological activity of PCH derivatives is indicated by the best statistical parameters of non-linear QSAR model generated by ANN analysis. It is, therefore, clearly shown that ANN analysis can be an alternative approach when the relationship between activity and descriptors could not be well fitted using the linear regression analysis. Based on the best QSAR model obtained, it has been designed some new insecticide compounds which have predicted insecticidal activities higher than those of the existing compounds. This new designed compounds are suggested to be further synthesized and then tested for their insecticidal activity in the laboratory.
ACKNOWLEDGEMENT
First Author thanks to Lembaga Pengelola Dana Pendidikan (LPDP), Ministry of Finance, The Republic of Indonesia for financial support.
REFERENCES
1. Mudasir, Tahir, I., and Putri, I.P.A.M., 2003,Indo. J. Chem., 3 (1), 39–47.
2. Mudasir, Wibowo, Y.M., and Pranowo, H.D., 2013,
Indo. J. Chem.,13 (1), 86–93.
3. Insecticide Resistance Action Committee, 2012,
47thMeeting of IRAC International, Indianapolis. 4. Liu, M., Wang, Y., Wangyang, W-Z., Liu, F., Cui,
Y-L., Duan, Y-S., Wang, M., Liu, S-Z., and Rui, C-H., 2010,J. Agric. Food Chem., 58 (11), 6858–6863. 5. Ebbinghaus-Kintscher, U., Lümmen, P., Raming,
K., Masaki, T., and Yasokawa, N., 2007,
Pflanzenschutz-Nachrichten Bayer, 60 (2), 117– 140.
6. Masaki, T., Yasokawa, N., Fujioka, S., Motoba, K., Tohnishi, M., and Hirooka, T., 2009,J. Pestic. Sci., 34 (1), 37–42.
and Hirooka, T., 2006, Mol. Pharmacol., 69 (5), 1733–1739.
8. Stewart, J.J.P., 2007,J. Mol. Model., 13 (12), 1173– 1213.
9. Hu, Y.H., and Jenq-Neng, H., 2002, Handbook of Neural Network Signal Processing, CRC Press, Florida.
10. Akamatsu, M., 2011, J. Agric. Food Chem., 59 (7), 2909–2917.
11. Abraham, D.J., 2003, Burger’s Medicinal Chemistry and Drug Discovery 6th ed., John Wiley & Sons, California.
12. Rekker, R.F., 1986, Lecture Course QSAR, Mid Cancer Training in Pharmacochemistry, Faculty of
Pharmacy UGM and Department of
Pharmacochemistry Vrise Universities, Yogyakarta. 13. Kubinyi, H., 1993, QSAR: Hansch Analysis and Related Approaches, VCH Verlagsgesellshaft, Weinhem.
14. Sahu, K.N., Sharma, M., Mourya, V., and Kohli, D.V., 2012,Acta Pol. Pharm., 69 (6), 1153–1165. 15. Hu, R., Doucet, J.P., Delamar, M., and Zhang, R.,
![Table 1. Insecticidal activities of PCH derivatives [4]](https://thumb-ap.123doks.com/thumbv2/123dok/872949.821057/2.595.89.522.117.373/table-insecticidal-activities-of-pch-derivatives.webp)