IJG Vol. 48 No.1, June 2016 (28 - 36) © 2016 Faculty of Geography UGM and he Indonesian Geographers Association
Urbanization and Condition of Urban Slums in India
Digambar Abaji Chimankar
Received: 24 10 2015 / Accepted: 15 01 2016 / Published online: 30 06 2016 © 2016 Faculty of Geography UGM and he Indonesian Geographers Association
Abstract he present paper attempted to study the urbanization in India and condition of urban slums in terms of water, sanitation, electricity, garbage collection and health care, and education which are supposed to be basic minimum needs for the slum dwellers. India is going through the process of rapid urbanization because of industrialization like other third world countries. he percent of urbanization increase from 27.8 percent in 2001 to 31.1 percent in 2011 census. he increase in the percentage of population in urban areas is because of natural growth, rural to urban migration and the reclassiication of village and towns. he share of the slum population in the total urban population of the country was 18.3 percent in 2001 while in 2011 it was 17.4 percent. he condition of urban slums in India is to be improved so as to make them better for living.
Abstrak Tulisan ini mencoba untuk mempelajari urbanisasi di India dan kondisi kumuh perkotaan dalam hal air, sani-tasi, listrik, pengumpulan sampah dan perawatan kesehatan, dan pendidikan yang seharusnya menjadi kebutuhan dasar minimum untuk penghuni kawasan kumuh. India akan melalui proses urbanisasi yang cepat karena industrialisasi seperti negara-negara dunia ketiga lainnya. he persen peningkatan urbanisasi dari 27,8 persen pada 2001-31,1 persen pada 2011 sensus. Peningkatan persentase penduduk di daerah perkotaan adalah karena pertumbuhan alami, pedesaan untuk migrasi perkotaan dan reklasiikasi desa dan kota-kota. Pangsa populasi kumuh di total penduduk perkotaan dari negara itu 18,3 persen pada tahun 2001, sementara pada tahun 2011 itu 17,4 persen. Kondisi kumuh perkotaan di India adalah untuk ditingkatkan sehingga membuat mereka lebih baik untuk hidup.
Keywords: Urbanization, Slum, Poverty, Migration, Health
Kata kunci: Urbanisasi, Area Kumuh, Kemiskinan, Migrasi, Kesehatan
1. Introduction
Urbanization is realized only when there is a higher rate of growth of urban population compared to rural population. he major components of population growth in any area are natural increase and migration. However, in case of urban population, area reclassiication and boundary changes of the urban areas also contribute to growth of urban population. Hence, urban population of any areal unit grows by natural increase, migration, reclassiication of settlement units and by boundary changes of cities and towns. Since 1950, the proportion of people working in developing country agriculture has declined by 20 to 30 per cent. he in-migrant urban poor have largely moved from the countryside to the cities voluntarily, in order to exploit actual or perceived economic opportunities. Opportunities manifest in part, due to the growing urban informal sector, which is most spectacularly visible in the many growing and large-sale informal and squatter settlements in urban centres [UN-Habitat, 2003]. In India around seventy percent population is living in rural area and mostly engaged in agriculture and related activities. In
Digambar Abaji Chimankar
Post Graduate Departmentof Population Studies, Fakir Mohan University, Nuapadhi Campus, Odisha, India Email: [email protected]
agricultural settings like India, rural to urban migration takes place because of crop failure, natural calamities and unemployment in rural area. he process of “Full urbanization”, which has already been completed in Europe and in North and most of South America, means that most new population growth will be absorbed by the cities of the developing world, which will double in size by 2030 [UN-Habitat, 2003] and India will not be exception to it.
of existing slums [UN-Habitat, 2003].
Nearly one billion people alive today – one in every six human beings – are slum dwellers, and that number is likely to double in the next thirty years, according to UN-habitat’s new publication he Challenge of Slums: Global Report on Human Settlements 2003. Unprecedented urban growth in the face of increasing poverty and social inequality, and a predicted increase in the number of people living in slums (to about 2 billion by 2030), mean that the United Nations Millennium Development goal to improve the lives of at least 100 million slum dwellers by 2020 should be considered the absolute bare minimum that the international community should aim for, according to the report to be released in October 2003. he locus of poverty is moving from the countryside to cities, in a process now recognized as the “urbanization of poverty.” he absolute number of poor and undernourished in urban areas is increasing, as are the numbers of urban poor who sufer from malnutrition, say the report’s authors [UN-Habitat, 2003b].
In India, slums have risen dramatically since 1947. here were main two reasons for slum development. One is Partition of India and the other is Industrial revolution ater independence. Before 1950 slums were predominantly found around the mills, factories etc. hey were mostly industrial workers in one room tenements. Health and Services provisions to these areas rose as main issues. Instead of going farther, the density of the slums started growing in and around the cities. From 1950 to1968 the number of slums increased to 18%, in the 1970s they had a huge surge and by 1980 slum dwellers were half of the entire city’s population [Joshua Arbury, 2006].
he present paper attempted to study the urbanization in India and condition of urban slums in terms of water, sanitation, electricity, garbage collection and health care, and education which are supposed to be basic minimum needs for the slum dwellers.
Deinitions and concepts used in India to measure urbanization
he study of urbanization is very much constrained by deinitional and conceptual problems. his is because of the fact that neither there is a uniform criterion to distinguish urban areas from rural areas nor there is a uniform deinition of “urban” in diferent countries of the world. Unlike other demographic phenomena such as `birth’ and `death’, there is no standard deinition of `urban’. Some countries of the world do recognize certain of their population aggregates (settlement units like village, towns, cities) as `urban’. Government of India, Registrar General Oice, Census, set the following criteria to be called as urban.
(a) Statutory status like municipal committee corporation/notiied area committee/cantonment board, estate oice, etc.
(b) In addition to these, those cases where there
is no local administration, the settlements are treated as urban only if they fulill all the following three conditions simultaneously:
(i) A population of more than 5000;
(ii) More than 75 per cent of the male working population is engaged in non-agricultural activities; and
(iii) Density of population is more than 400 persons per square km.
Apart from these, the outgrowths (OGs) of cities and towns have been treated as urban, as explained later under `Urban Agglomeration’. It may be noticed from the deinition that there are two distinct types of urban units, such as:
(i) Places which have come into existence by virtue of statutory notiications and are referred to by nomenclature adopted in the relevant notiication as municipal corporation, municipal board, cantonment board, notiied area committee, etc.; and
(ii) Places which are deined as urban because they satisfy the criterion (b) and are referred to as census towns or non-municipal towns (CT or NM).
An urban agglomeration, therefore, constitutes: (i) A city or a town with a continuous outgrowth, the outgrowth being outside the statutory limits but falling within the boundaries of the adjoining village or villages; or
(ii) Two or more adjoining towns with their outgrowths, if any, as in (i) above; or
(iii) A city and one or more adjoining towns with or without outgrowths all of which form a continuous spread.
Slum
As per UN Habitat a slum is characterized by lack of durable housing, insuicient living area, lack of access to clean water, inadequate sanitation and insecure tenure. In India, Under Section-3 of the Slum Area Improvement and Clearance Act, 1956, slums have been deined as mainly those residential areas where dwellings are in any respect unit for human habitation by reasons of dilapidation, overcrowding, faulty arrangements and designs of such buildings, narrowness or faulty arrangement of streets, lack of ventilation, light, sanitation facilities or any combination of these factors which are detrimental to safety, health and morals.
hree types of slums have been deined in Indian Census, namely, Notiied, Recognized and Identiied.
(i) All notiied areas in a town or city notiied as ‘Slum’ by State, Union territories Administration or Local Government under any Act including a ‘Slum Act’ may be considered as Notiied slums.
(iii) A compact area of at least 300 population or about 60-70 households of poorly built congested tenements, in unhygienic environment usually with inadequate infrastructure and lacking in proper sanitary and drinking water facilities. Such areas should be identiied personally by the Charge Oicer and also inspected by an oicer nominated by Directorate of Census Operations. his fact must be duly recorded in the charge register. Such areas may be considered as Identiied slums.
he National Sample survey Organization [NSSO, 2012] of Government of India, slum was deined as follows:
First, areas notiied as slums by the concerned municipalities, corporations, local bodies or development authorities were termed notiied slums and second, any compact settlement with a collection of poorly built tenements, mostly of temporary nature, crowded together, usually with inadequate sanitary and drinking water facilities in unhygienic conditions, was considered a slum by the survey, provided at least 20 households lived there. Such a settlement, if not a notiied slum, was called a non-notiied slum. (Note that while a non-notiied slum had to consist of at least 20 households, no such restriction was imposed in case of municipalities, corporations, local bodies or development authorities were termed notiied slums).
here were further continuing eforts to describe slums by Planning Commission of India. Ramanathan [2004] discussed the observation of the Working group on Slums which submitted its report to the Planning Commission in May 1998, are known by diferent names in diferent cities, but the characteristics remain the same i. e. dilapidated and informal housing structures, acute overcrowding, faulty alignment of streets, poor ventilation, inadequate lighting, paucity of drinking water, water- logging during rains, absence of toilet facilities and non-availability of basic physical and social services.”
here are regional diferences in the names by which slums are known in India. In Delhi, slums are commonly called ‘Jhuggi-Jhopadi’, whereas in Mumbai they are called ‘Jhopadpatti or Chawls’. Other names are ‘Ahatas’ in Kanpur, ‘Bustees’ in Kolkata, ‘Cheris’ in Chennai and ‘Keris’ in Bangalore. But physical characteristics in most of these slums are essentially the same. hey are usually clusters of hutments with dilapidated and inirm structure having common or no toilet facilities, sufering from lack of basic amenities, inadequate arrangements for drainage and disposal of solid wastes and garbage. he inadequacies make the living conditions in slums extremely suboptimal unhygienic and results in unusually higher incidence of air and water borne diseases for the dwellers. [GOI, 2013]
2.he Methods
he analysis procedure was primarily logical rather
than mathematical or statistical. To study the level and trends of urbanization census reports for various years as well as to look into the present condition of the slums NSSO report 2012 were used. he National Sample Survey Organization (NSSO) conducted an all-India survey of rural and urban areas of the country in the 69th round of NSS during July 2012 – December 2012. he report is based on information collected from 881 slums in 3832 urban blocks spread over the entire urban area of the country. According to NSSO an estimated total of 33,510 slums existed in the urban areas of India, of which 13,761 were notiied and 19,749 were non-notiied slums. he survey on slums is the ith all-India slum survey of NSSO and was conducted in a randomly selected sample of urban blocks spread over the entire geographical area of the country.
3. Result and Discussion
Levels and trends of urbanization in India
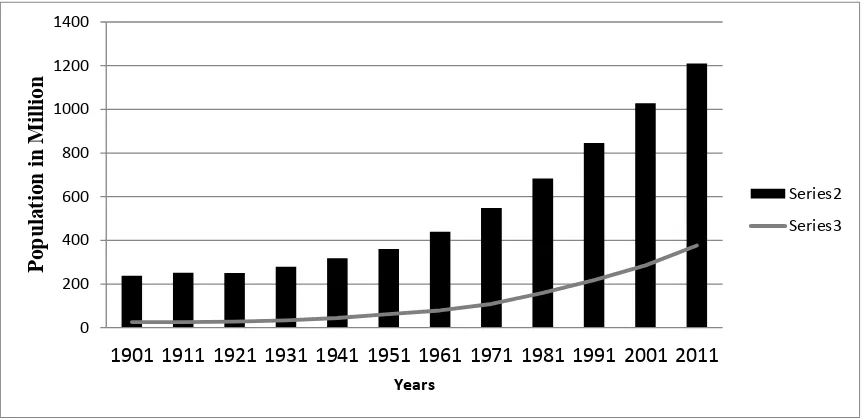
he percent of urbanization increase from 27.8 percent in 2001 to 31.1 percent in 2011 census (Figure 1). he increase in the percentage of population in urban areas is due to three important factors. he irst factors are the rural-urban diferential in natural growth, rural to urban migration and the reclassiication of village and towns. Regional disparities like level of poverty, unemployment and aspirations for improvement in the life lead in-migration to the urban centers. he level of fertility and mortality decides the city population. On the demand of the people some rural areas are declared as urban because of reclassiication of the village and towns. he increasing number of urban centers demands more space to accommodate the increased population. In the country he number towns increased from 4378 in 2001 to 7985 in 2011 while the number of metropolitan cities having million plus population has increased from 35 in 2001 to 53 in 2011 [Census, 2011]. he numbers of urban agglomerations / towns in India were 7935 as per the 2011 census. his comprised 4011 statutory towns and 3894 census towns, compared to the igures of 3799 and 1362 respectively at the 2001 census. he 7935 urban settlements in 2011 contained a population of 31 percent of the country’s total population of 1210 million. he number of urban dwellers in India accounted for about 10 per cent of the world and about 21 percent of the central Asia. he number of urban agglomerations/towns went up from 1916 in 1901 to 3060 in 1951. In the year 2001 it was 5161 and 7933 in 2011. he table1 shows the trends in total, rural and urban population in India along with level of urbanization over the period.
Slum population in India
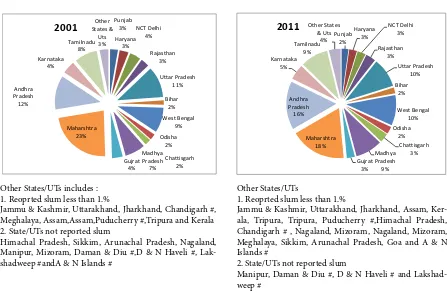
percent. he slum population of India in 2001were 52.37 million and urban population were 286.12 million and the slum population of India in 2011 were 65.49 million and urban population were 377.11 million. Higher productivity in the secondary/tertiary sector against primary sector makes cities and town centres of economic growth and jobs. Cities act as beacons for the rural population as they represent a higher standard of living and ofer opportunities to people not available in rural areas. his results in large scale migration from rural to urban areas. Negative consequences of urban pull results in upcoming of slums characterized by housing shortage and critical inadequacies in public
utilities, overcrowding, unhygienic conditions, etc. In 2011 census Total Number of Towns reported slums– 2613. Figure 2 shows the state share of slum population to total slum population of India.
Condition of slums in India
he NSSO survey comprised enquiries on location of slums, Drinking Water, Sanitation, Hygiene and Housing Condition of Urban Slums. It also throws light on approach road to the slum, distance from primary school and health center from the slums which are suppose to be the basic minimum needs for dwellers of any area irrespective rural urban settings.
Table 1. Total, Rural & Urban Population (in Million) & Level of Urbanization (in Percentage) in India 1901-2011
Year Total Rural Percentage No. of UAs/ Urban Percentage
Population Population (Rural) Towns Population (Urban)
1901 238.4 212.6 89.2 1917 25.8 10.8
1911 252.1 226.2 89.7 1907 25.9 10.3
1921 251.3 223.2 88.8 2047 28.1 11.2
1931 278.9 245.5 88 2219 33.4 12
1941 318.6 274.5 86.2 2424 44.1 13.9
1951 361.1 298.7 82.7 3059 62.4 17.3
1961 439.2 260.3 82 2699 78.9 18
1971 548.2 439.1 80.1 3126 109.1 19.9
1981** 683.3 523.8 76.7 3949 159.5 23.3
1991* 846.3 628.7 74.3 4615 217.6 25.7
2001 1028.6 742.5 72.2 5161 286.1 27.8
2011 1210.5 833.4 68.84 7933 377.1 31.2
Source: Registrar General of India, Census, 2011
** Includes projected population of Assam where 1981 census was not conducted.
*Includes projected population of Jammu & Kashmir where 1991 census was not conducted.
Figure 1. Levels and trends of total population and urban population growth in 1901-2011.
0 200 400 600 800 1000 1200 1400
1901 1911 1921 1931 1941 1951 1961 1971 1981 1991 2001 2011
P
o
p
u
la
ti
o
n
i
n
M
il
li
o
n
Years
Series2
Location and surrounding of slums
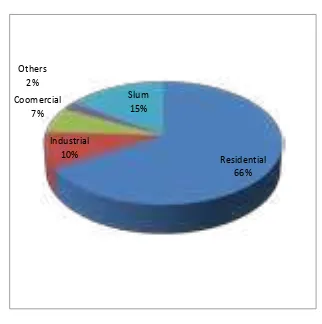
Generally poor people lives in the slums. Since they cannot purchase expensive land, they make their hut/ house along nallah/drain, along railway line, along river bank or river bed, on hilly terrain, or in parks and open spaces. At the all-India level about 30% of slums were located in open spaces or parks, 23% along nallahs or drains, and 9% along railway lines. hese proportions varied widely, across State and between notiied and non-notiied slums. It is shown with the help of igure 3 while igure 4 shows distribution of slums by type of area surrounding the slum. hey are surrounded by residential, industrial, or commercial area, slum area or other area. At all-India level 66% of slums are seen to be surrounded by residential areas, 15% by slum areas, and 10% by industrial areas.
Ownership of land and structure of the majority of houses
Figure 5 shows distribution of slums by type of ownership of the land on which the slum is situated, with three types of public land distinguished: railway land, land owned by local bodies and other public land. At all-India level 44% of slums are seen to be situated on private land, 37% on land owned by local bodies, 6% on railway land, and 12% on other public land. he poor in-migrant from rural areas or local poor could not be able to purchase land, so they might be using way to occupy government land or private land i.e. railway and local body land.
he igure 6 shows distribution of slums by type of structure of the majority of the houses in the slum: pucca, semipucca, serviceable katcha and unserviceable katcha. For all slums taken together, notiied and non-notiied, pucca structures predominated in nearly 60%, semi-pucca structures in 25%, and katcha structures in 15%. he number of pacca houses are more may be because of ongoing slum improvement programmes like Rajiv Housing Yojana and Jawaharlal Nehru urban Renewal Programme in the urban India.
Major source of drinking water
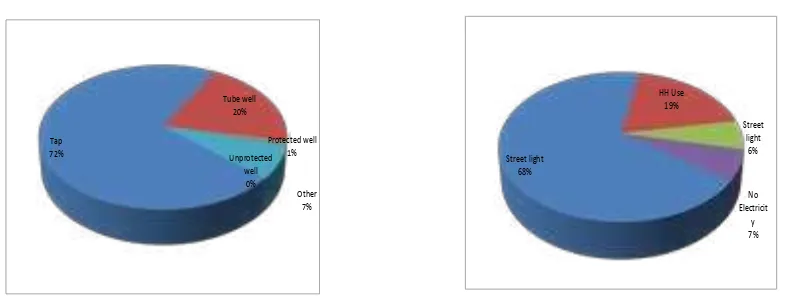
Figure 7 shows distribution of slums by major source of drinking water tap, tube well/ borehole, protected well, unprotected well and others. At all India level including all states, notiied and non-notiied slums 72 percent of the slums were using water from tap, 20 percent from tube well and 8 percent from other sources. he source of water to the slums is major cause of the various water borne diseases. So, potable and drinkable water is required for the dwellers of slums.
Status of electricity connection
Figure 8 shows distribution of slums by status of electricity connection. Slums surveyed were classiied into those having no electricity, those having electricity for street lights only, those having electricity for household use only, and those having electricity for both purposes. About 68% of slums at the all- India level had electricity both for household use and for street lights, 19% of all slums at the all-India level had
Figure 2. State share of slum population to total slum population of India. Source: Registrar General of India, Census, 2011
Punjab
Other States/UTs includes : 1. Reoprted slum less than 1.%
Jammu & Kashmir, Uttarakhand, Jharkhand, Chandigarh #, Meghalaya, Assam,Assam,Puducherry #,Tripura and Kerala 2. State/UTs not reported slum
Himachal Pradesh, Sikkim, Arunachal Pradesh, Nagaland, Manipur, Mizoram, Daman & Diu #,D & N Haveli #, Lak-shadweep #andA & N Islands #
Other States/UTs
1. Reoprted slum less than 1.%
Jammu & Kashmir, Uttarakhand, Jharkhand, Assam, Ker-ala, Tripura, Tripura, Puducherry #,Himachal Pradesh, Chandigarh # , Nagaland, Mizoram, Nagaland, Mizoram, Meghalaya, Sikkim, Arunachal Pradesh, Goa and A & N Islands #
2. State/UTs not reported slum
electricity for household use only while seven percent slums had no electricity connection.
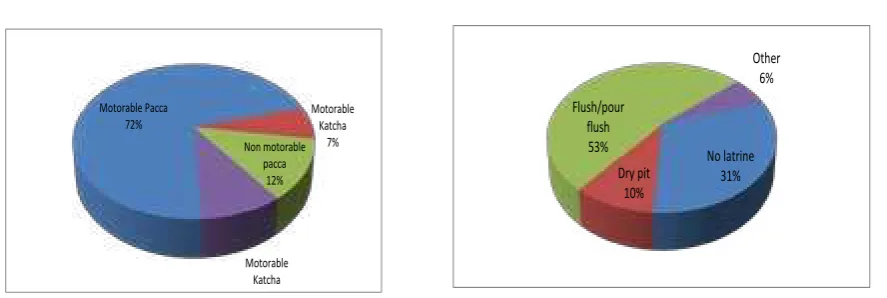
Type of approach road/ lane/constructed path to the slum
Figure 9 shows all India distribution of slums by type of approach road/ lane/ constructed path to the slum: motorable and pucca, motorable but katcha, non-motorable but pucca, and non-non-motorable and katcha At all-India level 72% of slums (including 78% of notiied and 67% of nonnotiied slums) had a pucca and motorable approach road/ lane/ constructed path to the slum, 12% had a pucca but non-motorable approach road, 7% had a motorable but katcha approach road, and 9% had a katcha and nonmotorable approach road.
Latrine facility used by most of the residents
Figure 10 shows all India level distribution of slums by (a) latrine type and (b) sharing system of latrine used by most of the residents. It is found that 31% of all slums taken together, no latrine was used by most of the
residents. Flush/ pour lush latrines were used by most of the residents in 53% of for all slums taken together. Dry pit latrines were used by most of the residents in about 10% of all slums. Figure 11 shows that about 25% of all slums, most residents used their own latrines. Public/community latrines were used by most of the residents in about 33% of all slums (without payment in 14% and with payment in 13%) and shared latrines in 6%.
Availability of drainage system type
Figure 12 shows distribution of slums by type of drainage system: underground, covered pucca, open pucca, open katcha, and no drainage system. An estimated 31% of slums – 11% of notiied and 45% of non-notiied slums – had no drainage system, that is, no system for carrying of waste water and liquid wastes of the slum. he open pucca drainage system prevailed in 35% of all slums. he covered pucca drainage system and the open katcha system were reported by about 8-9% slums at all India.
Figure 3. Per 1000 no. of slums located. Figure 4. Per 1000 no. of slums area surrounding.
Figure 5. Per1000 distribution of slums by type of own-ership of the land.
Figure 6. Per 1000 distribution of slums by type of
structure of the majority of houses. Source : NSSO, 2012, All India. Figures in the parentheses are No. of slums
along nallha/drain
23%
Along railway line 9% on river bank/ river bed
7% on hilly terrain/slope
4% in parks/
open spaces
30% elsewhere 27%
Residential 66% Industrial
10% Coomercial
7% Others 2%
Slum 15%
Private 44%
Railway 6% local bodies
37% other public 12%
Not known 1%
Pucca 60% Semi-pacca
25% Serviceable
Katcha 9%
Unserviceab le Katcha
Garbage disposal arrangement and frequency of gar-bage disposal
Figure 13 shows all India distribution of slums by arrangement for garbage disposal: arrangement by municipality/corporation, arrangement by residents, and arrangement by other agencies. In 27% of all slums in– there was no arrangement of garbage disposal. he municipality/corporation had arranged for garbage disposal in 62% of all slums. he residents had arranged for garbage disposal on their own was 11 percent at all India.
Figure 14 shows distribution of slums having a garbage disposal arrangement by frequency of garbage disposal. Daily garbage collection was reported by 57% of the slums at all India. Around 17% reported a “once in 3 to 7 days” frequency of collection of garbage. Once in 8-15 days garbage collection in 19 percent slums in India.
Distance from nearest government primary school and hospital/ health centre
Figure 15 shows All India distribution of slums by distance from the nearest government primary school. At the all-India level about 59% of both notiied and non-notiied slums were within half a kilometre of a government primary school and within 1 kilometre, 29 percent slums. his is very positive sign that primary school education is to the doorstep of slum dwellers.
Figure 16 shows All India distribution of slums by distance from the nearest government hospital/ health centre. All-India level about 20% of both notiied and non-notiied slums were within half a kilometre of a government hospital/ health centre. he proportion of slums more than 2 km away from a government hospital or health centre was 24 % and 12% proportion was more than 5 Kilometer in India.
he rapid growth of urbanization started ater 1990s because of neo-liberal policies adopted by India. he economic development started because of industrialization in the urban centres during the
process of liberalization. Construction of bridges and over bridges, oice buildings, roads, and housing projects started as a result of foreign direct investment in India. he new urban settings attracted the rural skilled and unskilled workers. During the process of liberalization and industrialization skilled workers absorbed in the industries and unskilled workers absorbed in construction. here is no contradiction that in India living conditions in many urban slums are worse than these in the poorest rural areas of the country. he migrants who were already poor for which they migrated found railway tracks, government land and roadside and drain side land for their makeshit. It is very diicult on the behalf of the poor slum dwellers to purchase land to build house. Even they could not fulill basic minimum needs, like food, shelter and clothes, education of the children, it would be injustice to expect them that they would not live in the slums. Ultimately their living attributed to the slums unhealthy environment. Many of the most serious disease in cities are ‘environmental’ because they are transmitted through air, water, soil and food or though insect or animal vectors. he conception of people in areas where the provision water, sanitation, garbage collection and health care is inadequate creates the conditions where infectious and parasitic disease thrives and spread. Health and sanitation are two important components of primary health care system introduced by the world Health and Sanitation interventions around the world to determine what roles they have played in the past relative to other intervention strategies and the role they have to play in future control eforts. he link between sanitation and human health are well documented, the disproportionate and overlapping disease, care giving, education, and economic, social and dignity impacts are rarely captured together for women and girls living in urban informal settlements. Individuals Health and hygiene is largely dependent on adequate availability of drinking water and proper sanitation. here is therefore, a direct relationship between water, Figure 7. Per 1000 distribution of slums by major
source of drinking water.
Figure 8. Per 1000 distribution of slums by status of electricity connection.
Source : NSSO, 2012, All India. Figures in the parentheses are No. of slums
Tap 72%
Tube well 20%
Protected well 1% Unprotected
well 0%
Other 7%
Street light 68%
HH Use 19%
Street light
6%
No Electricit
sanitation, health, drainage system, disposal of garbage and education. According to (UN-Habitat) report, April 2007, India is a third world country that sufers from poverty, malnutrition, diseases, unhealthy conditions, and more in Indian slums. India alone is responsible for more deaths of children than any other country in the world. Due to the dramatic rise of slums ater India’s independence in 1947, its population has tripled (UN-Habitat, report, April 2007).
4. Conclusion
he rapid growth of densely populated, predominantly low income, residential areas in the cities constitutes a serious threat to health. So, drainage system of the slums must be repaired at priority level. I is seen that 72 percent of the slums were using water from tap, 20 percent from tube well and 8 percent from other sources. he source of water to the slums is major cause of the various water borne diseases. So, potable and drinkable water is required for the dwellers of slums. Infectious and gastro-intestinal diseases, oten termed `diseases of poverty’. he open pucca drainage system prevailed in 35% of all slums. he covered pucca drainage system and the open katcha system were reported by about 8-9% slums at all India. Chronic
degenerative diseases associated with poor living and working conditions. At the all-India level about 30% of slums were located in open spaces or parks, 23% along nallahs or drains, and 9% along railway lines. hese include respiratory infections as well as diseases due to nutritional deiciency, both of which are associated with poverty, overcrowding and poor environmental conditions.
he government and local authorities are faced with this problem which can be tackled only through the improvement of housing and residential environment, provision of basic amenities and of preventive health care; these require major investments which are beyond the capacity of local government authorities. Improvement of health in urban areas calls for a concerted efort by both health agencies and those working in areas of housing, planning, pollution control, education and public works. All-India level about 20% of both notiied and non-notiied slums were within half a kilometre of a government hospital/ health centre. he proportion of slums more than 2 km away from a government hospital or health centre was 24 % and 12% proportion was more than 5 Kilometer in India.
Figure 9. Per 1000 distribution of slums by type of
approach road/ lane/ constructed path to the slum.
Source : NSSO, 2012, All India. Figures in the parentheses are No. of slums
Figure 10. Per 1000 no. of slums where latrine used by most residents was of type
Figure 11. Per 1000 no. of slums where latrine shar-ing system used by most residents was of the type
Source : NSSO, 2012, All India. Figures in the parentheses are No. of slums
Motorable Pacca 72%
Motorable Katcha
7% Non motorable
pacca 12%
Motorable Katcha
9%
No latrine 31% Dry pit
10% Flush/pour
flush 53%
Other 6%
no latrine 42%
without payment 14% payment
13% shared
6%
owned
25% underground
19%
covered pacca
7% open pacca
35% open
katcha 8%
no drainage 31%
Figure 15. Per 1000 distribution of slums by distance from nearest government primary school.
Figure 16. Per 1000 distribution of slums by distance from nearest Government hospital/ health centre.
Source : NSSO, 2012, All India. Figures in the parentheses are No. of slums
<0.5 km 59% 0.5-1 km
29%
1-2 km 10% 2-5 km
2%
<0.5 km 20%
0.5-1 km 27% 1-2 km
17% 2-5 km
24% 5 km above
12%
he government of India is trying to improve the condition of slums through various programmes but investment should be increased for good results. Monitoring of the various slum development programmes is also required so as to get maximum output.
References
Government of India (2011). Primary Census Abstract
for Slum, Oice of the Registrar General & Census Commissioner, India.
Government of India (2013). State of slums in India.
A Statistical Compendium. Government of India.
Ministry of Housing and Urban Poverty Alleviation.
Government of India (2012).Urban Slums in India. NSS
69th Round. Report No. 561(69/0.21).
Joshua Arbury (2006). From Urban Sprawl to Compact
City, – An analysis of urban growth management in Auckland. (http://transportblog.co.nz/wp-content/ uploads/2009/06/thesis.pdf).
Ramanathan, U. (2004). Illegality and exclusion: Law
in the lives of slum dwellers. IELRC Working Paper
(2004-2). Geneva: International Environmental
Law Research Centre.
UN-Habitat (2003). he Challenge of Slums: Global
Report on Human Settlements. London: Earthscan
Publications Ltd.
UN-Habitat report (2007). Slum Dwellers to double
by 2030: United Nations Human Settlements Programme.
UN-Habitat (2003b). Slums of the world: the face of
urban poverty in the new millennium? Working Paper.
he National Sample survey Organization (NSSO) [2012]. Government of India. no Report 561. Figure 13. Per 1000 distribution of slums by
arrange-ment of garbage disposal.
Figure 14. Per 1000 distribution of slums by frequency of garbage collection.
Source : NSSO, 2012, All India. Figures in the parentheses are No. of slums
Municipality/cor poration
62% Residents/other
11% No arreangement
27%
Daily 57% 3-7 days
17%
8-15 days 19%