R E S E A R C H P A P E R
Linking customer loyalty to customer satisfaction and store
image: a structural model for retail stores
Sam Thomas
Published online: 18 October 2013
ÓIndian Institute of Management Calcutta 2013
Abstract Customer loyalty has become a major concern for retail stores across the globe. A loyal customer is a source of competitive advantage through repeat purchase and positive word of mouth. India is on the verge of a retail revolution with the government planning to allow the entry of foreign retail giants to set up shops in India. The specific objective of this research was to develop an empirical model linking customer loyalty to customer satisfaction and store image. Based on the data collected from customers with leading supermarkets in India, a structural model was developed explaining 76.2 % of the variance in the customer loyalty. The study validated the mea-surement model of customer satisfaction and studied its impact on customer loyalty. The store image was also seen to have a positive impact on customer loyalty through the mediating variable customer satisfaction. Keywords Customer satisfactionCustomer
loyaltyStore imageRetail storesIndia
Structural equation models
Introduction
The landscape of the retail industry has changed across the globe. In line with the changing global economy and shifting consumer demand, retailers’ operating models have come under severe competitive pres-sures. As markets evolve, retailers adjust their formats and operational strategies to cater to changing shopper needs and trends-and thereby maximize their reach in an evolving market. As retailers have focused on creating a range of successful retail formats, consum-ers themselves have become much more sensitive and conservative in their buying, particularly in the more advanced economies.
The retail scenario across the globe is changing with developing countries like India joining the retail revolution. The origins of retailing in India can be traced back to the emergence of Kirana stores and mom-and-pop stores. In line with the change of tastes and preferences of the consumers, the industry started becoming more organized. Retail outlets such as Foodworld in FMCG, Planet M and Musicworld in Music, Crossword in books entered the market before 1995. Shopping malls emerged in the urban areas giving a world-class experience to the custom-ers. Eventually hypermarkets and supermarkets emerged across the country. The Indian retail industry has already become the fifth largest in the world and is expected to reach US$ 543.2 billion by 2014 (BMI India Retail Report). Major Indian corporate houses like TATAs, Reliance, RPG, and S. Thomas (&)
Birla have set up supermarket chains across the country.
The retail industry in India has some striking differences with its counter parts in many developed countries. First, India retail modernization is driven almost entirely by local retailers. This is major change from the cases where the global retailers act as key catalysts; and, in fact, capture the lion’s share of the modern trade. Second, changes in consumer trends have been the greatest influence in forcing modern trade to develop. Young working population, more nuclear families in urban areas and an increase in the number of working women have contributed signifi-cantly to this modern trade growth. Third, the rate of growth of organized retail in India has not been very exciting. The share of organized sector continues to be around 3 % only. Decline in consumer spending on discretionary goods, declining inventory turnover, crunch in working capital position and higher interest cost adversely affected the net profit margins resulting in store closures and employee lay-offs in the recent past.
All these factors present a fascinating opportunity for consumer researchers to study the factors driving customer loyalty in India. Indian consumers are supposed to have a primary affiliation to a ‘‘main store’’ (Rhee and Bell 2002) that captures the majority of their purchases though they may occa-sionally visit and purchase other stores. Being the first-choice store is important for retailers because, shoppers tend to spend twice as much in the main store as in others (Knox and Denison 2000). This has led to many conventional grocery stores operate under a supermarket format offering a full line of groceries. These stores offer a host of informative and cost benefit alternatives for consumers. Based on promises of receiving better value elsewhere, customers are often willing to switch from their current primary stores.
There is a plethora of studies on customer retention in retailing. Retailers systematically seek information on customer experience and then plan to build customer loyalty based on augmented services (Taher et al.1996; Sirohi et al.1998). Reichheld and Sasser (1990) assert that increased rates of retention lead to increased profitability. The strength of loyalty of customers to a store is an important indicator of store health (Rhee and Bell 2002). Knox and Denison (2000) highlighted the importance of developing a
corporate retail strategy to manage customer loyalty and prevent shoppers from switching stores.
Most of the studies on retail sector are reported from developed countries. There is a dearth of research in retail industry documenting perceptions of consumers from emerging economies like India. This is a major limitation of the research in this domain. The validity of the findings and theories on customer satisfaction and customer loyalty needs to be tested in different environments in order to assess their universal applicability. Another important aspect to be studied with respect to Indian customers would be the impact of store image on customer loyalty. The findings will be of interest with global giants like Tesco, Wal-Mart, and Metro AG set to enter the organized retail sector in India.
This research focuses on exploring the linkages among customer satisfaction, store image, and cus-tomer loyalty for Indian shoppers. The key research tasks include
Validate the measure of customer satisfaction with respect to retail customers in India
Explore the relationship between customer satis-faction and customer loyalty
Analyze the role of store image in the satisfaction– loyalty linkage
First, the pertinent literature with respect to customer satisfaction, store image, and customer loyalty are presented. Research model and research methods are discussed including a description of the survey process and the data collection instrument. The proposed measurement model of customer satisfaction is vali-dated through Confirmatory factor Analysis. A struc-tural model linking satisfaction and store image to loyalty is tested with structural equation modeling (SEM). Finally, research findings and a discussion of the results are presented.
Literature review and research model
Customer satisfaction
Customer satisfaction frameworks have been very popular among researchers. (Oliver 1997; Giese and Cote 2000; Weirs-Jenssen et al. 2002). Despite the abundance of literature on customer satisfaction, Giese and Cote (2000) acknowledge that a generally accepted definition of customer satisfaction has not been established. Satisfaction may be defined as the perception of pleasurable fulfillment of a service (Oliver1997) which can be assessed as the sum of the satisfactions with various attributes of a product or service (Churchill and Surprenant1982). A number of studies have identified determinants of customer satisfaction. These include ease of obtaining informa-tion (Oliva et al. 1992), attribute level performance (Oliva et al.1992), prior experience (Bolton and Drew 1991), and search time in choosing the service (Anderson and Sullivan1993).
Customer satisfaction could be studied in the context of shopping experience in a retail store. Giese and Cote’s (2000) looks at customer satisfaction as post-purchase/post-consumption response to a previ-ous purchase/consumption experience. Individual customers have different motivations for shopping like daily routine, learning about new products, or enjoyment of bargaining (Tauber1972). These differ-ences mean that they will derive satisfaction from diverse aspects of the shopping experience (Clottey et al.2008)
There is no consensus concerning the measurement of the construct of satisfaction in retail context but different approaches are popular. Research has histor-ically shown that store attributes, such as quality, price, and variety affect customer satisfaction (Doyle and Fenwick1974–1975; Clottey et al.2008). Ander-son et al. (1994) indicate that the literature is not very clear about the distinction between quality and satisfaction. Satisfaction is a post-consumption expe-rience which compares perceived quality with expected quality (Anderson et al.1994; Parasuraman et al.1985). The literature mainly looks at quality as one of the antecedents to satisfaction (Bolton and Drew1994; Anderson et al.1994).
This research used the Clottey et al. (2008) model of customer satisfaction with respect to retail stores in terms of four antecedent store attributes: price, product assortment, product quality, and store service. This model is in line with literature (Dick and Basu1994;
Anderson et al.1994; Iacobucci et al.1995; Rust and Oliver 1994). The effect of important attributes like store location was neutralized through proper sampling.
Price
The price image of a store affects store choice and store patronage (Cox and Cox 1990; Desai and Talukdar 2003). The high importance supermarket shoppers attach to low prices in store selection is demonstrated in many international studies. (Arnold et al.1983; Miranda et al.2005).
Product assortment
Availability of a range of product influences a shopper’s perception of a store (van Herpen and Pieters 2002) which in turn affects satisfaction and store choice (Hoch et al. 1999). Arnold et al. (1983) study on supermarket shoppers ranked product variety third behind location and price as determinants of store patronage.
Product quality
The importance of product quality as a factor with positive impact on satisfaction was shown by many researchers (Baltas and Papastathopoulou 2003; Go-mez et al.2004).
Service
The attitude of the store staff and how they treat customers play a major role in ensuring shopper satisfaction (Gagliano and Hathcote1994). This may be less true for discount stores where price overweigh other factors (Lumpkin and McConkey 1984). But knowledgeable and courteous sales staff is a strong determinant of store satisfaction and store patronage (King and Ring 1980). Brown (2001) found that customers who shop small grocery chains placed greater importance on service quality than patrons of large grocery store chains.
Store image
associated with, and what may be supposed to get when buying the products or using the services of the firm (MacMillan et al.2005; Schuler2004; Weiss et al. 1999). Organizations work hard to build the brand image of their firm and its goods and services. They use advertising and sales attempts to create a favorable image of the store among the mind of the customer. Garton (1995) suggested store chains should try to make consumer’s self image and the consumer’s image of the store to be as similar as possible. According to Sirgy (1985), individuals use goods and services, including shopping behavior patterns, to construct and maintain their social images.
Customer loyalty
The customer loyalty is manifested in different ways including a commitment to re-buy or patronize a preferred product or service (Oliver1997; Reichheld and Sasser 1990; Dick and Basu 1994). Zeithaml (2000) states customer loyalty may be viewed as being either behavioral or attitudinal. The behavioral approach is that customers are loyal as long as they continue to buy and use a good or service (Woodside et al.1989; Parasuraman et al.1988; Zeithaml et al. 1996). Bloemer and Kasper (1995) argue that mere repurchase may be indicative of inertia and not loyalty. Reichheld (2003) states that behavioral loy-alty is best manifested in willingness to recommend and refer a friend or colleague to a particular good and/ or service. The attitudinal approach is that customers feel a sense of belonging or commitment to the good or service. Dick and Basu (1994) suggest that loyalty is evidenced both by a more favorable attitude toward a brand (as compared to other alternatives) and repeat patronage
Linkages among customer satisfaction, store image, and customer loyalty
There is increasing recognition that the ultimate objective of customer satisfaction measurement should be customer loyalty. Fornell et al. (1996) argues that high customer satisfaction will result in increased loyalty for the firm. Anderson et al. (1994) express the fear that if firms are not able to demon-strate a link between customer satisfaction and eco-nomic performance, then firms may abandon the focus
on customer satisfaction. Fornell et al. (1996) also offer some evidence of the linkage between customer satisfaction and loyalty. Anderson et al. (1994) point out that customer loyalty is determined to a large extent by customer satisfaction.
Satisfaction is positively associated with repur-chase intentions, likelihood of recommending a prod-uct or service, loyalty, and profitability (cf. Anderson et al. 1994; Anton 1996; Bitner 1992). Rust and Williams (1994) found that greater customer satisfac-tion resulted in a greater intent to repurchase. LaBar-bera and Mazursky (1983) found that satisfaction influences repurchase intentions. Dissatisfaction has been seen as a primary reason for customer defection or discontinuation of purchase Anton (1996).
Satisfaction has been shown to influence repur-chase, and work-of-mouth communication (Sivadas and Baker-Prewitt 2000); to be a good predictor of future purchase behavior (Kasper1988); to influence profit (Anderson et al.1994); and, in the long run, to lead to customer loyalty (Oliver1997).
Mitchell and Kiral (1998) has reviewed many studies on relationship between the store attributes and store loyalty. Zeithaml et al. (1996) and Zeithaml (2000) showed that perceived service quality influ-ences customer behavioral intentions such as the intention to make repeat purchases. Ranaweera and Neely (2003) found that perceptions of service quality had a direct linear relationship with customer reten-tion. Anderson and Mittal (2000) showed that the level of product quality influences whether a customer would recommend the firm‘s product via word-of-mouth advertising.
Smith and Wright (2004) used brand image, product quality, service quality, and firm viability in their structural equation model as direct determinants of customer loyalty. The importance of brand image and product quality is also supported by the results of Hee-Su and Yoon (2004) who found that service quality, product quality and features, and brand image were the variables that had significant (positive) effects on customer loyalty.
based on perceived store attributes (Newman and Cullen2001).
Huber et al. (2001) developed structural equation model confirming a statistically significant direct link between brand image and customer loyalty.
The research model
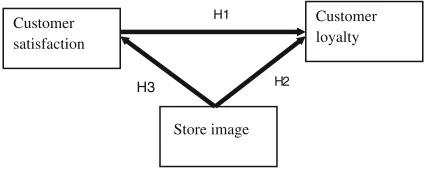
Based on the arguments presented, the following research model (Fig.1) is proposed linking customer satisfaction, store image, and customer loyalty. The model has customer satisfaction and store image proposed as antecedents to the dependent variable customer loyalty. The role of satisfaction as a medi-ating variable between store image and loyalty is also studied. The researcher proposes the following hypotheses on the relationship among these constructs (Fig.1).
H1 Higher the customer satisfaction, higher will be the customer loyalty.
H2 Higher the store image, higher will be the customer loyalty.
H3 Higher the store image, higher will be the customer satisfaction.
Research methods
The study is designed as an explanatory study using survey method. Data is collected by administering a structured questionnaire. Respondents were adult grocery shoppers residing in a posh residential locality in Cochin, the largest city in the state of Kerala in India. The locality has close to 10 leading supermarket chains operating within a radius of 1 km. The
respondents were approached as they were leaving the store after completing their purchase.
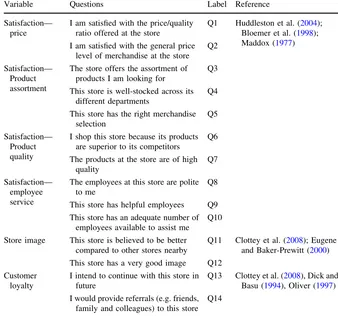
The questionnaire had an opening section about the demographic details of the respondents like gender, age, monthly income, etc. The next section had questions relating to customer loyalty, store image, and customer satisfaction dimensions namely, price, product assortment, product quality, and store service. The study used validated instruments developed by previous researchers to measure these constructs. Table 1shows the items used for measuring different variables with references to previous research. Partic-ipants were asked to indicate their agreement with these 14 statements on a five-point Likert scale (where 1 equals strongly disagree and 5 equals strongly agree). The final sample of 334 was made up of 136 males and 198 females from a range of occupations and aged between 18 and 75.
Data analysis
The data analysis is split into two parts: (a) Validating the measurement models of the constructs under study, (b) Validating the structural model (Fig. 1) linking these constructs.
Structural equation modeling is a multivariate statistical methodology, which takes a confirmatory approach to the analysis of a structural theory. SEM provides researchers with the ability to accommodate multiple interrelated dependence relationships in a single model. Its closest analogy is multiple regression analysis, which can estimate a single relationship. But SEM can estimate many equations at once, and they can be interrelated, meaning that the dependent variable in one equation can be an independent variable in other equations. This allows the researcher to model complex relationships that are not possible with other multivariate techniques (Hair et al.1998). Advantages of SEM compared to multiple regression include more flexible assumptions (particularly allow-ing interpretation even in the face of multi-collinear-ity), use of confirmatory factor analysis (CFA) to reduce measurement error by having multiple indica-tors per latent variable, graphical modeling interface, the desirability of testing models overall rather than coefficients individually, the ability to test models with multiple dependents, the ability to model medi-ating variables, the ability to model error terms, and Customer
satisfaction
Customer loyalty
Store image H1
H3 H2
the ability to handle difficult data (time series with autocorrelated error, non-normal data, incomplete data). AMOS 4.0, a leading SEM package, was used in this study.
The overall fit of a model in SEM can be assessed using a number of fit indices. There is broad consensus that no single measure of overall fit should be relied on exclusively and a variety of different indices should be consulted (Tanaka1993). The indices used include Chi square (v2), Goodness of Fit Index (GFI) (Joreskog and Sorbom 1989), Non-normed Fit Index (NNFI) (Bentler and Bonnett 1980), comparative fit index (CFI) (Bentler 1990), and root-mean-squared-residual (RMSR). Table2 shows major fit measures and guidelines for their acceptable values. The v2 fit statistic provides a statistical test of the null hypothesis that a predicted model fits the observed data (Hatcher 1994). It compares the correlation/covariance matrix that is predicted by a model with the values in the observed correlation/covariance matrix. If a proposed model is a good fit with the observed data then the value will
be small relative to the degrees of freedom in the model. A major drawback of the v2 statistic is its sensitivity to sample size. This is corrected through a modified fit statistic called the normed v2 fit measure. The goodness-of-fit index (GFI) is one of the most commonly reported measures of model fit. The GFI is a non-statistical measure that ranges in value from 0 (poor fit) to 1 (perfect fit). The CFI is another measure of overall goodness of fit that uses a v2 distribution. Bentler–Bonett Fit Index (NFI or TLI) is a good indicator of the convergent validity of the questionnaire. The RMSR is the square root of the mean of the squared residuals (the average of the residuals between observed and predicted input matrices) (Hair et al. 1998).
The models can also be evaluated based on the magnitude and the significance of the loading coeffi-cients. These loadings, or parameter estimates, are similar to the reliability measures between a set of indicators and the construct that they measure. The high magnitude and significance of the loadings would further validate the models.
Table 1 Major past research on these constructs are reviewed
Variable Questions Label Reference
Satisfaction— price
I am satisfied with the price/quality ratio offered at the store
Q1 Huddleston et al. (2004); Bloemer et al. (1998); Maddox (1977) I am satisfied with the general price
level of merchandise at the store Q2
Satisfaction— Product assortment
The store offers the assortment of products I am looking for
Q3
This store is well-stocked across its different departments
Q4
This store has the right merchandise selection
Q5
Satisfaction— Product quality
I shop this store because its products are superior to its competitors
Q6
The products at the store are of high quality
Q7
Satisfaction— employee service
The employees at this store are polite to me
Q8
This store has helpful employees Q9 This store has an adequate number of
employees available to assist me Q10
Store image This store is believed to be better compared to other stores nearby
Q11 Clottey et al. (2008); Eugene and Baker-Prewitt (2000) This store has a very good image Q12
Customer loyalty
I intend to continue with this store in future
Q13 Clottey et al. (2008), Dick and Basu (1994), Oliver (1997) I would provide referrals (e.g. friends,
The measurement models of the constructs
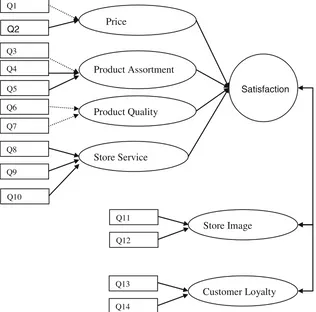
Confirmatory Factor Analysis, which is part of the SEM techniques, can be used to validate a measure-ment model that specifies the relationship between observed indicators and their underlying latent con-structs. The measurement model specifies how latent constructs are measured by the observed variables and
it assesses the construct validity and reliability of the observed variables (Joreskog and Sorbom1989). CFA is often used to confirm a model structure known beforehand as is the case with constructs in the study. The measurement models for customer loyalty, store image, and customer satisfaction are shown in Fig.2. The fit measures for the measurement models are also indicated. All the fit indices values show very good fit validating the measurement models. The loading coefficients of all the observed indicators onto the hypothesized dimensions were also seen to be high and significant at 1 % level further supporting the validity of the measurement models.
Structural model (research model)
The proposed research mode Fig. 1is now tested with SEM using AMOS4.0. The model makes an important assumption about the role of satisfaction variable as a Table 2 Major fit measures and guidelines for their acceptable
values
Indicators of fit Target values for very good fit
Target values for moderate fit
Normedv2 \3 \5
GFI [0.90 [0.80
AGFI [0.80 [0.70
RMSR \0.05 \0.10
RMSEA \0.05 \0.08
CFI [0.90 [0.80
Price
Product Assortment
Product Quality
Store Service
Satisfaction Q1
Q2
Q3
Q5 Q4
Q6
Q7
Q9 Q8
Q10
Store Image
Q12 Q11
Customer Loyalty Q14
Q13
Normed χ2= 1.6, GFI = 0.902, NFI = 0.902, CFI = 0.960, RMSR = 0.035
mediating variable between store image and loyalty. To validate this hypothesis, two variants of the research model are proposed. The first model called full model will check for both the direct and indirect effect of store image on customer loyalty. The second model called indirect model will not estimate the direct path linking store image to customer loyalty thereby assuming a strictly mediating relationship. In conducting a multi model analysis using AMOS the procedure suggested by Ho (2006) is used. The step involves (1) defining the full direct model and (2) defining the indirect model in which the direct path linking store image to loyalty is constrained to zero. Constraining paths to zero is equivalent to those paths not being estimated.
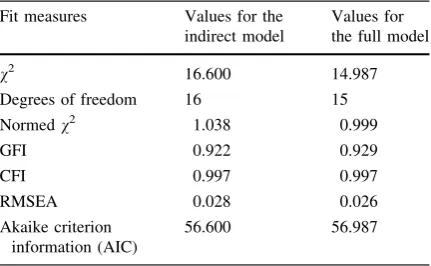
The fit measures of both the model variants are shown in Table3.
Both the models are fitting the data very well as the fit values in both cases are above the cutoffs for very good fit. In such cases where both models are nested (i.e., they are hierarchical models based on the same data set) and have different degrees of freedom, their goodness-of fit can be directly compared. Looking at the Nested Model Comparisons statistics in Table4, it can be seen that subtracting the indirect model’s v2 value from the full model’s v2 value (16.6–14.987) yields av2difference value of 1.613. With 1 degree of freedom (16–15), this statistic is not significant (p =0.204) at the 0.05 level, and hence indirect model is preferred. This argument is further supported by the Akaike Criterion Information (AIC) compari-son statistics. The indirect model yielded a lower AIC value (56.6) than the full model (56.99), which indicates that the indirect model is both better fitting and more parsimonious than the indirect model.
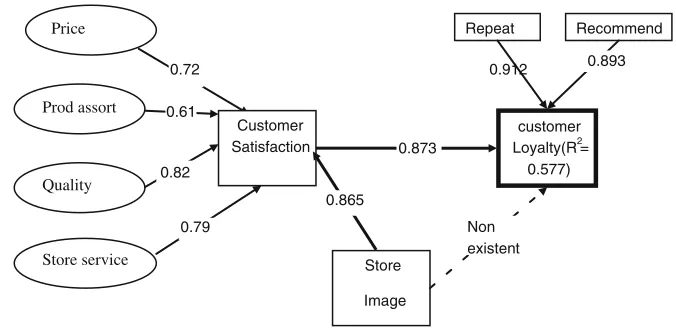
Again, in the full model, the loading coefficient on the direct path between image and loyalty is seen to be insignificant at 5 % level. Therefore, we conclude that although both models fitted the data relatively well, the indirect model represents a significantly better fit than the full model, and is to be accepted. Figure3 shows the final model with path loading coefficients significant at 0.05 level.
This model demonstrates the linkages among satisfaction, store image, and customer loyalty for customers of leading supermarket stores in India. This model explained 76.2 % of the variance in the customer loyalty through the effect of direct anteced-ent variable customer satisfaction and the indirect effect of the second variable, store image. There is a strong positive correlation between satisfaction score and the loyalty score thereby proving H1. This implies that the customer satisfaction is a major driver of loyalty. The store image had no direct correlation with customer loyalty disproving H2. But it correlates positively with customer satisfaction, and hence H3 is proved. The impact of store image on loyalty is indirect through the mediating variable satisfaction. But the indirect impact of image on loyalty is strong at 0.755 (0.865*0.873). This means that a customer who has a positive perception about the store is likely to feel more satisfied which in turn will make him/her more loyal. The dimensions of satisfaction also can be analyzed for their contribution to the satisfaction construct. All dimensions have significant loading onto the satisfaction construct and their order of importance can be read from the magnitude of loading coefficients.
Discussion and conclusion
The research proposed and validated a structural model linking customer satisfaction, store image, and loyalty for customers of retails stores. The study has limitations with respect to sampling, and hence the model can not be generalized across the globe. But Table 4 Nested model comparison
DF Chi square (v2) P
Indirect model 1 1.613 0.204
Table 3 Fit measures for the model variants
Fit measures Values for the indirect model
Values for the full model
v2 16.600 14.987
Degrees of freedom 16 15
Normedv2 1.038 0.999
GFI 0.922 0.929
CFI 0.997 0.997
RMSEA 0.028 0.026
Akaike criterion information (AIC)
findings from the study have great value for retail stores everywhere.
The study validated the dimensions of customer satisfaction namely price, product assortment, quality, and store service in the Indian context. The degree of influence of these variables varied. Quality was seen to be the major dimension of satisfaction closely fol-lowed by store service, price, and product assortment. This shows the changing attitude of the Indian upper middle class. Most of the Indian supermarket stores compete on price by selling below the label price. But the customers have more concern on the quality and store service dimensions. The fact that product assortment was not seen to be a major driver of satisfaction argues for the need for specialty stores in place of ‘‘jack of all trades’’ grocery stores.
Huddleston et al. (2004) study had shown price to be the major driver of satisfaction. This research threw up a different finding. But it supports the arguments of Gourville and Soman (2005) who felt that over choice may be counterproductive to winning over customers. Though customers often state they like variety, too much variety can confuse customers (Chernev2006). This finding on the product quality is similar to many of the previous studies (Lumpkin and McConkey 1984; King and Ring 1980). The results on the importance of store service dimension in also in line with the work of King and Ring (1980) who found that sales associates play a critical role in achieving customer patronage and satisfaction.
Satisfaction influences the likelihood of recom-mending retail store. It positively contributes to repurchase loyalty as well. But contrary to the hypothesis, the researcher did not find a direct linkage from brand image of the store and loyalty. But store
owners should still focus on reputation management and image building (Zabala et al.2005). The image of a store may have a lot to do for the attraction of customers. The fact that they are shopping from a reputed shop give them more pride which can translate into higher satisfaction and in turn contribute to enhanced loyalty.
The increased competition in the organized retail sector in India is conferring greater importance to the customer loyalty as a way to obtain competitive advantage. It is obvious that shoppers will be exposed to overtures from competing retailers which may result in some deciding to shift their allegiance to the competition. In that context, it is imperative for retailers to appreciate the strong linkages between customer satisfaction, store image, and loyalty. The stores which initiate appropriate measures to improve customer satisfaction will be in a better position to face successfully the new reality which will take shape in the near future.
References
Anderson E, Mittal V (2000) Strengthening the satisfaction-profit chain. J Serv Res 3:107–120
Anderson EW, Sullivan MW (1993) The antecedents and con-sequences of customer satisfaction. Mark Sci 12(Spring):125–143
Anderson EW, Fornell C, Lehmann DR (1994) Customer sat-isfaction, market share, and profitability: findings from Sweden. J Mark 58(3):53–66
Anton J (1996) Customer relationship management: making hard decisions with soft numbers. Prentice-Hall, Upper Saddle River, NJ
Arnold SJ, Oum TH, Tigert DJ (1983) Determinant attributes in retail patronage: seasonal, temporal, regional, and inter-national comparisons. J Mark Res 20:149–157
Quality
Store service Price
customer Loyalty(R2=
0.577) Prod assort
Store
Image 0.865
0.873
Non existent 0.79
0.61
0.912
0.82
Repeat Recommend
0.72 0.893
Customer Satisfaction Fig. 3 Measurements of
Baltas G, Papastathopoulou P (2003) Shopper characteristics, product and store choice criteria: a survey in the Greek grocery sector. Int J Retail Distribution Manag 31(10): 498–507
Bentler PM (1990) Comparative fit indexes in structural models. Psychol Bull 107(2):238–246
Bentler PM, Bonnett DG (1980) Significance tests and goodness of fit in the analysis of covariance structures. Psychol Bull 88:588–600
Bitner M (1992) Servicescapes: the impact of physical sur-roundings on customers and employees. J Mark 56(2):57–71
Bloemer JMM, Kasper, HDP (1995) The complex relationship between consumer satisfaction and brand loyalty. J Econ Psychol 16:311–329
Bloemer J, De Ruyter K, Peeters P (1998) Investigating drivers of bank loyalty, the complex relationship between image, service quality and satisfaction. Int J Bank Mark 16(7):276–286
Bolton RN, Drew JH (1991) A longitudinal analysis of the impact of service changes on customer attitudes. J Mark 55:1–9
Bolton RN, Drew JH (1994) Linking customer satisfaction to service operations and outcomes. In: Rust RT, Oliver RL (eds) Service quality: new directions in theory and practice. pp 173–200
Brown JD (2001) Segmentation correlates for small grocery chain preference. J Food Prod Mark 6(4):53–62
Chernev A (2006) Decision focus and consumer choice among assortments. J Consumer Res 33(1):50–59
Churchill GA Jr, Surprenant C (1982) An investigation into the determinants of customer satisfaction. J Mark Res 19(November):491–504
Clottey T, Collier D, Stodnick M (2008) Drivers of customer loyalty in a retail store environment. J Serv Sci 1(1):35–48 Cox AD, Cox D (1990) Competing on price: the role on retail
price in shaping store-price image. J Retail 66:428–445 Desai KK, Talukdar D (2003) Relationship between product
groups’ price perceptions, shopper’s basket size, and gro-cery store’s overall store price image. Psychol Mark 20(10):903–933
Dick AS, Basu K (1994) Customer loyalty: toward an integrated conceptual framework. J Acad Mark Sci 22(99–113):15p Doyle P, Fenwick I (1974–1975) How store image affects
shopping habits in grocery chains. J Retail 50(4):39–52 Eugene S, Baker-Prewitt JL (2000) An examination of the
relationship between service quality, customer satisfaction and store loyalty. Int J Retail Distribution Manag 28(2):73–82
Fornell C, Johnson MD, Anderson EW, Cha J, Bryant BE (1996) The American customer satisfaction index: nature, purpose and findings. J Mark 60:7–18
Gagliano KB, Hathcote J (1994) Customer expectations and perceptions of service quality in retail apparel specialty stores. J Serv Mark 8(1):60–70
Garton PA (1995) Store loyal? A view of ‘differential congru-ence’. Int J Retail Distribution Manag 23(12):29–35 Giese JL, Cote JA (2000) Defining consumer satisfaction.
Acad-emy of Marketing Science Review, vol 1, pp 1–24. ABI/ INFORM Global database (Document ID: 434042051). Accessed 20 May 2008
Gomez MI, McLaughlin EW, Wittink DR (2004) Customer satisfaction and retail sales performance: an empirical investigation. J Retail 80(4):265–278
Gourville JT, Soman D (2005) Overchoice and assortment type: when and why variety backfires. Mark Sci 24(3):382–395 Hair JF Jr, Anderson RE, Tatham RL, Black WC (1998) Mul-tivariate data analysis, 5th edn. Prentice Hall, Upper Saddle River
Hatcher L (1994) A step by step approach to using the SAS system for factor analysis and structural equation model-ling. SAS Institute Inc, Cary
Hee-Su K, Yoon CH (2004) Determinants of subscriber churn and customer loyalty in the Korean mobile telephony market. Telecommun Policy 28(10):751–765
Ho R (2006) A handbook of univariate and multivariate data analysis and interpretation with SPSS. Francis and Taylor, Boca Raton
Hoch SJ, Bradlow ET, Wansink B (1999) The variety of an assortment. Mark Sci 18(4):527–546
Huber F, Herrmann A, Wricke M (2001) Customer satisfaction as an antecedent of price acceptance: results of an empir-ical study. J Prod Brand Manag 10(3):160–169
Huddleston P, Whipple JM, van Auken A (2004) Food store loyalty: application of a consumer loyalty framework. J Target Meas Anal Mark 12(3):213–230
Iacobucci D, Ostrom A, Grayson K (1995) Distinguishing ser-vice quality and customer satisfaction: the voice of the consumer. J Consumer Psychol 4(3):277–303
Joreskog KG, Sorbom D (1989) LISREL 7: a guide to program and applications, 2nd edn. SPSS, Chicago
Kasper H (1988) On problem perception, dissatisfaction and brand loyalty. J Econ Psychol 9(3):387–397
Knox SD, Denison TJ (2000) Store loyalty: its impact on retail revenue: an empirical study of purchasing behaviour in the UK. J Retail Consumer Serv 7:33–45
King CW, Ring LJ (1980) Market positioning across retail fashion institutions: a comparative analysis of store types. J Retail 56(1):37–55
LaBarbera PA, Mazursky D (1983) A longitudinal assessment of consumer satisfaction, dissatisfaction: the dynamic aspect of cognitive process. J Mark Res 20:393–404 Lumpkin JR, McConkey CW (1984) Identifying determinants
of store choice of fashion shoppers. Akron Business Econ Rev 15(4):36–55
MacMillan K, Money K, Downing S, Hillenbrand C (2005) Reputation in relationships: measuring experiences, emo-tions and behaviors. Corp Reput Rev 8(2):214–232 Maddox RN (1977) Consumers’ satisfaction with supermarkets:
a factor analytic study. In: Day RL (ed) Consumer satis-faction, dissatisfaction and complaining behavior. Division of Research, School of Business, Indiana University, Bloomington, pp 163–166
Miranda MJ, Konya L, Havrila I (2005) Shoppers’ satisfaction levels are not the only key to store loyalty. Mark Intell Plan 23(2):220–232
Mitchell VW, Kiral RH (1998) Primary and secondary store-loyal customer perceptions of grocery retailers. British Food J 100(7):312–319
Oliva T, Oliver RL, MacMillan IC (1992) A catastrophe model for developing service satisfaction strategies. J Mark 56:83–95
Oliver RL (1997) Behavioral perspective on the consumer. McGraw-Hill, New York
Parasuraman A, Zeithaml V, Berry L (1985) A conceptual model of service quality and its implications for future research. J Mark 49(4):41–50
Parasuraman A, Zeithaml V, Berry L (1988) SERVQUAL: a multiple item scale for measuring customer perceptions of service quality. J Retail 64(1):12–40
Ranaweera C, Neely A (2003) Best student paper some mod-erating effects on the service quality-customer retention link. Int J Oper Prod Man 23:230–248
Reichheld FF (2003) The one number you need to grow. Harv Business Rev 485–491
Reichheld FF, Sasser WE Jr (1990) Zero defections: quality comes to services. Harv Business Rev 68(5):105–111 Rhee H, Bell DR (2002) The inter-store mobility of supermarket
shoppers. J Retail 78(4):225–237
Rust RT, Oliver RL (1994) Service quality: insights and man-agerial implications from the frontier. In: Rust RT, Oliver RL (eds) Service quality: new directions in theory and practice. Sage, California, pp 241–268
Rust RT, Williams DC (1994) How length of patronage affects the impact of customer satisfaction on repurchase inten-tion. J Consum Satisf Dissatisfaction Complain Behav 7:107–113
Schuler M (2004) Management of the organizational image: a method for organizational image configuration. Corp Reput Rev 7(1):37–53
Sirgy MJ (1985) Using self-conguity and ideal-congruity to predict purchase motivations. J Business Res 195–206 Sirohi N, McLaughlin EW, Wittink DR (1998) A model of
consumer perceptions and store loyalty intentions for a supermarket retailer. J Retail 74(2):223–245
Sivadas V, Baker-Prewitt JL (2000) An examination of the relationship between service quality, store satisfaction and store loyalty. Int J Retail Distribution Manag 28(2):74–82 Smith RE, Wright WF (2004) Determinants of customer loyalty and financial performance. J Manag Acc Res 16:p183– p205
Taher A, Leigh TW, French WA (1996) Augmented retail ser-vices: the lifetime value of affection. J Business Res 35(3):217–228
Tanaka JS (1993) Multifaceted conceptions of fit in structural equation models. In: Bollen KA, Long JS (eds) Testing structural equation models. Sage, Newbury Park Tauber EM (1972) Why do people shop? J Mark 36(4):46–49 van Herpen E, Pieters R (2002) Research note: the variety of an
assortment: an extension to the attribute-based approach. Mark Sci 21(3):331–341
Weirs-Jenssen J, Stensaker B, Grogaard JB (2002) Student Satisfaction: towards an empirical deconstruction of the concept. Quality High Education 8(2):183–196
Weiss AM, Anderson E, MacInnis DJ (1999) Reputation man-agement as a motivation or sales structure decisions. J Mark 63:74–89
Woodside AG, Frey LL, Daly RT (1989) Linking service quality, patientsatisfaction and behavioural intention. J Health Care Mark 7(March):61–68
Zabala I, Panadero G, Gallardo L, Amate C, Sanchez-Galindo M, Tena I, Villalba I (2005) Corporate reputation in pro-fessional services firms: reputation management based on intellectual capital management. Corp Reput Rev 8(1):59–71
Zeithaml VA (2000) Service quality, profitability, and the eco-nomic worth of customers: what we know and what we don’t know. J Acad Mark Sci 28(1):67–85