DYNAMIZATION PERFORMANCE OF THIRTEEN WHEAT GENOTYPES
DURING THREE PLANTING SEASON FOR ADAPTATION IN TROPICAL LOWLAND
Nugraheni Widyawati*), Theresa Dwi Kurniaand Djoko Murdono
Agriculture Faculty of Satya Wacana Christian University, Salatiga, Indonesia *) Corresponding author E-mail: [email protected]
Received: January 23, 2015/ Accepted: …
ABSTRACT
The successful development of wheat in several tropical highlands in Indonesia has prompted researchers to developing the wheat in the lowlands area. One of the ways is through the process of adaptation and selection of wheat genotypes which planted in lowlands. This research was conducted in the district of Semarang and Demak in the period of 2011 until 2014. The purpose of this research was to investigate the performance of wheat genotypes grown in the tropical lowlands in searching the candidates for adaptive varieties of tropical lowland. Thirteen wheat genotypes that tested in the lowlands were ‘LAJ3302/2*M088’, ‘Altar’, ‘Selayar’, ‘Oasis’, ’HP1744’, ‘RABE’, ’H-21’, ‘G-21’, ‘G-18’, ‘Menemen’, ‘Barisbey’, ‘Alibey’, ‘Dewata’. The experimental design used was Randomised Block Design, treated separately with 13 genotypes, each genotype repeated 3 times. The data were analyzed using Analysis of variance, Correlation, HSD 5% level and Stress Susceptibility Index. The results of this research were the genotypes LAJ3302/2*M088, Oasis and Selayar has been considered as candidate of wheat varieties which adaptive in tropical lowland because this genotypes are more tolerant than the other genotypes in lowland environment.
Keywords: adaptation, genotype, lowland, tropical, wheat
INTRODUCTION
The successful of wheat adaptation in tropical highlands has opened the knowledge and hopes that this plant could be adapted in the lowland tropical regions. In order to developing a tropical grain production, it is necessary to expand the area of wheat cultivation. Wheat cultivation in the highlands has been limited
because compete with the various types of horticultural crops as well as the limited area of the plateau in Indonesia. The area which is very wide to be utilized is the lowland tropical.
There is a serious problem if the wheat planted in lowland tropical area. The growth and development of the wheat will be hampered because of high temperature and drought which affected to the growth and yield. Wheat is particularly sensitive to stress injury and it is often grown in areas where high temperatures limit productivity (Paulsen, 1994; Efeoglu and Terzioglu, 2009). Research of Schapendonk et al., (2007) shows that a heat shock at the ‘end of tillering’ strongly reduced the rate of leaf photosynthesis, heat shock during ‘grain filling’ decreased both rate of photosynthesis (source) and grain growth (sink) and the rate of leaf photosynthesis was decreased by 40 to 70%, depending on cultivar and developmental stage. Pradhan et al., (2012) notes that drought and high temperature often occurs simultaneously, causing significant yield losses in wheat (Triticum aestivum L.)
.
Terminal drought stress showed significant effects on grain yield, dry matter accumulation and leaf area index in wheat genotypes (Dalirie et al., 2010).and to respond to climate change, increased tolerance to heat and drought stress should remain priorities for the genetic improvement of wheat.
It's been quite a lot genotypes of wheat were tested for adaptation in the tropical lowlands, but until this time they have not obtained lowland wheat varieties. The amount of environmental stresses in lowland tropical regions cause the failures. Mittler (2006) noted that farmers and breeders have long known that often it is the simultaneous occurrence of several abiotic stresses, rather than a particular stress condition, that is most lethal to crops. Al-Karaki (2012) noted that however, even when water is not a limiting factor (e.g. supplied by irrigation), lower yields were obtained in dry and semi dry environments as a result of heat stress that occurs during anthesis and grain filling periods which imposes negative effects on wheat and other crops production. However, these efforts need to be continue in order to obtain a derivative that is able to adapt in the tropical lowlands.
High temperatures and drought cause the respiration rate and plant transpiration is very high, so it is very low net assimilation. This situation led to the insufficient supply of assimilates to support the normal growth of plants. The performance of plants which experiencing high temperatures and drought stress is the dwarf plants, the size of leaf area is small, the leaf often curled, the root volume is small, early flowering plant, short panicle size, number of seeds are few, most spikelet are empty and the grain yield per plant is low. High temperature hastened the decline in photosynthesis and leaf area, decreased shoot and grain mass as well as weight and sugar content of kernels and reduced water use efficiency (Shah and Paulsen, 2003).
Genotype adaptation process is done in a sustainable manner, likely to produce genotypes that are able to survive and provide good results, although the results may not as high as in the tropical highlands. This process requires continuous observation to determine the dynamics of adaptation so that it can be known when the performance of phenotype the offspring genotype began to be stabile. The purpose of this research was to investigate the performance of thirteen genotypes tested in the lowland tropical in searching the candidates for adaptive
varieties of tropical lowland through the analysis of stress susceptibility index.
MATERIALS AND METHODS
This research was conducted in the district of Semarang and Demak in the period of 2011 until 2013. The experiments were located in area of latitude 5-50 meter above the sea level. During this experiment, the minimum and maximum temperatures respectively are 25oC and 38oC.
The materials and tools in this experiments are: Seeds of thirteen wheat genotypes, namely: ‘LAJ3302’, ‘Altar’, ‘Selayar’, ‘Oasis’, ’HP1744’, ‘RABE’,’H-21’, ‘G-21’, ‘G-18’, ‘Menemen’, ‘Barisbey’,‘Alibey’, ‘Dewata’. Manure has been used as base fertilizer spreading to the land during soil preparation (1 t ha-1) mixed with SP36 (50 kg ha-1). After 14 days the plants were fertilized with Urea (35 kg ha-1) and KCl (35 kg ha-1). Some of the equipment used were hand tractor, hoe, plastic pipe, water pump, thresher, plastic bag, siller, digital analytical balance and stationery.
Planting wheat genotypes for 3 consecutive years, namely in 2011 and 2012 located in Semarang district, while planting in 2013 located in Demak district. The experiment was laid out in a Randomized Complete Block Design (RCBD) with 3 replications. The parameter in this experiment are: the height of the plant, number of tiller, 1000 grains weight, seeds number panicle-1.
The results were analyzed using ANOVA, correlation index and to determine the differences between genotypes used the honestly significant difference test with a confidence level of 95%. To analyze the adaptation process of thirteen wheat genotype during three time planting in lowland tropical area, the current research used the stress susceptibility index (SSI).
The stress susceptibility index (SSI) was used as a measure of stress tolerance in terms of minimization of the reduction in yield caused by unfavorable versus favorable environments. SSI was calculated for each genotype according to the formula of Fischer and Maurer (1978) and Hossain et al. (2012):
SSI = (1-Y/Yp) : (1- X/Xp)
Y = mean grain yield of a genotype under a stress environment; Yp = mean yield of the same genotype under a stress free environment;
X = mean Y of all genotypes; Xp = mean Yp of all genotypes
If SSI < 0.5, the crop is highly stress tolerant, if SSI > 0.5 < l.0, it is moderately stress tolerant, and if SSI > 1.0, it is susceptible to stress.
RESULTS AND DISCUSSION
Plant height
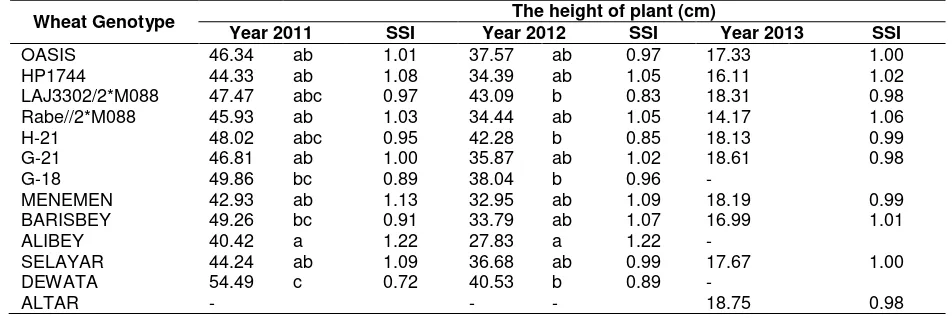
In the Table 1, it shows that the height of plants tend to decline during three planting season which means that there is a dynamic performance in character of plant height. Planting the genotypes in the year of 2011 as the first planting, the lowest plant height was about 40.42 cm, the maximum height was 54.49 cm, but the subsequent descent the lowest was 27.83 cm and the highest was 43.09 cm, while the next generation plantings in 2013 the height of plant was around 14.17 to 18.75 cm.
Based on the stress susceptibility index, during three planting season, there was not a genotype which include in category of highly stress tolerant (SSI < 0.5), but some genotypes were moderately stress tolerant (SSI: > 0.5 up to 1.0), especially genotype of LAJ3302/2*M088, H-21, DEWATA and ALTAR. The other genotypes actually were included in the category of susceptible to stress, which causes the performance of the plant height can’t be optimal.
Plant height of the wheat basically is the vertical growth, combination between vegetative growths (stems and leaves) and generative growths (panicle length). Vertical stem grow this influenced by the growth of the cells in the apical meristems and in the nodes of the stem. Cell division and elongati on activity is strongly influenced by the activity of the auxin hormone and the adequacy of assimilates for the process of cell enlargement. Nur et al., (2010) says that the change of environmental grows from the highlands to the lowlands in wet tropical regions causes a decrease in seed germination, plant height and number of productive tillers of each genotype. It means that the parameter of plant height is responsive to the environment condition in tropical lowland.
Auxin activity is strongly influenced by light intensity. Plants that were lack of sunlight would grow elongated due to cell division and extension in the shoots that was very active. However, plants that excess to the sunlight tends to be dwarf symptoms due to the activity of auxin in apical meristems and the nodes actually hampered so the plants become stunted. Temperature is an environmental factor that plants can perceive on a daily basis, and one remarkable effect is that not only are the basic physiological processes like metabolism, carbon partitioning, or photosynthesis affected, but developmental decisions, such as growth, that ultimately govern the architecture of the plant, are also modulated according to small variations in ambient temperature (Penfield, 2008).
Table 1. The plant height of thirteen wheat genotypes during three planting season in lowland
Wheat Genotype The height of plant (cm)
Year 2011 SSI Year 2012 SSI Year 2013 SSI
OASIS 46.34 ab 1.01 37.57 ab 0.97 17.33 1.00 HP1744 44.33 ab 1.08 34.39 ab 1.05 16.11 1.02 LAJ3302/2*M088 47.47 abc 0.97 43.09 b 0.83 18.31 0.98 Rabe//2*M088 45.93 ab 1.03 34.44 ab 1.05 14.17 1.06 H-21 48.02 abc 0.95 42.28 b 0.85 18.13 0.99 G-21 46.81 ab 1.00 35.87 ab 1.02 18.61 0.98 G-18 49.86 bc 0.89 38.04 b 0.96 -
MENEMEN 42.93 ab 1.13 32.95 ab 1.09 18.19 0.99 BARISBEY 49.26 bc 0.91 33.79 ab 1.07 16.99 1.01 ALIBEY 40.42 a 1.22 27.83 a 1.22 -
SELAYAR 44.24 ab 1.09 36.68 ab 0.99 17.67 1.00 DEWATA 54.49 c 0.72 40.53 b 0.89 -
ALTAR - - - 18.75 0.98
From the observation to the dynamics of plant height during the adaptation process in three planting season in tropical lowland, it shows that genotype is not yet strong enough to face the stress due to the high intensity of solar radiation. In lowland tropical regions as the planting site of this genotype, the environment temperature reaches 38oC, while the average daily temperature about 25oC. This high temperatures occur because the intensity of solar radiation in lowland area is very high. The result of the stress susceptibility index of the plant height parameter showed that in the first planting season, ‘Dewata’ genotypes have the lowest stress susceptibility index, and it means that it is more resilient than other genotypes. Unfortunately, this genotype cannot survive until the third planting season. In the next planting the lowest stress susceptibility index is ‘LAJ3302’ genotypes, and the next year there are three genotypes, namely ‘LAJ3302’, ‘G-21’ and’Altar’.
The growth of leaves in the excess light intensity will be hampered, because the activity of auxin in the leaf meristem has been hampered. The leaves of plants become shorter, and narrower, while the high temperature causes the leaves to be curly. This causes photosynthesis capacity becomes low. High environmental temperature causes the respiration rate is high, so the net assimilation during the growth is low. This causes the dwarf plant and the broad of leaves are decreased. The high temperature environment, causes the evapotranspiration are high and the water cell deficit often occur. Kramer (1963) explains that the water in the plant tissue have some function as an constituent of cell which active physiologically, maintain cell turgidity which necessary for enlargement and cell growth. It is clear that the water cell deficit have a negative effect to the plant growth.
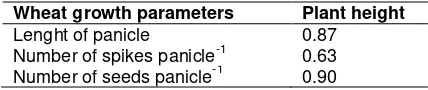
Table 2. Correlation between wheat growth parameters
Wheat growth parameters Plant height Lenght of panicle 0.87
Number of spikes panicle-1 0.63 Number of seeds panicle-1 0.90
Compared to the several wheat genotype planted in Cipanas tropical high land, the plant height of Menemen genotype can reach 72.73 cm (Amin, et al., 2012), but in this experiment
the plant height of Menemen only reached 42,93 cm, it is real that the genotype grown in the low land tropical during this experiments are still far from the expected. Plant height parameters are closely correlated positively with the length of panicle and the seed number panicle-1, each correlation is 0.87 and 0.90 (Table 2). This means that the higher the crop, the yields are higher, but the shorter the crop the yields are lower. High temperature stress, when combined with drought during late sowing, decreased the days to visible awns, days to heading and days to ripe harvest, finally negatively affecting the growth and development of plants and resulting in a lower plant population m−2, tillers plant−1, plant height and dry matter production m−2 (Hossain et al., 2012).
Wheat plants have a capability to form a clusters consist of tiller that emerged from each main shoot. The number of tillers affected to the number of panicles which produced in every cluster, so it can affect to the yields of crop. The genotypes which are able to produce more productive tillers cause the potential yield high.
Number of tillers
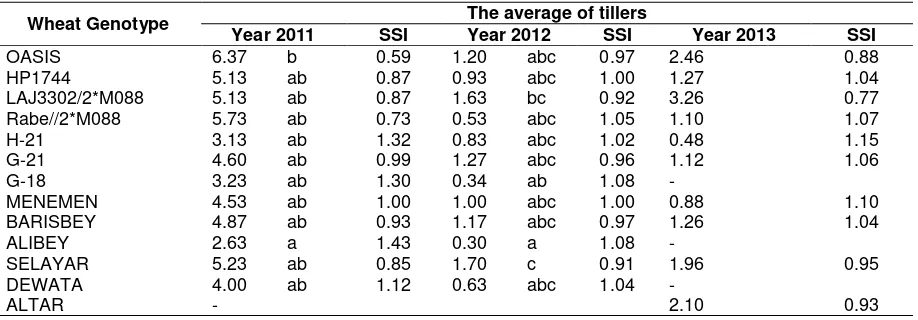
In the Table 3, it was shown the number of tillers, and there was a decrease during three planting season of genotypes tested in the tropical lowlands. The number of tillers produced from tropical highlands-wheat varieties are around 9, while the genotype of the first year planted in lowland only reached 6.37, the second year down to 1.7 while in the third year to be 3.2. From the stress susceptibility index value in the planting season of 2011, it was shown that the genotype of ‘Oasis’ has the lowest value, in the next planting season (2012) the genotype of ‘Selayar’ and in the planting season of 2013, the lowest stress susceptibility index is the genotype of ‘LAJ3302’. During three planting season, there is no genotype included in the category of highly stress tolerant but several genotype included in the category of moderately stress tolerant, respectively OASIS, LAJ3302/2*M088 and SELAYAR.
weight was not different among the genotype (6.03 g – 22.62 g). Several genotype include in the category of highly stress tolerant, there were OASIS, G-21, G-18, MENEMEN, BARISBEY and SELAYAR. The weight of 1000 grain provides an overview of the grain filling process. The size of seed was very close to the nature of its genotype, but the large seeds usually will be heavier than small ones.
Grain weight
The growth of grain is strongly influenced by the supply of assimilates into the grain that is being enlarged. If the assimilate that are drawn to this part are low, causing the size of the volume and weight of seeds is low. The lower weight of 1000 grain of the genotypes tested in lowland is caused by the supply of assimilates from the leaves to this section is also low due to the severe environmental stresses.
Assimilate translocation is strongly influenced by the adequacy of water absorption by plants. In the tissues of plants, water plays a role among others for the translocation process. Plants are frequently affected by drought or lack of water causes the translocation process of assimilate and nutrient elements are inhibited. This led to the growth of the organs that are needed and the assimilate is not be optimal.
Nicolas et al., (1984) noted that drought and drought x high temperature reduced the storage capacity of the grain, with a decrease in number of cells and starch granules in the
endosperm. Duration of dry matter accumulation and cell division were reduced in the drought and drought x high temperature treatments. It appeared unlikely that the supply of sucrose to the endosperm cells was the main limiting factor of dry matter accumulation in both drought and high temperature treatments.
The weight of 1000 grain of several wheat genotypes originated from Slovak Republic, which planted in tropical highlands of West Sumatra, can reached 44.10 gram (Irawati, et al, 2014), but several genotype which grown in lowland area in this experiment only reached 34.77 gram. In this experiment, the lowest stress susceptibility index in lowland area found in ‘Selayar’ genotype and the 1000 grain weight was 34.77 gram. Appearance of 1000 grain weight of genotype was adapted for planting three times and this turned out to be not stable. In some genotypes the stress susceptibility value was still high, illustrates that the process of grain filling affected by drought stress and high temperatures so it was not optimal.
Harvesting of lowland genotypes was more early than harvesting in tropical highland varieties. For example, the harvest age of ‘Dewata’ was about 129 days but when this varieties grow in lowland area the harvest age become 90 days after planting. These differences can have an effect on the duration of grain filling period, so that the weight of the seed genotypes tested in this study is lower because the seed charging occur in short period.
Table 3.The tillers number of thirteen wheat genotypes during three planting season in lowland
Wheat Genotype The average of tillers
Year 2011 SSI Year 2012 SSI Year 2013 SSI
OASIS 6.37 b 0.59 1.20 abc 0.97 2.46 0.88
HP1744 5.13 ab 0.87 0.93 abc 1.00 1.27 1.04 LAJ3302/2*M088 5.13 ab 0.87 1.63 bc 0.92 3.26 0.77 Rabe//2*M088 5.73 ab 0.73 0.53 abc 1.05 1.10 1.07
H-21 3.13 ab 1.32 0.83 abc 1.02 0.48 1.15
G-21 4.60 ab 0.99 1.27 abc 0.96 1.12 1.06
G-18 3.23 ab 1.30 0.34 ab 1.08 -
MENEMEN 4.53 ab 1.00 1.00 abc 1.00 0.88 1.10 BARISBEY 4.87 ab 0.93 1.17 abc 0.97 1.26 1.04 ALIBEY 2.63 a 1.43 0.30 a 1.08 -
SELAYAR 5.23 ab 0.85 1.70 c 0.91 1.96 0.95
DEWATA 4.00 ab 1.12 0.63 abc 1.04 -
ALTAR - 2.10 0.93
Table 4. The 1000 grain weight of thirteen wheat genotype in the process of adaptation in lowland
Wheat Genotype The 1000 grain weight (g)
Year2011 SSI Year2012 SSI Year2013 SSI
OASIS 29.77 b 0.56 34.12 cd -3.21 22.62 0.58 HP1744 27.44 ab 1.15 30.69 bcd 1.98 19.96 0.75 LAJ3302/2*M088 28.05 ab 1.00 29.82 abc 3.30 21.21 0.67 Rabe//2*M088 27.33 ab 1.18 28.30 ab 5.60 7.78 1.51
H-21 28.40 ab 0.91 30.54 bcd 2.21 8.33 1.48
G-21 28.55 ab 0.87 31.71 Bbd 0.44 6.03 1.62
G-18 27.12 ab 1.23 34.05 cd -3.10 -
MENEMEN 26.40 ab 1.41 32.57 cd -0.86 15.07 1.06 BARISBEY 30.22 b 0.45 32.01 bcd -0.02 13.25 1.17 ALIBEY 24.31 a 1.94 25.84 a 9.32 -
SELAYAR 31.08 b 0.23 34.77 d -4.19 20.08 0.74 DEWATA 27.73 ab 1.08 31.65 bcd 0.53 -
ALTAR 25.29 0.42
Remarks: SSI = stress susceptibility index
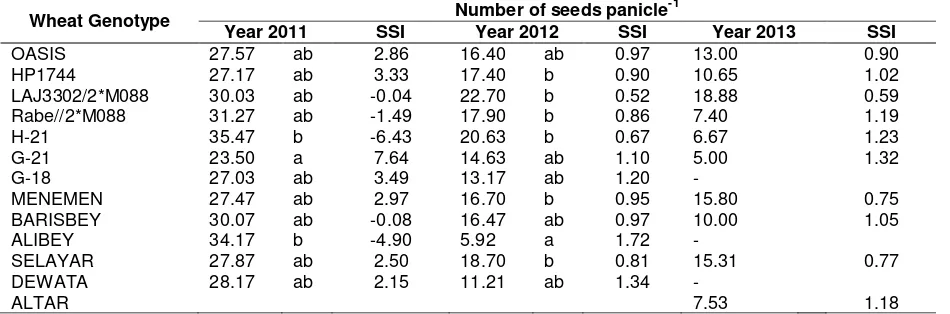
Table 5. Number of seeds panicle-1
Wheat Genotype Number of seeds panicle
-1
Year 2011 SSI Year 2012 SSI Year 2013 SSI
OASIS 27.57 ab 2.86 16.40 ab 0.97 13.00 0.90 HP1744 27.17 ab 3.33 17.40 b 0.90 10.65 1.02 LAJ3302/2*M088 30.03 ab -0.04 22.70 b 0.52 18.88 0.59 Rabe//2*M088 31.27 ab -1.49 17.90 b 0.86 7.40 1.19
H-21 35.47 b -6.43 20.63 b 0.67 6.67 1.23
G-21 23.50 a 7.64 14.63 ab 1.10 5.00 1.32
G-18 27.03 ab 3.49 13.17 ab 1.20 -
MENEMEN 27.47 ab 2.97 16.70 b 0.95 15.80 0.75 BARISBEY 30.07 ab -0.08 16.47 ab 0.97 10.00 1.05 ALIBEY 34.17 b -4.90 5.92 a 1.72 -
SELAYAR 27.87 ab 2.50 18.70 b 0.81 15.31 0.77 DEWATA 28.17 ab 2.15 11.21 ab 1.34 -
ALTAR 7.53 1.18
Remarks: SSI = stress susceptibility index
Seed number panicle-1
Based on the analysis of stress susceptibility index especially from the seeds number panicle-1 of thirteen wheat genotypes (Table 5) in the planting season of 2011, several genotypes were included in the category of highly stress tolerant (SSI < 0.5), there were LAJ3302/2*M088, Rabe//2*M088, H-21, BARISBEY, ALIBEY, but in the next planting season there was not any genotype included in the category of highly stress tolerant. In the planting season of 2012 and 2013 the genotype of LAJ3302/2*M088 with the SSI 0.52 and 0.59 actually approaching the limits of the category of highly stress tolerant.
Data of seeds number panicle-1 actually describe the ability of plants to support the grain filling process. The seed in panicle cannot grow well due to pollination failure or failure of grain filling process. Both of these problems can be caused of the high temperature and drought stress. The number of seeds per panicle was also determined by the length of panicle growth that determines the amount of spikelet. The more the spikelet number, the larger the size of the panicle will be. Usually, each spikelet has the potential to produce up to 3 seeds.
worldwide. High temperature followed by deficit soil moisture affected all stages from germination through to reproduction of crop when sown late, finally drastically reducing yield. Averaged over the varieties, the yield losses were 57% after drought, 76% after drought +heat, and only 31% after heat stresses (Balla et al., 2011).
If the process of pollination and grain filling takes place optimally, the number of spikelet panicle-1 and the number of grains panicle-1 becomes high. In addition to determining the number of grains panicle-1, grain filling process also determines the dough of seeds. Pithy seeds generally have a high germination and vigor. Reproductive stage water stress leads to spikelet sterility in wheat. Whereas drought stress at anthesis affects mainly grain size, stress at the young microspore stage of pollen development is characterized by abortion of pollen development and reduction in grain number (Ji et al., 2010).
The results of this experiment showed that during three planting seasons, the number of seed per panicle tends to decline. The number of seeds per panicle in the first year of planting can reach 35.47 grains that is genotypes ‘H-21’, but the next generation can only reach 22.70 grains, found in genotypes ‘LAJ3302/2*M088’ and the third generation reach 18.88 grains found in genotypes ‘LAJ3302/2*M088’. The performance yield of generative growth in this experiments still far from ideal, if it was compared with the performance yield in tropical highlands, which the seeds number could reach 30 seeds panicle-1.
From the stress susceptibility index analysis of the four parameters, the genotype that include in the category between the highly stress tolerant to the moderately stress tolerant is LAJ3302/2*M088. Other genotypes which survive in the last growing season (2013) and included in the category of moderately stress tolerant based on the parameter of tillers number and seed number panicle-1 are OASIS and SELAYAR. Both of these parameters determine the grain yield per cluster.
CONCLUSION
There were different performances among observed genotypes of wheat grown in the tropical lowlands. Genotypes LAJ3302/2*M088, Oasis and Selayar have been considered as candidate of wheat varieties which are adaptive in tropical lowland. These genotypes are more
tolerant than the other genotypes in lowland environment.
ACKNOWLEDGMENT
We are particularly grateful to the Rector of Satya Wacana Christian University in Salatiga, Indonesia and Dean of Agriculture Faculty of Satya Wacana Christian University. Funding of this research was provided by the Directorate General Higher Education in Indonesia during three years research.
REFERENCES
Al-Karaki, G.N. 2012. Phenological development-yield relationships in durum wheat cultivars under late-season high-temperature stress in a semiarid environ-ment. Int. Sch. Res. Netw. (ISRN) Agron. p. 1-7. doi: 10.5402/2012/456856.
Amin N., Trikoesoemaningtyas, Nurul K., Sudirman Y. 2012. Evaluation and genetic variation of introduces wheat lines in tropical agroecosystem.J Agrivigor 11 (2): 230-240.
Balla, K., M. Rakszegi, Z. Li, F. Békés, S. Bencze and O. Veisz. 2011. Quality of winter wheat in relation to heat and drought shock after anthesis. Czech J. Food Sci. 29 (2): 117-128.
Dalirie, M.S., R.S. Sharifi and S. Farzaneh. 2010. Evaluation of yield, dry matter accumulation and leaf area index in wheat genotypes as affected by terminal drought stress. Not. Bot. Horti. Agrobo. 38 (1): 182-186.
Efeoglu, B. and S. Terzioglu. 2009. Photosyn-thetic responses of two wheat varieties to high temperature. EurAsia J. BioSci. 3: 97-106.
Fischer, R.A. and R. Maurer. 1978. Drought resistance in spring wheat cultivars. I. Grain yield responses. Aust. J. Agric. Res. 29: 897-912.
J. Biol. Sci. 19 (4): 473-487. doi: 10.1016/ j.sjbs.2012.07.005.
Hossain A., J.A.T. da Silva, M.V. Lozovskaya, V.P. Zvolinsky and V.I. Mukhortov. 2012. High temperature combined with drought affect rainfed spring wheat and barley in south-eastern Russia: Yield, relative performance and heat susceptibility index. J. Plant Breeding Crop Sci. 4 (11): 184-196. doi: 10.5897/ JPBCS12.047.
Irawati C., Irfan S., Musliar K., Reflinaldon. 2014. Studies on Wheat (Triticum aestivum L.) adaptability in the Province of West Sumatera, Indonesia. International Journal on Edvanced Science Engineering Information Technology Vol. 4 No. 5: 56-61.
Ji, X., B. Shiran, J. Wan, D.C. Lewis, C.L. Jenkins, A.G. Condon, R.A. Richards and R. Dolferus. 2010. Importance of pre-anthesis anther sink strength for maintenance of grain number during reproductive stage water stress in wheat. Plant Cell Environ. 33 (6): 926-942. doi: 10.1111/j.1365-3040.2010.02130.x. Kramer, P.J. 1963. Water Stress and Plant
Growth. Agron. J. 55 (1): 31-35.
Mittler, R. 2006. Abiotic stress, the field environment and stress combination. Trends Plant Sci. 11 (1): 15-19.
Nicolas, M.E., R.M. Gleadow and M.J. Dalling. 1984. Effects of drought and high temperature on grain growth in wheat. Aust. J. Plant Physiol. 11 (6): 553-566. Nur, A., Trikoesoemaningtyas, N. Khumaida and
S. Sujiprihati. 2010. Phenology of
growth and yield of wheat in wet tropical environment (in Indonesian). Proceeding of the National cereals week. ISSN: 978-979-8940-29-3. p: 188-198.
Paulsen, G.M. 1994. High temperature responses of crop plants. In: K.J. Boote, J.M. Bennett, T.R. Sinclair, G.M. Paulsen (eds.) Physiology and determination of crop yield. Am. Soc. Agron. Madison, Wisconsin. USA. p. 365-389.
Penfield, S. 2008. Temperature perception and signal transduction in plants. New Phytol. 179: 615-628. doi: 10.1111/j.1469-8137.2008.02478. Pradhan, G.P., P.V.V. Prasad, A.K. Fritz, M.B.
Kirkham and B.S. Gill. 2012. Effects of drought and high temperature stress on synthetic hexaploid wheat. Funct. Plant Biol. 39 (3): 190-198.
Schapendonk, A.H.C.M., H.Y. Xu, P.E.L.V.D. Putten and J.H.J. Spiertz. 2007. Heat-shock effects on photosynthesis and sink-source dynamics in wheat (Triticum aestivum L.). NJAS-Wagen. J. Life Sci. 55 (1): 37-54.
Semenov, M.A., P. Stratonovitch, F. Alghabari and M.J. Gooding. 2014. Adapting wheat in Europe for climate change. J. Cereal Sci. 59 (3): 245-256. doi: 10.1016/j.jcs.2014.01.006.