www.elsevier.com / locate / livprodsci
The effect of dietary protein level during the pre-pubertal
period of growth on mammary gland development and
subsequent milk production in Friesian heifers
a ,
*
b b c d eR.C. Dobos
, K.S. Nandra , K. Riley , W.J. Fulkerson , I.J. Lean , R.C. Kellaway
a
NSW Agriculture Beef Centre, Armidale, NSW 2351, Australia
b
NSW Agriculture, Elizabeth Macarthur Agricultural Institute, Camden, NSW 2570, Australia
c
NSW Agriculture, Wollongbar Agricultural Institute, Wollongbar, NSW 2477, Australia
d
Bovine Research Australasia, Camden, NSW 2570, Australia
e
Department of Animal Science, University of Sydney, Camden, NSW 2570, Australia
Received 3 December 1998; received in revised form 14 June 1999; accepted 19 July 1999
Abstract
Sixty-three Friesian heifers were assigned to three different diets (21 per group) of 11 MJ ME per kg DM containing low crude protein (CP, 142 g CP per kg DM) with high rumen protected protein (REP, 270 g REP per kg CP) (diet A), high-CP (183 g CP per kg DM) with low-REP (133 g REP per kg CP) (diet B) and high-CP (182 g CP per kg DM) with high-REP (267 g REP per kg CP) (diet C) to obtain liveweight gains (LWG) of greater than 900 g per day between five and ten months of age in order to study the influence of dietary CP and REP concentration on mammary gland development and subsequent milk production. Six heifers per group were slaughtered at 16 months of age for evaluation of mammary glands. Pre-pubertal LWG was influenced by dietary CP concentration, such that heifers consuming diets B and C gained more than those consuming diet A (918 vs. 952 vs. 990 g per d). Dietary REP concentration did not influence pre-pubertal LWG. At slaughter, heifers consuming pre-pubertal diets with high-CP concentrations had less mammary fat tissue area and a lower
2
ratio of fat to secretory tissue compared with those on the low-CP diet (74.9 vs. 42.7 vs. 24.1 m ; 1.6 vs. 0.69 vs. 0.61). Heifers that consumed diet B during the pre-pubertal period had heavier dry udder weights, and tended to have more mammary fat and more secretory tissue area in the dry udder at slaughter than those heifers that consumed diet C (820 vs.
2
519 g; 636 vs. 420 g; 64.2 vs. 39.9 m ). Age and LW at calving were not influenced by either dietary CP or REP concentration. Daily first lactation milk, protein and fat yields were not influenced by pre-pubertal dietary CP concentration. The REP concentration in the pre-pubertal diets did not influence daily milk and fat yields but heifers that consumed diet C produced 0.08 kg more daily protein than did heifers that had consumed diet B. 2000 Elsevier Science B.V. All rights reserved.
Keywords: Heifers; Mammary gland development; Dietary protein; Rumen escape protein; Milk production
*Corresponding author. Tel.: 161-2-6770-1824; fax: 161-2-6770-1830. E-mail address: [email protected] (R.C. Dobos)
1. Introduction compared to heifers grown on an alfalfa based diet (22% CP). Milk production was not affected by Dairy heifers grown to achieve liveweight gains either diet, LWG or LWG within diet. However, (LWG) greater than 800 g per d before puberty have heifers on the high-CP diet produced 1.0 kg per d significantly reduced milk yields in some studies less fat-corrected milk, independent of pre-pubertal (Amir and Kali, 1974; Gardner et al., 1977; Little LWG.
and Harrison, 1981; Sejrsen et al., 1982; Valentine et There is continuing pressure for dairy managers to al., 1987; Waldo et al., 1989, but not in others reduce costs of production. Reducing age at first (Capuco et al., 1988; van Amburgh and Galton, breeding is an option but there is a need to determine 1994; Capuco et al., 1995; Pirlo et al., 1997). This if diet composition can alleviate the negative effects lack of consistency has been attributed to the differ- of high LWG during the pre-pubertal period. Sejrsen ent feeding standards used (Sejrsen, 1994), and also and Foldager (1992) suggested that type of diet may
to diet composition (Kertz et al., 1987). not be important at lower LWG. They found no
Kertz et al. (1987) suggested that the lower milk effect on mammary parenchyma of diets based on yield because of high pre-pubertal LWG could be straw in heifers at low feeding levels.
prevented by increasing the dietary crude protein The objective of this experiment was to determine (CP) concentration within this period. However, the effect of dietary protein concentration and investigations conducted by van Amburgh and Gal- amount of protein protected from rumen degradation
¨
ton (1994) and Mantysaari et al. (1995) indicated no (REP) within iso-energetic diets on mammary gland effect of dietary CP concentration on milk pro- development and subsequent production of dairy duction and mammary gland development, respec- heifers grown at LWG in excess of 900 g per d tively. Pirlo et al. (1997) investigated the effects of before puberty.
various levels of dietary energy and CP fed to Italian Friesian heifers between 100 and 300 kg liveweight on milk production during first lactation. Heifers
2. Materials and methods
consuming the diets with 110% recommended CP (NRC, 1989) at either 110% or 90% recommended
2.1. Study location (NRC, 1989) energy concentration had significantly
higher protein concentrations in their milk. Although
This experiment was conducted at NSW Agricul-there was no influence of either dietary energy or CP
ture’s Elizabeth Macarthur Agricultural Institute on milk and fat yield, heifers that consumed the
(EMAI), Camden (during the period from birth to high-energy (110% NRC, 1989), low-CP (90%
three months gestation) and at the Dairy Research NRC, 1989) diet, produced 1.6 kg per d less milk
Foundation, University of Sydney, Camden (from than heifers that consumed the high-energy, high-CP
three months of pregnancy to the completion of the (110% NRC, 1989) diet. Milk and fat yields were
first lactation). The experiment was approved by not influenced by dietary CP concentrations within
NSW Agriculture’s Animal Care and Ethics Commit-the low-energy (90% NRC, 1989) diets. Pirlo et al.
tee at EMAI (94 / 12). (1997) concluded that Italian Friesian heifers can
tolerate LWG in excess of 800 g per d between
dietary energy and CP concentrations of 90–110% 2.2. Pre-pubertal feeding period recommendations (NRC, 1989).
intake. Heifers were kept and fed in feedlot type To ensure adequate fibre intake, sorghum
(Sor-pens, with two pens per treatment. ghum sudanense) hay (8.060.1 MJ ME per kg DM;
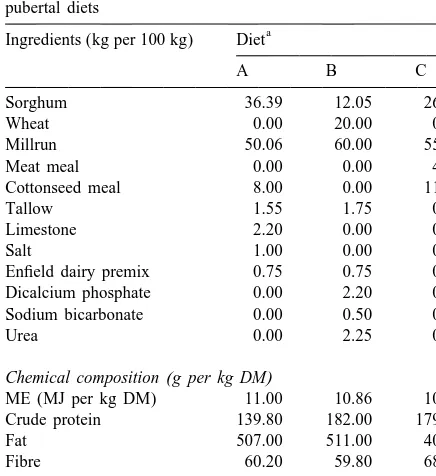
The ingredient and chemical composition of the 8066.2 g CP per kg DM) was added to the pellets at pelleted diets fed to heifers within the pre-pubertal a maximum of 30% by wet weight at each feeding.
period is given in Table 1. Total mixed diets were formulated to be
iso-ener-getic but differed in level of CP and REP (Table 2). Each mixed diet was offered ad libitum at 1400 h
Table 1
Ingredient and chemical composition of the three pelleted pre- and the consumption was calculated on a group basis
pubertal diets at the end of each week. Heifers were weighed
a weekly from entry until the end of the pre-pubertal
Ingredients (kg per 100 kg) Diet
feeding period.
A B C
Total intake of each mixed diet during the
pre-Sorghum 36.39 12.05 26.46
pubertal feeding period was similar (P.0.05) for all
Wheat 0.00 20.00 0.00
groups (12.7 vs. 12.4 vs. 12.3 t DM), with no
Millrun 50.06 60.00 55.99
evident ill-effects from consuming the treatment
Meat meal 0.00 0.00 4.85
Cottonseed meal 8.00 0.00 11.75 diets. Four heifers consuming diet C did not calve, as
Tallow 1.55 1.75 0.00 one was an inter-sex freemartin, one had an uterine
Limestone 2.20 0.00 0.00
torsion and two were not in-calf for unknown
Salt 1.00 0.00 0.00
reasons.
Enfield dairy premix 0.75 0.75 0.20 Dicalcium phosphate 0.00 2.20 0.25
Sodium bicarbonate 0.00 0.50 0.50 2.3. Pre-pubertal diet analyses
Urea 0.00 2.25 0.00
Weekly samples of each mixed diet were
compo-Chemical composition(g per kg DM)
sited at the end of the pre-pubertal feeding period for
ME (MJ per kg DM) 11.00 10.86 10.99
analysis of ME, CP and in sacco degradability
Crude protein 139.80 182.00 179.90
Fat 507.00 511.00 40.60 characteristics. ME was determined according to
Fibre 60.20 59.80 68.30 SCA (1990), while CP was calculated by multiplying
Calcium 9.10 6.00 6.60
the total nitrogen content by 6.25. Total nitrogen
Phosphorous 4.60 8.10 8.10
content was determined by a Kjedahl procedure
a
Diet A5high-energy, low-CP, high-REP; diet B5high- (AOAC, 1980) using a Kjeltec Auto 1030 (Tecator energy, CP, low-REP; Diet C energy, CP,
high-AB, Sweden).
REP.
In sacco degradability of protein was determined
REP5Undegradable protein; DM5dry matter; ME5
metabolisable energy (estimated from SCA (1990)). using three Hereford heifers (mean liveweight 444
Table 2
Metabolisable energy, crude protein, undegradable protein and in sacco degradability characteristics for the three diets fed to pre-pubertal heifers
a
Parameter Diet
A B C
Metabolisable energy (ME MJ per kg DM) 10.99 11.12 10.89
Crude protein (g CP per kg DM) 142.00 183.20 182.30
REP (g REP per kg CP) 270.00 133.00 267.00
a (g per kg CP) 254.00 517.00 328.00
b (g per kg CP) 563.00 404.00 521.00
c (g per h) 0.11 0.13 0.07
a
kg) fitted with rumen cannulae. Data on N residues (9.360.4 MJ ME; 175611.9 g CP per kg DM) to were fitted to the equation of Ørskov and MacDonald ensure a LWG of 700 g per d. During lactation, (1979) to determine the in sacco degradability heifers grazed irrigated kikuyu (9.560.6 MJ ME; characteristics of each mixed diet. The amount of 128610.3 g CP per kg DM) in summer and annual REP in each diet was calculated according to AFRC rye-grass in winter (10.960.6 MJ ME; 269613.2 g (1993). Table 2 shows the metabolisable energy (ME CP per kg DM) and were supplemented with maize MJ per kg DM), CP (g per kg DM), REP (g per kg silage when the pasture did not meet requirements. CP) and in sacco degradability characteristics of the Each heifer was offered pellets (5.0 kg per d as fed,
three mixed diets. 1260.2 MJ ME and 24168.2 g CP per kg DM) at
both morning and afternoon milking.
Using a tape measure, udders were measured for 2.4. Post-puberty to three months before calving
circumference, length and breadth on the same day 3 h after morning milking (mean6SE days in milk, At the end of the pre-pubertal feeding period,
196.265.37). heifers were grouped as one herd. LW was recorded
at weekly intervals. During the autumn and winter
the heifers grazed pastures consisting of annual 2.6. Slaughter protocol ryegrass (Lolium multiflorum, 10.760.06 MJ ME,
269616.1 g CP per kg DM) and dryland lucerne Once heifers reached 16 months of age and were (Medicago sativa, 9.760.4 MJ ME, 202621.5 g CP between 10 and 18 days after oestrus, six heifers per per kg DM), while in spring and summer they grazed group were stunned and immediately exsanguinated irrigated kikuyu (Pennisetum clandestinum, 9.460.3 at the abattoir. Udders were carefully removed MJ ME, 136613.7 g CP per kg DM) and dryland within 5 min of death and placed in a bucket of ice lucerne. In times of pasture shortage, the herd was for transportation to the laboratory. The udder was offered pellets (diet B), sorghum silage (6.260.6 MJ weighed before and after the removal of skin, teats, ME, 109612.4 g CP per kg DM) and lucerne hay parts of median suspensory ligaments, supramam-(9.360.4 MJ ME, 175611.9 g CP per kg DM). The mary lymph nodes and excess adipose tissue. Udders target LWG in the post-pubertal period was set to be were then dissected into left and right halves down
between 550 and 700 g per d. the median suspensory ligament and weighed. Both
At 15 months of age, heifers were injected with 2 halves were frozen at 2208C for later preparation of ml Estrumate (Mallinckrodt Vet Ltd., distributed by gland slices and biochemical analyses. At slaughter Jurox Pty. Ltd.) at day one of mating to synchronise carcasses were weighed (hot) and 24 h later assessed oestrus. A heat mount detector (Unistar Pty Ltd) was for fat depth (12 / 13th rib) and weighed (cold). applied to each heifer and heifers in oestrus were
presented to an Angus bull. Pregnancy was
diag-2.7. Mammary gland analyses nosed by rectal palpation 90 days after the last
individual mating and if diagnosed as pregnant were
The right half of the udder was cut into slices of removed from the mating group.
about 5 mm thickness using a meat slicer. Slices were made in the parasaggital plane, progressing 2.5. Three months before calving to end of first from the medial aspect to the most lateral portion of
and freeze dried for the determination of moisture. effects were each heifer within each month of Freeze dried aliquots also were used to determine lactation. The variance component estimation meth-lipid content (Folch et al., 1957) and amount of dry od was restricted maximum likelihood (REML) and fat free tissue (DFFT). Duplicate samples of DFFT the type of covariance matrix was compound sym-were used to determine the amount of DNA (Martin metry.
et al., 1972), hydroxyproline (Bergman and Loxley, 1963) and nitrogen in the udder. The hydroxyproline
value was converted to collagen using a factor of 3. Results
7.14, assuming 300 000 collagen g / mole.
3.1. Pre-pubertal heifer growth, age and LW at
2.8. Statistical analyses slaughter
Liveweight gain during the pre-pubertal feeding Influence of dietary CP and REP concentration on period was determined from linear regression analy- pre-pubertal growth and age and LW at slaughter is sis of LW against age. Differences in mammary summarised in Table 3. Pre-pubertal LWG was development between diets and dietary concentra- influenced (P50.05) by dietary CP concentration, tions of CP and REP were compared by analysis of such that heifers consuming the high-CP diets grew co-variance with initial LW and age and LW and age at a faster rate (952 and 990 g per d) compared with at slaughter as covariates. Covariates not contribut- those heifers that consumed the low-CP diet (918 g ing to the source of variation were removed. Differ- per d). However, pre-pubertal LWG was not in-ences in udder dimensions measured during lactation fluenced (P50.23) by dietary REP concentration. At were compared by analysis of covariance with days slaughter, LW averaged 364.6 kg across diets, with in milk as a covariate. Monthly milk, protein and fat the least square mean LW of the heifers that had yields were analysed using a mixed model split-plot consumed diet A being 30 kg heavier compared to in time repeated measures analysis with calving date those heifers that consumed diets B and C (P5
and LW at calving as covariates. The fixed effects 0.09). However, LW at slaughter was not influenced were diet by month of lactation, while the random by either dietary CP or REP concentration. Age at
Table 3
Least square means and contrasts for initial age and liveweight, age and liveweight at slaughter, and liveweight gain of pre-pubertal heifers reared on diets varying in crude protein and undegradable protein
a
Diet Contrast
A B C SED Diet Low-CP vs. Low-REP vs.
high-CP high-REP
——————— P —————— All heifers
N 21 21 21
Initial LW (kg) 114 115 122 5.7 0.31 0.38 0.82
Initial age (d) 160.3 160.5 156.1 10.1 0.89 0.82 0.66
LWG (g per d) 918 952 990 50.6 0.09 0.05 0.23
Slaughter heifers
N 6 6 6
Initial LW (kg) 115 126 128 13.2 0.59 0.32 0.88
Initial age (d) 137.3 166.5 159.8 14.8 0.15 0.06 0.66
LW at slaughter (kg) 386 352 356 20.4 0.22 0.09 0.87
Age at slaughter (d) 492.0 502.5 471.2 18.0 0.24 0.75 0.10
LWG (g per d) 924 972 944 67.4 0.80 0.62 0.98
a
slaughter was not influenced by either dietary CP or mary gland development is shown in Table 4. At
REP concentration. slaughter, heifers that consumed diet B during the
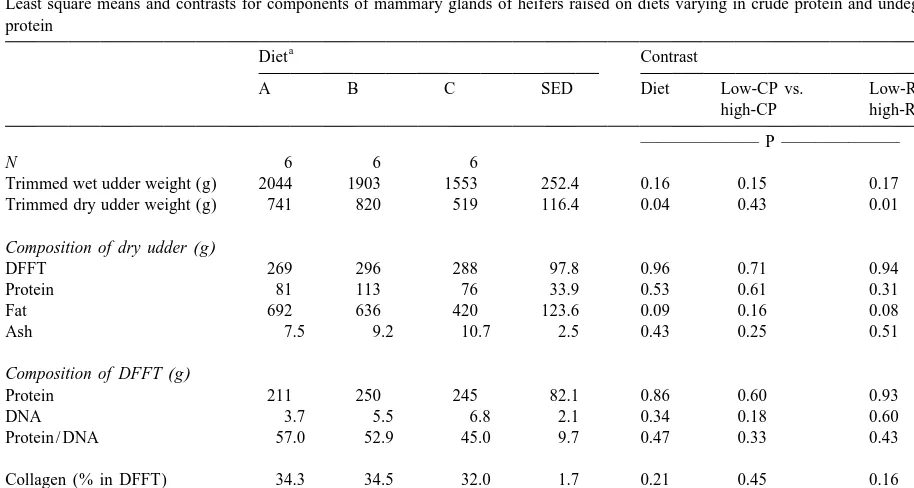
pre-pubertal period had heavier dry udder weights 3.2. Pre-pubertal mammary gland development (P50.01), tended to have more fat (P50.08) and more secretory tissue area (P50.07) in the dry 3.2.1. Influence of dietary CP concentration (diet udder than those heifers that consumed diet C (820
2
A vs. diets B and C) vs. 519 g; 636 vs. 420 g; 64.2 vs. 39.9 m ). Other
The influence of dietary CP concentration on pre- mammary gland components were not different (P.
pubertal mammary gland development is shown in 0.05, see Table 4). Table 4. At slaughter, heifers that consumed diet A
during the pre-pubertal period had more (P,0.001) 3.3. Influence of dietary CP and REP area of fat tissue and a higher (P50.002) ratio of fat concentration on first lactation production
to secretory tissue in their mammary glands
com-pared to those that consumed diets B and C. Other The influence of pre-pubertal dietary CP and REP mammary gland components were not different (P. concentration on age and LW at calving, first
lacta-0.05, see Table 4). tion production and udder dimensions is shown in
Table 5. The average pre-calving age and LW across 3.2.2. Influence of dietary REP concentration (diet diets was 26.1 months and 524.6 kg, respectively.
B vs. C) Heifers that consumed diet A were, on average, the
The influence of dietary REP concentration at the lightest at calving (517.8 kg) compared to those same dietary CP concentration on pre-pubertal mam- heifers that consumed either diet B (531.4 kg) or diet
Table 4
Least square means and contrasts for components of mammary glands of heifers raised on diets varying in crude protein and undegradable protein
a
Diet Contrast
A B C SED Diet Low-CP vs. Low-REP vs.
high-CP high-REP
——————— P ———————
N 6 6 6
Trimmed wet udder weight (g) 2044 1903 1553 252.4 0.16 0.15 0.17
Trimmed dry udder weight (g) 741 820 519 116.4 0.04 0.43 0.01
Composition of dry udder(g)
DFFT 269 296 288 97.8 0.96 0.71 0.94
Protein 81 113 76 33.9 0.53 0.61 0.31
Fat 692 636 420 123.6 0.09 0.16 0.08
Ash 7.5 9.2 10.7 2.5 0.43 0.25 0.51
Composition of DFFT(g)
Protein 211 250 245 82.1 0.86 0.60 0.93
DNA 3.7 5.5 6.8 2.1 0.34 0.18 0.60
Protein / DNA 57.0 52.9 45.0 9.7 0.47 0.33 0.43
Collagen (% in DFFT) 34.3 34.5 32.0 1.7 0.21 0.45 0.16
2
Fat tissue area (m ) 74.9 42.7 24.1 11.8 0.002 ,0.001 0.14
2
Secretory tissue area (m ) 53.4 64.2 39.9 12.4 0.18 0.90 0.07
Ratio fat / secretory tissue 1.6 0.69 0.61 0.29 0.007 0.002 0.77
a
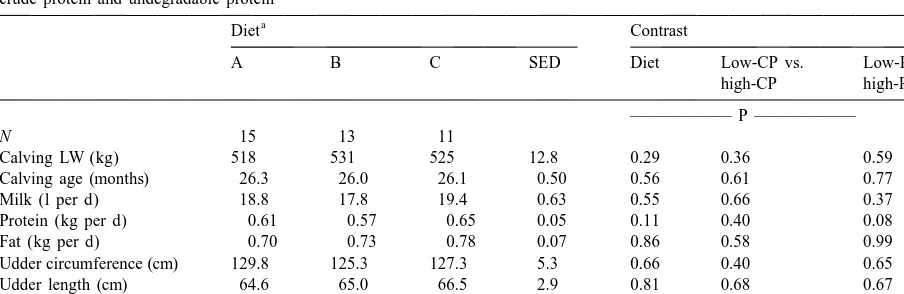
Table 5
Least square means, SED and contrasts for age and LW at first calving, and first lactation production of heifers raised on diets varying in crude protein and undegradable protein
a
Diet Contrast
A B C SED Diet Low-CP vs. Low-REP vs.
high-CP high-REP
—————— P ——————
N 15 13 11
Calving LW (kg) 518 531 525 12.8 0.29 0.36 0.59
Calving age (months) 26.3 26.0 26.1 0.50 0.56 0.61 0.77
Milk (l per d) 18.8 17.8 19.4 0.63 0.55 0.66 0.37
Protein (kg per d) 0.61 0.57 0.65 0.05 0.11 0.40 0.08
Fat (kg per d) 0.70 0.73 0.78 0.07 0.86 0.58 0.99
Udder circumference (cm) 129.8 125.3 127.3 5.3 0.66 0.40 0.65
Udder length (cm) 64.6 65.0 66.5 2.9 0.81 0.68 0.67
Udder breadth (cm) 73.5 72.0 73.7 3.0 0.80 0.73 0.54
a
Diet A5high-energy, low-CP, high-REP; Diet B5high-energy, high-CP, low-REP; Diet C5high-energy, high-CP, high-REP. SED5Standard error of difference for diet only; REP5undegradable protein; N5number of heifers; LW5liveweight.
C (524.6 kg). However, age and LW at calving were consumed pre-pubertal diets of high-energy, high-CP, not influenced (P.0.05) by either pre-pubertal low-REP. Pre-pubertal dietary REP concentration did
dietary CP or REP concentration. not influence first lactation production, although
The average daily first lactation milk, protein and there was a tendency for more daily protein to be fat yields across diets was 18.6 l, 0.61 and 0.73 kg, produced when pre-pubertal dietary REP concen-respectively. Daily first lactation milk, protein and tration was increased.
fat yields were not influenced by pre-pubertal dietary Our lactation results for pre-pubertal dietary CP CP concentration. Pre-pubertal dietary REP concen- concentration are in contrast to those of Pirlo et al. tration did not influence daily first lactation milk and (1997), who found an increase in daily first lactation fat yields but daily protein yield tended to be greater milk production of 1.6 kg when heifers were fed a (P50.08) in those heifers that had consumed diet C high-CP diet (110% NRC, 1989) compared to a compared to those that consumed diet B during low-CP diet (90% NRC, 1989) at similar high pre-pre-puberty. Udder dimensions measured during first pubertal LWG. The comparison of pre-pubertal lactation were not influenced (P.0.05) by either dietary REP concentration in our study indicated that pre-pubertal dietary CP or REP concentration. the high-REP diet compared with the low-REP diet produced similar lactation results to those of Pirlo et al. (1997). Since they did not study dietary REP
4. Discussion concentration, their increase in milk and protein may
have been due to the higher REP concentration in the Pre-pubertal diets of high-CP consumed by heifers high-CP diet because of the higher intake of soybean
to achieve LWG in excess of 900 g per d did meal.
tissue and ratio of fat to secretory tissue. Further Acknowledgements
reduction in mammary gland weight was observed in
our study when pre-pubertal REP concentration at a The authors wish to acknowledge the contribution
high-CP concentration was increased. of funding from the Commonwealth Department of
The comparison of dietary REP concentrations at Employment, Education, Training and Youth Affairs, the same dietary CP concentration, indicates that NSW Dairy Corporation, NSW Dairy Farmers As-pre-pubertal heifers gaining in excess of 900 g per d sociation, Elanco Animal Health (Australia), Dairy had less developed mammary glands when REP was Farmers Ltd., Australian Dairy Research and De-increased. However, these heifers were able to velopment Corporation, Semex Australia Pty. Ltd., produce 1.6 l per d more milk than their herd-mates Herd Improvers Australia Pty. Ltd., MillMaster consuming a low-REP pre-pubertal diet. This could Feeds Ltd., Wrightsons Seeds Pty. Ltd., University of
have been due to compensatory mammary growth Sydney and NSW Agriculture. Thanks to Mr B.
after mating and differences in body composition at Rhees, Ms Y. Leischke-Mercer and Ms S. Plowman the start of calving. Capuco et al. (1995) have for managing the heifers during the pre-calving stage discussed the concept of compensatory mammary of the experiment and to Dr J. Gooden and his growth in terms of inhibition of either primary duct dedicated staff at the University of Sydney MayFarm elongation or branching of ducts. Inhibition of for heifer management during the lactation stage. mammary growth in their study appeared to occur at
a later stage of development (ductular branching) than in the study by Sejrsen et al. (1982). No
References
histological data were collected in our experiment to confirm this hypothesis.
AFRC, 1993. Energy and protein requirements of ruminants, CAB
Capuco et al. (1995) also discuss the possible
International, Wallingford, UK, An advisory manual prepared
effects of body composition on the lack of
differ-by the AFRC Technical Committee on Responses to Nutrients.
ences between diet, LWG and diet within LWG in Amir, S., Kali, J., 1974. Influence of plane of nutrition of the dairy their experiment. In our study, heifers at slaughter heifer on growth and performance after calving. In: Dairy
did not differ in fat depth at the 12 / 13th rib between Science Handbook, Vol. 7. AgriServices Foundation, Davis, California, pp. 183–190.
dietary REP concentrations but heifers consuming
Association of Official Agricultural Chemists (AOAC), 1980. In:
the low-CP pre-pubertal diet tended to have a greater
Official methods of analysis of the AOAC, 13th ed. AOAC,
fat depth than those consuming the high-CP pre- Washington, DC, pp. 126–127.
pubertal diet (Dobos et al., 1997). Bergman, I., Loxley, R., 1963. Two improved and simplified methods for the spectrophotometric determination of hydroxy-proline. Analytical Chemistry 35, 1961–1965.
Capuco, A.V., Smith, J.J., Waldo, D.R., Rexroad, C.E., 1995. Influence of prepubertal dietary regimen on mammary growth
5. Conclusion of Holstein heifers. J. Dairy Sci. 78, 2709–2725.
Capuco, A.V., Smith, J.J., Waldo, D.R., Elsasser, T.H., 1988. Effect
Pre-pubertal diets containing low-CP compared to of diet and pre-pubertal growth rate of Holstein heifers on mammary gland growth and milk production. J. Dairy Sci. 71
high-CP increased the area of mammary gland fat
(suppl 1), 186.
tissue and the ratio of fat to secretory tissue area at
Dobos, R.C., Riley, K., Nandra, K.S., Kellaway, R.C., Fulkerson,
16 months of age. However, there was no effect on W.J., Lean, I.J., 1997. The effect of rumen escape protein on subsequent first lactation production. Pre-pubertal carcass characteristics of rapidly growing pre-pubertal dairy
diets containing high-REP compared to low-REP at heifers. In: Corbett, J.L., Choct, M., Nolan, J.V., Rowe, J.B. (Eds.), Recent Advances in Nutrition in Australia ’97.
Depart-similar concentrations of CP reduced the weight of
ment of Animal Science, University of New England, p. 255.
the dry gland and tended to reduce the amount of
Folch, J.M., Lees, M., Sloane-Stanley, G.H., 1957. A simple
mammary fat and the area of secretory tissue. High- method for the isolation and purification of total lipids from REP pre-pubertal diets tended to increase daily first animal tissues. J. Biol. Chem. 226, 497.
growth and early breeding of Holstein heifers. J. Dairy Sci. 60, Sejrsen, K., 1994. Relationships between nutrition, puberty and 1941–1948. mammary development in cattle. Proceedings of the Nutrition Kertz, A.F., Prewitt, L.R., Ballam, J.M., 1987. Increased weight Society 53, 103–111.
gain and effects on growth parameters of Holstein heifer calves Sejrsen, K., Foldager, J., 1992. Mammary growth and milk from 3 to 12 months of age. J. Dairy Sci. 70, 1612–1622. production capacity of replacement heifers in relation to diet Little, W., Harrison, R.D., 1981. Effects of different rates of energy concentration and plasma hormone levels. Acta Agric.
liveweight gain during rearing on the performance of Friesian Scand. Sect. A, Anim. Sci. 42, 99–105.
heifers in their first lactation. Animal Production 32, 362, Sejrsen, K., Huber, J.T., Tucker, H.A., Akers, R.M., 1982. Abstract. Influence of plane of nutrition on mammary development in ¨
Mantysaari, P., Ingvartsen, K.L., Toivonen, V., Sejrsen, K., 1995. pre- and post-pubertal heifers. J. Dairy Sci. 65, 783–800. The effects of feeding level and nitrogen source of the diet on Standing Committee on Agriculture (SCA), 1990. Feeding Stan-mammary development and plasma hormone concentrations of dards for Australian Livestock. Ruminants. CSIRO Publica-pre-pubertal heifers. Acta Agric. Scand. Sect. A, Animal Sci. tions, Melbourne, 266 pp.
45, 236–244. Valentine, S.C., Dobos, R.C., Lewis, P.A., Bartsch, B.D., Wickes, Martin, R.F., Donohue, D.C., Finch, L.R., 1972. New analytical R.B., 1987. Effect of live weight gain before and during procedure for the estimation of DNA with p-Nitro- pregnancy on mammary gland development and subsequent phenylhydrazine. Anal. Biochem. 47, 562–574. milk production of Australian Holstein-Friesian heifers. Aust. National Research Council (NRC), 1989. Nutrient Requirements J. Exp. Agric. 27, 195–204.
of Dairy Cattle, 6th revised ed. National Academy of Science, van Amburgh, M.E., Galton, D.M., 1994. Accelerated growth of Washington, DC. holstein heifers – effects on lactation. In: Cornell Nutrition Ørskov, E.R., MacDonald, I., 1979. The estimation of protein Conference for Feed Manufacturers, Rochester, NY.
degradability in the rumen from incubation measurements Waldo, D.R., Capuco, A.V., Rexroad, Jr. C.E., 1989. Replacement weighted according to rate of passage. J. Agric. Sci. Camb. 92, heifer growth rates affects milk producing ability. Feedstuffs
499–503. 27, 15–17.