www.elsevier.com/locate/dsw
A comment on multi-stage DEA methodology
Laurens Cherchye
∗, Tom Van Puyenbroeck
Center for Economic Studies, Catholic University of Leuven, Naamsestraat 69, B-3000 Leuven, Belgium
Received 24 May 1999; accepted 20 June 2000
Abstract
Coelli (Oper. Res. Lett. 23 (1998) 143) introduced a multi-stage (MS-) DEA methodology that represents an interesting alternative for the treatment of slacks remaining after proportional correction in inputs or outputs. By solving a sequence of radial models, one thus arrives at the identication of “more representative ecient points” (in terms of similar input=output mixes). We show that “mostrepresentative ecient points” can be found using a direct approach and may dier from those obtained by MS-DEA. Nevertheless, MS-DEA remains very attractive in view of its economic (intrinsic price) legitimation.
c
2001 Elsevier Science B.V. All rights reserved.
Keywords:Multi-stage DEA; Mix deviation; Cost interpretation
1. Introduction
As a solution to the slack problem of radial DEA measures, Coelli [6] proposed a multi-stage (MS-) DEA methodology that helps to identify “more repre-sentative ecient points” for the orientated DEA mod-els relative to those obtained by the original two-stage linear programming process presented in [1]. Specif-ically, he proposes to proceed in each further step by radially scaling down that (input=output) subvec-tor in which the evaluated observation is dominated in the Koopmans [10] sense. His conclusion is that “this approach seeks to identify ecient projected points which have input and output mixes which are as
sim-∗Corresponding author. Tel.: 326854; fax: +32-16-326796.
E-mail address:[email protected] (L. Cherchye).
ilar as possible to those of the inecient points” (p. 148). However, he gives no precise specication of how mix deviation should be measured. In this paper we show that, for an intuitive denition of the concept, the above assertion is not strictly correct. Nevertheless, because of its computational convenience, MS-DEA remains recommendable. Moreover, it can be given an attractive economic legitimation as we subsequently demonstrate. Some remarks are contained in the nal section.
We use5 (=) to indicate “less (greater) than or equal to”, while6(¿) means5 (=) and=. Fur-ther, cos(u; z) represents cos with being the an-gle between vectorsu andz. For ease of exposition, we focus solely on input eciency in the following and discuss mix deviation in terms of input combi-nations. Extensions to output projections are straight-forward, however. We further restrict attention to the constant returns to scale (CRS) DEA model presented
in [3], but a similar discussion applies to other DEA models.
2. Minimizing mix deviation
An appropriate indicator for the deviation between reference and evaluated input–output mixes appears to be the angle between the two vectors (see also [4]). In this respect, maximizing the cosine of this angle implies minimization of dispersion between the mixes. Obviously, standard DEA (radial) measures imply a cosine of value 1 as mixes of evaluated and reference combinations coincide. The search for a Koopmans ecient reference as similar as possible in terms of input and output mixes, then implies maximizing the cosine over the ecient subset.
Consider a setting withNrms. Eachith rm uses a semi-positive input vectorxi= (x1i; : : : ; xKi ) to produce
a semi-positive output vector yi= (y1i; : : : ; yMi ). Let
the input correspondence associated withyibe
repre-sented byL(yi). For DEA-CRS the latter is dened as
Further, let ELCRS(yi) represent the Koopmans
ecient subset ofLCRS(y
i):
ELCRS(yi)
≡ {x|x∈LCRS(yi); x′6x⇒x′∈LCRS(yi)}:
(2.1)
The following conditions should then be met by a reference vectorxR forxi:
(C.1) xR ∈ELCRS(yi),
(C.2) cos(xR; xi)=cos(x′R; xi) ∀xR′ ∈ELCRS(yi).
xR can be identied in two steps: rst locate ELCRS(y
i) and look for its cosine maximizing
el-ement in a second step. In a DEA setting ecient subsets are constituted by ecient facets of convex polyhedrons. Algorithms and software codes to iden-tify these facets have been developed in the multiple objective linear programming eld (see [14] for an overview). An ecient facet F can be expressed as
the set of all convex combinations of P ecient ex-treme points{xE1; : : : ; xEP}:So, identifying for each F the element which maximizes the cosine with xi
re-quires solving the following non-linear programming problem:
This problem can be solved by means of simple Lagrangian techniques. The same procedure should be followed for each rm in the sample (i.e.N times). The maximum cosine is then associated with the most “resembling” reference in terms of closest input mix. Note that it may sometimes be computationally more ecient to proceed by identifying all ecient facets of the whole production possibility set (and not of each separate LCRS(yi) individually) following, e.g.
the algorithm of Yuet al. [15]. A straightforwardly analogous procedure then applies.
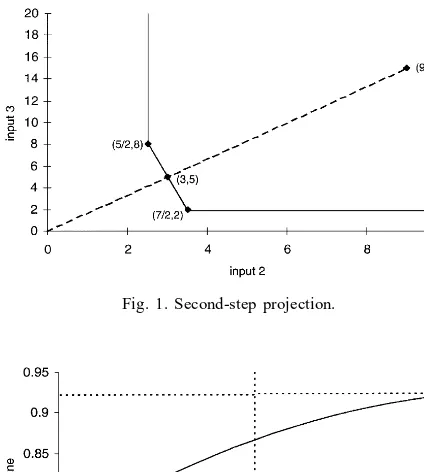
The “mix dispersion minimizing” reference will not necessarily coincide with that obtained from the MS-DEA algorithm as can be illustrated by means of a simple counterexample. Suppose we have three observations all of which produce the same amount of output. The input vectors are
x1= (10;9;15); x2= (10;7=2;2) andx3= (10;5=2;8). The one-step radial procedure labels all three obser-vations ecient. However, it is clear that onlyx2and
x3 are Koopmans ecient as x1 has a slack in both the second and third inputs. Convex combinations of
Fig. 1. Second-step projection.
Fig. 2. Evolution of cosine value.
value. It appears that mix deviation is minimized for
= 1, or:x3is the most representative reference. The associated cosine value between x1= (10;9;15) and its mix dispersion minimizing reference (10;5=2;8) is 0.922, which is clearly above 0.866.
A point that deserves special attention is the fact that the cosine measure (2.2) is not invariant to the units in which the dierent (input) quantities are mea-sured. The units invariance property has been espe-cially advocated by Russell [13]. To establish units in-variance of the cosine estimate prescaled data ˆxjlare to be used instead of the original dataxl
j (l=1; : : : ; K;j=
1; : : : ; N).
We will briey discuss two possible prescaling pro-cedures. A procedure that is frequently employed uses ˆ
xjl=xl
j=l, wherel represents the standard deviation
of each input variable l (see [11] where it was rst proposed in DEA). Strictly speaking, this procedure cannot be applied to our specic example as1=0. Of course, this is a somewhat pathological case. Thus,
as-suming there is at least one other observationx4with
x1
4 =x1i (i= 1;2;3), such a normalization procedure
could have generated the data of our example, and the case against the MS-DEA procedure still holds even when a units invariant procedure for measuring mix deviation (in cosine terms) is employed.
A particularly interesting alternative prescaling pro-cedure uses ˆxjl=xjl=xli, whereistands for the evaluated
rm (see e.g. [2]). Incorporating this in (2.2) yields the following objective:
max
1 √
K
K l=1 l()
K
l=1(l())2
; (2.3)
wherel() = [( Pj=1 jxElj)=xli] denotes the
propor-tional shrinkage in each inputlto get from the eval-uated input vector (xi) to the reference input vector
( Pj=1 jxEj). In fact, the measure in (2.3) captures
the cosine of the angle between the shrinkage vec-tor() = (1(); : : : ; K()) and the unit vectore=
(1; : : : ;1). Whenl()=l′() for alll; l′∈ {1; : : : ; K} (i.e. the cosine maximizing projection equals the ra-dial projection) then the cosine will equal unity as the shrinkage vector is collinear to the unit vector. On the other hand, the more() deviates from the unit vec-tor ein “mix” terms, the lower is the cosine value. This is intuitively appealing as in that case the pro-portional shrinkage factors (i.e. thel()) are
increas-ingly unequal. It is easy to check that applying this prescaling procedure to our example leads to exactly the same qualitative results, i.e.x3would be obtained as the “most representative reference” forx1.
An interesting by-product of this last procedure is that it allows for immediately constructing an e-ciency measure as a useful complement to the projec-tion procedure, viz., by aggregating the obtained (co-sine maximizing) references. For example, one could simply take the arithmetic mean (i.e. Kl=1 l()=K)
or the harmonic mean (i.e. K= Kl=1(l())−1) as an
eciency gauge (compare with [8,5], respectively, al-though we emphasize that the obtained eciency mea-sureneed not be associated with the same projection
pointas identied in [8, 5]).
two vectors. However, the latter appears to be a nat-ural choice and it is unlikely that our result would be contradicted for any other indicator.
While the above suggests that Coelli’s original mo-tivation for MS-DEA is debatable, the projection pro-cedure clearly has very attractive features. As pointed out by Coelli [6], it is units invariant (no prescaling is hence required) and computationally not very de-manding. Last but not least, there exists an economic justication for MS-DEA as we will show in the next section.
3. An economic legitimation for MS-DEA
Let us denote the radial (input) eciency estimate associated with an input–output vector (xi; yi) byi.
Debreu[7] proved that this measure can also be ex-pressed as follows:
i≡max xR
(pR)TxR (pR)Txi
; withxR∈IsoqLCRS(yi);
(3.1)
wherepR=0 is a shadow (or “implicit”) price vector associated with xR (i.e. (pR)TxR 5 (pR)Txl ∀xl ∈
LCRS(y)) and IsoqLCRS(y
i) the isoquant ofLCRS(yi):
IsoqLCRS(yi)≡
{x|x∈LCRS(yi); x∈LCRS(yi) for ∈[0;1)}:
(3.2)
Clearly, from comparison of (2.1) with (3.2), ELCRS(y
i)⊆IsoqLCRS(yi): radially ecient input
combinations are not necessarily Koopmans ecient. So, (3.1) reveals that radial projection results in a ref-erence belonging to the isoquant that maximizes the ratio of reference to actual costs (referred to as “cost ratio” in the following) evaluated against a shadow price vector associated with the latter (this shadow price vector need not necessarily be unique and is de-termined up to a positive multiplicative scalar). This gives a nice economic legitimation for (one-step) ra-dially projecting on the production frontier. That is, the radial measure has an evocative characterization as an upper bound to economic eciency using the shadow prices implicit in the production technology (see also [12]).
The slack problem of radial DEA measures boils down to the possibility of zero elements inpR. In the example of the previous section a zero implicit price is associated with the second and third inputs of x1. On the other hand, Koopmans [10] showed that in a linear activity setting (like DEA) each element of the ecient subset corresponds to at least onestrictly
positive shadow price vector. This Koopmans char-acterization of ecient production is widely accepted because of its intimate link with the rst two funda-mental theorems of welfare economics, which say that (for this specic setting) a productive organization is (input and output) ecient if and only if one can con-struct a strictly positive price vector under which it becomes prot maximizing. Analogously, in the input space a vector is ecient if and only if there exists a strictly positive price combination under which it is cost minimizing. In our example this is the case for
x2; x3 and all their convex combinations.
The MS-DEA projection obviously meets the Koop-mans denition. Moreover, it can be shown to maxi-mize the cost ratio, but now precisely evaluated against a strictly positive shadow price vector. To see this, suppose that the one-step radial procedure projectsxi
onxR∈IsoqLCRS(yi)\ELCRS(yi) (xR=ixi).
De-note the set of all xE ∈ ELCRS(yi) with the same
amount of inputs in whichxRdoes not exhibit slack by
XE ≡ {x|x∈ELCRS(yi) andx6xR}. Clearly, all
el-ements ofXEhave the same cost ratio asxR(with zero prices accorded to those dimensions in which there is slack). E.g., in the above example this applies for convex combinations ofx2 andx3 whenx1 is evalu-ated. For all otherx′
E ∈EL(yi)\XEthe cost ratio is strictly exceeded by that ofxR. Each element ofXEis by construction also associated with a strictly positive shadow price vector. Thus, by choosing the shadow prices corresponding to those dimensions in whichxR has a slack small enough compared to those of the non-slack dimensions, we still have that the resulting cost ratio related to eachxE∈XEwill strictly be above the cost ratios of allx′
E ∈EL(yi)\XE: That is, we are led to choose among the xE ∈ XE when search-ing for (in terms of cost ratios) a suitable Koopmans ecient reference.
Split upxR1in a slack subvectorxRSand a non-slack subvector xRN, and similarly decompose the shadow price vector pR associated with xR inpRS(=0) and
reduced. Also decompose xi and xE (∈ XE) in xiS and xiN (so that xRl=ixil (l= N;S)) andxES and
xEN (=ixiN), respectively. One thus has to ndxR∗ (decomposable in xR∗S6xRSwith associated implicit price vectorpR∗S¿0 andxR∗N=ixiNwith, without loss of generality,pR∗N=pRN) such that:
i(pRN)TxiN+ (pR∗S)TxR∗S (pRN)TxiN+ (pR∗S)TxiS
= i(pRN) Tx
iN+ (pES)TxES (pRN)TxiN+ (pES)TxiS
; (3.3)
wherexES corresponds to thexE ∈XE with a shadow price vectorpES¿0. (3.3) can be formulated as
i+ (R∗S)TxR∗S 1 + (R∗S)TxiS
= i+ (ES) Tx
ES 1 + (ES)TxiS
; (3.4)
where (R∗S)TxR∗S = (ES)TxES ≡ c, with c be-ing a positive constant. To see this, note that (3.3) should hold for all rescalings of the vectorspRN and
pkS(k= R∗;E). Next, we use that xRS; x∗RS andxE are radially ecient, i.e. (pRN)T(ixiN)5(pRN)TxlN and (pRN)T(ixiN) + (pkS)TxkS 5 (pRN)TxlN + (pkS)TxlS(k = R∗;E) for all xl = (xlN; xlS) ∈
LCRS(y). Convex combinations of these conditions (with k ∈ [0;1]; k = R∗;E) yield (pRN)T(ixiN) +
k(pkS)TxkS 5 (pRN)TxlN +k(pkS)TxlS. That is, for xR∗ andxE it is possible to rescale shadow prices associated with slack inputs independent of those corresponding to non-slack inputs while maintaining cost minimization. Then, xing R∗ and E appro-priately gives (pRN)T(ixiN) + R∗(pR∗S)TxR∗S = (pRN)T(ixiN) + E(pES)TxES; from which we ob-tain (R∗S)TxR∗S= (ES)TxES ≡ c for (kS)TxkS = [( k(pkS)TxkS)=((pRN)T(ixiN))] (k= R∗;E): Condi-tion (3.4) becomes
(i+c)((ES)TxiS−(R∗S)TxiS)=0: (3.5)
Eq. (3.5) is fullled when xR∗S is obtained from equiproportionate reduction ofxRS, as from (3.1):
(R∗S)TxR∗S
i(R∗S)TxiS
= (ES) Tx
ES
i(ES)TxiS
or (ES)TxiS−(R∗S)TxiS=0:
This establishes an economic legitimation for ap-plying radial (subvector) projection in the second step. Of course, it could be thatxR∗ ∈XE (some elements
ofR∗Sare equal to zero). In this case one can formu-late a straightforwardly analogous argument to justify a radial procedure in the third and (if necessary) each further step.
Summarizing, the MS-DEA algorithm has a sound economic basis which is very similar to the one-step procedure, but strengthens the latter by making shadow prices in the cost ratio strictly positive. There always exists a pair of strictly positive implicit price vectors under which the MS-DEA cost ratio exceeds that associated with any other element of the ecient subset.
4. Conclusion
When gauging the relative performance of a pro-ductive unit it often seems defendable to use bench-marks that are its peers in the most genuine sense. This is after all one intuitive rephrasement of the benet-of-the-doubt perspective underlying a great deal of the (in)eciency measurement literature. On the other hand, sticking to Farrell’s [9] “most conser-vative assumption” regarding mixes can yield peers that are themselves relatively inecient. Identify-ing a mix-minimizIdentify-ing ecient reference in the way described above safeguards the conservative assump-tion to the furthest extent possible. In particular, it will weakly dominate MS-DEA in identifying the ‘best’ ecient peers. Evidently, this yields a “most
representative ecient reference” only to the extent that one indeed interprets the general notion of rep-resentativeness in terms of product mixes. Or stated otherwise, the produced peers can still be criticized in view of the fact that an (almost) equiproportion-ate rescaling of input=output vectors is not always implementable in practice.
this account, MS-DEA seems a particularly appealing method for the treatment of slacks in the programming approach to productive eciency measurement.
Acknowledgements
We want to thank Tim Coelli, Holger Scheel and an anonymous referee for helpful comments on previous versions of this paper.
References
[1] A.I. Ali, L.M. Seiford, The mathematical programming approach to eciency analysis, in: H.O. Fried, C.A.K. Lovell, S.S. Schmidt (Eds.), The Measurement of Productive Eciency, Oxford University Press, New York, 1993, pp. 120–159.
[2] I. Bardhan, W.F. Bowlin, W.W. Cooper, T. Sueyoshi, Models and measures for eciency dominance in DEA: Part II: Free Disposal Hull and Rusell measure approaches, J. Oper. Res. Soc. Japan 39 (1996) 333–334.
[3] A. Charnes, W.W. Cooper, E. Rhodes, Measuring the eciency of decision making units, Eur. J. Oper. Res. 2 (1978) 429–444.
[4] L. Cherchye, T. Van Puyenbroeck, Non-radial eciency as semi-radial eciency, in: G. Westermann (Ed.), Data Envelopment Analysis in the Service Sector, Gabler, Wiesbaden, 1999, pp. 51–64.
[5] L. Cherchye, T. Van Puyenbroeck, Product mixes as objects of choice in non-parametric eciency measurement, Eur. J. Oper. Res. 132 (2001) 45–53.
[6] T.J. Coelli, A multistage methodology for the solution of orientated DEA models, Oper. Res. Lett. 23 (1998) 143–149. [7] G. Debreu, The coecient of resource utilization,
Econometrica 19 (3) (1951) 273–292.
[8] R. Fare, C.A.K. Lovell, Measuring the technical eciency of production, J. Econom. Theory 19 (1) (1978) 150–162. [9] M. Farrell, The measurement of productive eciency, J. Roy.
Statist. Soc. Ser. A 120 (1) (1957) 253–281.
[10] T. Koopmans, Analysis of production as an ecient combination of activities, in: T. Koopmans (Ed.), Activity Analysis of Production and Allocation: Proceedings of a Conference, Yale University Press, New Haven, 1951, pp. 33–97.
[11] C.A.K. Lovell, J.T. Pastor, Units invariance and translation invariance in DEA models, Oper. Res. Lett. 18 (1998) 147– 151.
[12] R.R. Russell, Measures of technical eciency, J. Econom. Theory 35 (1) (1985) 109–126.
[13] R.R. Russell, On the axiomatic approach to the measurement of technical eciency, in: W. Eichhorn (Ed.), Measurement in Economics: Theory and Application of Economic Indices, Physica-Verlag, Heidelberg, 1988, pp. 207–220.
[14] R.E. Steuer, Random problem generation and the computation of ecient extreme points in multiple objective linear programming, Comput. Optim. Appl. 3 (1994) 333–347. [15] G. Yu, Q. Wei, P. Brockett, L. Zhou, Construction of all