TREES DETECTION FROM LASER POINT CLOUDS ACQUIRED IN DENSE URBAN
AREAS BY A MOBILE MAPPING SYSTEM
Fabrice Monnier∗,Bruno Vallet∗,Bahman Soheilian∗
∗MATIS research Laboratory, IGN, Avenue de Paris, 94160 Saint Mandé, France - [email protected]
Commission III/4
KEY WORDS:terrestrial point cloud, geometrics descriptors, probabilistic relaxation, RANSAC, accumulation map, trees detection
ABSTRACT:
3D reconstruction of trees is of great interest in large-scale 3D city modelling. Laser scanners provide geometrically accurate 3D point clouds that are very useful for object recognition in complex urban scenes. Trees often cause important occlusions on building façades. Their recognition can lead to occlusion maps that are useful for many façade oriented applications such as visual based localisation and automatic image tagging. This paper proposes a pipeline to detect trees in point clouds acquired in dense urban areas with only laser informations (x,y, z coordinates and intensity). It is based on local geometric descriptors computed on each laser point using a determined neighbourhood. These descriptors describe the local shape of objects around every 3D laser point. A projection of these values on a 2D horizontal accumulation space followed by a combination of morphological filters provides individual tree clusters. The pipeline is evaluated and the results are presented on a set of one million laser points using a man made ground truth.
1 INTRODUCTION
Vegetation detection is a topic which has received significant in-terest from the remote sensing community over the past decade. This detection is mostly done based on data (image and/or li-dar) acquired from an aerial (Iovan et al., 2008) or spatial (Dali-akopoulos et al., 2009) point of view. This detection is often integrated in a broader classification where vegetation is one of the classes searched for. Conversely, few work have focused on vegetation detection based on terrestrial data. With the advent of mobile mapping, huge amounts of data can be rapidly acquired in urban areas, which raises the problem of vegetation detection from this very different type of data: details are finer, scenes are more complex, which calls for specific methods. Such a detection may prove very helpful for numerous applications:
• Realistic 3D reconstruction for fine city visualization: trees are needed to build realistic models of the anthropic areas but also to take into account the occlusions that they induce on the objects behind.
• Autonomous navigation for robotics applications: trees in-duce important perturbations in both GNSS and visual based localisation, but a trunk can also be a meaningful visual landmark for positioning.
• City planning and inventory.
The main goal of the work presented in this paper is to detect trees from mobile mapping point clouds. We aim at classifying points belonging to trees, but also at merging them into individual tree objects.
1.1 DATA
In this work, our datasets are point clouds acquired by a mobile mapping system equipped with two "RIEGL" laser scanners that can acquire up to 10 000 points per second. The laser acquires a slice from the horizontal (0◦) up to (70◦) in a plane orthogonal to the trajectory, and the third dimension is obtained by the move-ment of the vehicle. An integrated system composed of GPS/INS and an odometer ensures a good localisation of the vehicle dur-ing acquisition with sub-metric absolute accuracy and centimetric
relative accuracy. Our dataset was acquired in a dense European urban area over a 300 meters trajectory with a vehicle speed en-suring a distance between scanlines around 4cm (cf fig.1).
Figure 1: RIEGL laser point cloud acquired on a European urban area.
1.2 Related work
ge-ometric descriptors on the spatial arrangement of the neighbour-hood of each point by geometric primitives. However, their work only applies to forests and not urban environments.
In this work, our contribution is to propose several advances in the use of such descriptors, and in particular the use of a probabilis-tic relaxation to exploit neighbourhood homogeneity and verprobabilis-tical accumulation to exploit the inherent vertical redundancy of urban scenes.
1.3 Method overview
Our objective is to design a generic yet simple tree detection method that performs well on data acquired in complex urban en-vironments. This paper aims at proposing a simple methodology to perform this detection by solving a double problem: separate the points corresponding to trees from the other scanned objects, then separate individual trees within these points. In our work, we will base tree detection on geometric characteristics of trunks and foliage such as defined in (Demantké et al., 2011) and (Lalonde et al., 2006). These descriptors tell us if the points locally describe a linear, planar, spherical or cylindrical object(cf Section 2).
However, these descriptors alone will not prove sufficient for ef-ficient detection, so we will also exploit the different geometric relationships between the main elements present in urban scenes in sections 2 and 2.2. We will explain in section 3 how this is done by morphological operations on accumulation maps of the descriptors. Our approach will be evaluated and discussed in sec-tion 4 and a conclusion on our work will be drawn in secsec-tion 5.
Figure 2: Overview of our tree detection method.
2 GEOMETRIC DESCRIPTORS
2.1 Principle
The first step of our method is to classify the points of our laser scan according to the geometrical shape of their neighbourhood. Thus the classification will be based on local geometrical descrip-tors. This is done by the method described in (Demantké et al., 2011) which starts by performing a principal component analysis (PCA) for a varying neighbourhood sizes. PCA approximates the spatial distribution of points in the neighbourhood by an ellipsoid with axisViand axis lengthsσi=√λi. There are three extreme cases:
• σ1 ≫ σ2 > σ3: One main direction: linear neighbour-hood.
• σ1 ≃σ2 ≫ σ3: Two main directions: planar neighbour-hood.
• σ1 ≃σ2≃σ3: Isotropy: volumetric neighbourhood.
Threedimensionalitydescriptors are then defined to characterize how close the shape of the neighbourhood is to one of these ex-treme configurations:
• Linear descriptor :D1=(σ1−σ2)/σ1 • Planar descriptor :D2=(σ2−σ3)/σ1 • Volumetric descriptor :D3=σ3/σ1
TheDiand their entropy are computed for each neighbourhood size and the size for which the entropy is minimal is then selected. As their sum equals 1, these dimensionality descriptors can be seen as a probability that the shape of the neighbourhood is in one of the three extreme cases.
(a) Linear descriptor
(b) Planar descriptor
(c) Volumetric descriptor
• 1D: the linear descriptor responds on linear object such as small trunks or post.
• 2D: the planar descriptor responds on (planar) building façades • 3D: the volumetric descriptor responds on tree foliage and
certain complex façade structures such as balconies.
However, these descriptors are quite noisy, in the sense that neigh-bouring points might have very different descriptors. Hence, we chose to perform aprobabilistic relaxationto ensure more regu-larity.
2.2 Probabilistic Relaxation
Probabilistic Relaxation (Rosenfeld et al., 1976) aims at homoge-nizing probability values defined on points considering the prob-abilities of their near neighbours. The relaxation algorithm is an iterative algorithm in which the probability values at each point are updated at each iteration to make them closer to the probabil-ities at their neighbours. The update of the probabilityPkt(i)at a pointPiat timetis defined by a factorδPkt(i)which depends on:
• The distance between the pointPi and its neighbours Pj weighted by a GaussianWij=Gσ(d(Pi, Pj)).
• A compatibility matrixCk/ℓ defininga prioricorrelations between the probabilities of neighbouring points. The com-patibility matrix that we chose is given in Table.1. The diag-onal coefficient corresponding to the planar descriptors has a higher value than the other two because our data contain large planar surfaces (façades), implying that most planar points have planar neighbours.
CompatibilityCk/ℓ Linear D1 Planar D2 Volumetric D3
Linear D1 0.8 0.01 0.19
Planar D2 0.01 0.98 0.01
Volumetric D3 0.19 0.01 0.8
Table 1: Compatibility Matrix
The update factor can then be defined as
δPkt(i) = X
j
Wij 3 X
ℓ=1
Ckℓ(ij)×Pℓt(j) (1)
As the probabilities should remain normalized, the update can finally be defined in two steps:
Qt+1k (i) = (P t
k(i))×(1 +δPk)t (2)
Pkt+1(i) = Q t+1 k (i) P3
ℓ=1Q t+1 ℓ (i)
(3)
whereQis the unnormalized version ofP. The results are shown in figure 4.
As we can see, the relaxation increases the homogeneity within the scene objects and the contrast between the three dimensional-ity descriptors. For instance, foliage and façades are emphasized respectively in the 3D and 2D descriptors.
(a) Linear descriptor
(b) Planar descriptor
(c) Volumetric descriptor
Figure 4: Response of the different geometrical descriptors after probabilistic relaxation.
2.3 Results
Probabilistic relaxation homogenizes the probability values within the point cloud, which means that minor structures vanish while larger structures are preserved and smoothed. Because some rather large façade areas respond well to 1D (edges) or 3D (windows, balcony and floral ornament) the corresponding structures are preserved by the relaxation as shown in figure 5. Because we will extract the foliage and trunks as areas with high 3D and 1D response (respectively), we will filter out these remaining struc-tures by exploiting the spatial relationships between the strucstruc-tures of the scene, which will be explained in Section 3.
Moreover, detecting trunks is essential to our work if we want in-dividualize vegetation, and for this task the 1D descriptor alone is not robust because some trunks are large enough to respond in 2D (cf. figure 6). Thus we will define another geometric descriptor to discriminate planes from cylinders: the cylindricity descriptor.
(a) Response of the volumetric descriptor on façades
(b) Response of the linear descriptor on façades
(a) Linear (b) Planar
Figure 6: Descriptor confusions: linear and planar descriptors have the same response over posts and trunks.
2.4 Cylindrical Descriptor
In this section, we will define a cylindricity descriptorDcyl(i). As trunk surfaces can be approximated by vertical cylinders, we will restrict to detecting circles in projection on the(x, y)plane. DescriptorDcyldefines the probability that pointPibelongs to such a vertical cylinder. For each pointPi, a vertical cylinder (2D circle) is fitted to theknearest neighbours ofPiusing a simple RANSAC approach. This estimated cylinder gives us two indica-tors: the quality of the approximation (number of RANSAC in-lier’sNI(i)) and the radius of the cylinderR(i). To define a prob-ability from these indicators, we face the problem that a plane is a special cylinder with infinite radius, so a thresholdRmaxshould be chosen to discriminate planes from cylinders. A surface with cylindrical radius above this threshold will be considered planar (null cylindrical descriptor) while for radii below, the threshold quality of the cylinder will be given by the ratio of inliers:
Dcyl(i) = (
0 ifR(i)> Rmax,
NI(i)/k ifR(i)≤Rmax.
(4)
The parameters are:
• Neighbourhood sizekthat we set to 50. • Maximum cylinder radiusRmaxset to 50 cm. • RANSAC distance threshold for inliers set to 5 cm.
The results on figure 7 show that this descriptor responds well on the trunks of the scene, which will make it useful to discriminate large trunks (not responding in 1D) from façades.
The cylindrical descriptor shows a good response on trunks, but also on some other parts of the scene and particularly on parts of the façades. This is easily explained by the fact that most façades present locally cylindrical surface shapes. In the same way, the cylindrical descriptor does not distinguish between trunks and large post. For theses reasons, the next section aims at propos-ing a method combinpropos-ing the information given by the different geometric descriptors defined in this section as well as the verti-cal redundancy in order to detect trunks and foliage alone.
3 TREES DETECTION
In this section, we use the geometric descriptors to detect indi-vidual trees in the dataset. This will be done in 4 steps:
1. Vertical accumulation of each descriptors into a regular (hor-izontal) grid.
Figure 7: Visualization of the cylindrical descriptorDcyl(i).
2. Spatial filtering in 2D to obtain various masks 3. Combination of the masks to retrieve individual trunks 4. Tree foliage individualization to finally retrieve one trunk
and one foliage for each individual tree
3.1 Accumulation maps
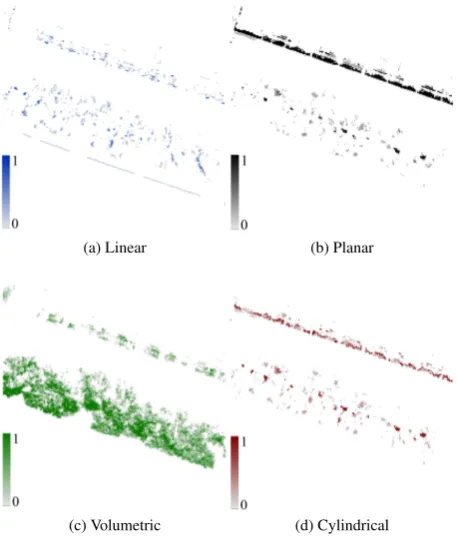
In a first step, vertical information redundancy is exploited by creating accumulation maps for each descriptor. The underly-ing idea is that most urban structures are roughly vertical (trunks, façades,...) such that the vertical accumulation of descriptors will amplify their response on such structures. For this projection, we chose a discretization step of 0.2 meter corresponding to ap-proximately 5 acquisition lines. The resulting accumulation maps (2194×2504pixels) are visible on figure 8.
(a) Linear (b) Planar
(c) Volumetric (d) Cylindrical
Figure 8: Accumulation maps descriptors.
usually have small vertical extension, so they tend to vanish in the accumulation compared to the large flat façade areas responding in 2D. As can be seen in figure 8, the accumulation maps can be rather sparse. This is why we will perform some spatial filtering to cluster the pixels belonging to object by introducing somea priorion the expected sizes of the objects of interest.
3.2 Spatial filtering
The goal of this step is to cluster neighbouring pixels with high accumulated descriptor value into individual objects. This re-quires some filtering steps to take into account both the spatial proximity and accumulation values. Each map will be filtered by same method but the parameters will be adapted for each type of descriptor: (1) Smoothing by Gaussian Kernel : connects neigh-bouring pixels with high accumulation values. (2) Hysteresis Thresholding : removes pixels with low response without cre-ating holes in larger objects. (3) Connected Component compu-tation: the remaining pixels are clustered in connected compo-nents. (4) Size filtering: components are filtered according to their sizes. (5) Morphological dilatation : allow to remove the re-maining holes and to provide a margin of error (tolerance band). The various parameters for these filters allow us to introducea priorion the geometry of the expected objects for each dimen-sionality. Only one parameter has a significant impact on the quality of the results: the high threshold value in the hysteresis filtering. If it is too low, too many objects will be detected, and if it is too high, meaningful objects will be missed. The results of this filtering are displayed on figure 9:
(a) Planar (b) Volumetric
(c) Cylindrical
Figure 9: Accumulation maps descriptors after different filters. 3.3 Trunk Detection
We now have the necessary tools to extract individual trunks in the laser point cloud: the cylindrical layer contains trunks, posts (traffic signs, lamp post, traffic lights, poles) and various parts of façades. As we are only interested in trunks, we will exploit the other information to remove the posts and façades parts: trunks will be defined as the objects of the cylindrical layer that are in-side an object of the 3D layer (trunks are surrounded by a foliage) and outside an object of the 2D layer (trunks do not belong to façades). The result (figure 10) show that most trunks are recov-ered (10c) while most posts and façade objects are removed (10b and 10c) compared to the figures (9b and 9c).
(a) Planar (b) Volumetric
(c) Cylindrical
Figure 10: Final accumulation maps descriptors. However, this method does not allow to distinguish trunks from posts surrounded by foliage. It is therefore useful to use the laser intensity to be able to differentiate between them. The laser in-tensity on metallic objects is much lower than on non-metallic objects, which can be used to remove some ambiguous posts. The last step of our tree detection will be to associate an unique foliage to each detected trunk.
3.4 Foliage Individualization
As in the previous step, objects in the 3D layer does not only correspond to our object of interest (foliage) but also to various complex structures along the façade. Hence we will define the fo-liage as the objects of the 3D layer that do not belong to an object of the 2D layer. The last problem to solve is that most trees in urban areas are close enough to have their foliage mixing. Hence our spatial filtering may have clustered neighbouring foliage to-gether. This is done by splitting the foliage object by associating each pixel of the foliage to the nearest trunk. The result of this 2D individualisation is shown in Figure 11.
Figure 11: Individualization trees in 2D image. Each individualized foliage object can finally be used to label in-dividual trees in the 3D laser point cloud by assigning each 3D point to the foliage it projects in. The result of this 3D individu-alization is shown on Figure 12.
4 EVALUATION AND DISCUSSION
4.1 EVALUATION
con-Figure 12: Individualized trees in the 3D point cloud.
taining trunk positions. This was used to compute the number
T P (True Positives) of trees detected by our algorithm that are present in the database (with a tolerance of 1 meter on the trunk position). NotingNAlgoandNRef the number of trees detected by our algorithm and in the reference database respectively, we can define:
• False Positives (wrongly detected trees)F P=NAlgo−T P • False Negatives (undetected trees)F N=NRef−T P • Correct Detection RateCDR=T P/NRef
• False Detection RateF DR=F P/NAlgo • Dice= 2T P/(T P+F P+NRef).
A good detection algorithm should maximize both of theDice
(quality value) and theCDRvalues, which means to detect as many trees as possible without generating too many false detec-tions. An illustration of this detection evaluation is shown in fig-ure 13.
Figure 13: Centres of the trunks detected by our algorithm (red) and trunk centres from the reference database (green).
NbAlgo NbRef TP FP FN CDR FDR Dice
49 41 33 6 8 80% 12% 83%
Table 2: Result obtained in our scene.
The results of this evaluation displayed in table 2 indicate that our use of a cylindrical descriptor to detect tree trunks is a promising approach: 80%of the trunks in the reference database are de-tected by our algorithm with aDicevalue near85%, for a rather low false detection rate of12%.
4.2 DISCUSSION
The main limitation for obtaining better results is the quality of the data and the scene complexity. Undetected trees are mainly due to a poor sampling (too few laser points on the trunk) which
happen if the tree is too far from the trajectory, occluded, or on the exterior of a turn. We also missed the smallest trees as our laser only scans above horizontal such that no points beneath 2.5 meter is acquired. However, this is a small price to pay to avoid handling the possible complexity of the sideways. Finally, false alarms are mainly due to posts lying beneath foliage. For these cases, the use of the laser intensity allowed us to reduce the false detections from30%to12%without impairing the correct detec-tion rate. Our tree detecdetec-tion method entirely relies on trunk de-tection as it is almost impossible to separate the foliage of neigh-bouring trees. The drawback of this approach is that trunks are much smaller than foliage, thus easier to miss in degraded con-figurations.
5 CONCLUSIONS AND FUTURE WORKS
The objective of this work was to design a simple method to de-tect trees in heterogeneous and complex 3D point clouds acquired in dense urban environments. This method couples 2D and 3D methods: the local geometrical shape of the point cloud is repre-sented by 3D descriptors, while individual objects are retrieved by clustering similar points based on 2D morphological opera-tions on the descriptors accumulation maps. The evaluation of our method against a reference dataset attests the good detection performance of our algorithm. Our work demonstrates the rele-vance of exploiting local geometric descriptors to analyse com-plex scenes. Further works will focus on defining new local geo-metric descriptors adapted to various types of objects, and study how these descriptors may be combined to enhance the detection performance.
REFERENCES
Bienert, A., Scheller, S., Keane, E., Mohan, F. and Nugent, C., 2007. Tree detection and diameter estimations by analysis of forest terrestrial laserscanner point clouds. ISPRS Workshop on Laser Scanning 2007 and SilviLaser 2007 Espoo Finland Commission(WG V/3), pp. 50–55.
Brenner, C., 2010. Vehicle localization using landmarks obtained by a lidar mobile mapping system. Photogrammetric computer vision XXXVIII, pp. 139–144.
Bucksch, A., Lindenbergh, R. and Menenti, M., 2009. Applications for point cloud skeletonizations in forestry and agriculture.
Daliakopoulos, I. N., Grillakis, E. G., Koutroulis, A. G. and Tsanis, I. K., 2009. Tree crown detection on multispectral vhr satellite imagery. Pho-togrammetric Engineering Remote Sensing 75(10), pp. 1201–1211.
Demantké, J., Mallet, C., David, N. and Vallet, B., 2011. Dimensionality based scale selection in 3d lidar point clouds.
Iovan, C., Boldo, D. and Cord, M., 2008. Detection, characterization, and modeling vegetation in urban areas from high-resolution aerial im-agery. IEEE Journal of Selected Topics in Applied Earth Observations and Remote Sensing 1(3), pp. 206–213.
Lalonde, J.-F., Unnikrishnan, R., Vandapel, N. and Hebert, M., 2005. Scale selection for classification of point-sampled 3d surfaces. Fifth In-ternational Conference on 3D Digital Imaging and Modeling 3DIM05 (January), pp. 285–292.
Lalonde, J.-F., Vandapel, N., Huber, D. F. and Hebert, M., 2006. Natural terrain classification using three-dimensional ladar data for ground robot mobility. Journal of Field Robotics 23(10), pp. 839–861.
Pfeifer, N., Gorte, B., Winterhalder, D., Sensing, R. and Range, C., 2004. Automatic reconstruction of single trees from terrestrial laser scanner data. Current XXXV(2001), pp. 1–6.
Rosenfeld, A., Hummel, R. A. and Zucker, S. W., 1976. Scene label-ing by relaxation operations. Ieee Transactions On Systems Man And Cybernetics 6(6), pp. 420–433.