FAST MEAN-SHIFT BASED CLASSIFICATION OF VERY HIGH RESOLUTION
IMAGES: APPLICATION TO FOREST COVER MAPPING
S. Boukir1, S. Jones2and K. Reinke2 1) EA 4592 G&E Laboratory, University of Bordeaux,
1 All´ee F. Daguin, 33607 Pessac Cedex, France
2) School of Mathematical and Geospatial Sciences, RMIT University, GPO Box 2476V, Melbourne, Victoria 3001, Australia [email protected], [email protected], [email protected]
Commission VII/4
KEY WORDS:Classification, Forestry, High resolution, Imagery, Mapping, Performance
ABSTRACT:
This paper presents a new unsupervised classification method which aims to effectively and efficiently map remote sensing data. The Mean-Shift (MS) algorithm, a non parametric density-based clustering technique, is at the core of our method. This powerful clustering algorithm has been successfully used for both the classification and the segmentation of gray scale and color images during the last decade. However, very little work has been reported regarding the performance of this technique on remotely sensed images. The main disadvantage of the MS algorithm lies on its high computational costs. Indeed, it is based on an optimization procedure to determine the modes of the pixels density. To investigate the MS algorithm in the difficult context of very high resolution remote sensing imagery, we use a fast version of this algorithm which has been recently proposed, namely the Path-Assigned Mean Shift (PAMS). This algorithm is up to 5 times faster than other fast MS algorithms while inducing a low loss in quality compared to the original MS version. To compensate for this loss, we propose to use the K modes (cluster centroids) obtained after convergence of the PAMS algorithm as an initialization of a K-means clustering algorithm. The latter converges very quickly to a refined solution to the underlying clustering problem. Furthermore, it does not suffer the main drawback of the classic K-means algorithm (the number of clusters K needs to be specified) as K is automatically determined via the MS mode-seeking procedure. We demonstrate the effectiveness of this two-stage clustering method in performing automatic classification of aerial forest images. Both individual bands and band combination trails are presented. When compared to the classical PAMS algorithm, our technique is better in terms of classification quality. The improvement in classification is significant both visually and statistically. The whole classification process is performed in a few seconds on image tiles of around1000×1000pixels making this technique a viable alternative to traditional classifiers.
1 INTRODUCTION
Classification of remotely sensed data has long attracted the at-tention of the remote-sensing community because classification results are the basis for many environmental and socioeconomic applications (Tso and Mather, 2001). Scientists and practition-ers have made great efforts in developing advanced classification approaches and techniques for improving classification accuracy (Lu and Weng, 2007, Guo, 2008). There are two broad classes of classification procedure and each of them finds application in the analysis of remote sensing image data. One is referred to as un-supervised classification orclusteringand the other is supervised classification ormachine learning(Duda et al., 2001). In clus-tering, the problem is to group a given collection of unlabeled patterns into meaningful clusters. In a sense, labels are associ-ated with clusters too, but these category labels aredata driven; that is, they are obtained solely from the data (Jain et al., 1999). Clustering procedures yield a data description in terms of clusters or groups of data points that possess strong internal similarities (Duda et al., 2001). Major clustering methods can be classified into the following categories (Pal and Mitra, 2004):
Partitioning methods : Given a data set of n objects and K, the number of clusters to form, a partitioning algorithm organizes the objects into K partitions, where each partition represents a clus-ter. The clusters are formed to optimize an objective partitioning criterion, often called a similarity function, such as distance, so that the objects within a cluster are similar, whereas the objects of different clusters are dissimilar. A partitioning method starts with an initial partition and uses an iterative refinement technique
that attempts to improve the partitioning by moving objects from one group to another. The most well-known and commonly used partitioning method is K-means and its variations. Partitioning methods work well for finding spherical shaped clusters in small to medium-sized data sets. For clustering very large data sets and to find clusters with complex shapes, these methods need to be extended.
Hierarchical methods : A hierarchical method can be classi-fied as either agglomerative or divisive, based on how the hier-archical decomposition is formed. The agglomerative approach, also called the bottom-up approach, starts with each object form-ing a separate group. It successfully merges the objects or groups close to one another, until all the groups are merged to one, or the required number of clusters is obtained. The divisive approach, also called the top-down approach, starts with all the objects in the same cluster. In each successive iteration, a cluster is split into smaller clusters, until eventually each object represents one cluster, or until a required number of clusters is obtained. These methods suffer from the fact that once a step (merge or split) is done, it can never be undone. This rigidity leads to sensitivity to noise in the data. Furthermore, their time and space complexities are much higher than in case of partitioning methods.
The Mean-Shift (MS) clustering algorithm (Comaniciu and Meer, 2002) belongs to this last category and is at the core of our unsu-pervised classification scheme for Very High Resolution (VHR) remote sensing data. In contrast to the classic K-means clus-tering approach (Duda et al., 2001), there are no embedded as-sumptions on the shape of the distribution nor on the number of modes/clusters in the MS clustering method. This powerful clus-tering approach has been successfully used for both the classifica-tion and the segmentaclassifica-tion of gray scale and color images during the last decade. However, the high computational complexity of the algorithm has constrained its application in remote sensing images with massive information. Consequently, very little work (Wang et al., 2006, Bo et al., 2009, Chehata et al., 2011) has been reported regarding the performance of this technique on remotely sensed data. In this paper, we aim to effectively and efficiently map remote sensing data through a new combined unsupervised classification method that consists of a cooperative approach of both the standard K-means and a fast Mean-Shift clustering algo-rithms.
This paper is organized as follows. The following section de-scribes the standard K-means algorithm and its weaknesses. Sec-tion 3 presents the general Mean-Shift algorithm and a fast ver-sion that has been recently proposed. We introduce then our new combined clustering method in section 4. The validation of our approach on forest cover classification from VHR imagery is presented in section 5. Discussions and concluding remarks are given in the last section.
2 K-MEANS CLUSTERING ALGORITHM
K-means is a simple algorithm that has been adapted to many problem domains and is commonly used in remote sensing. This algorithm is based on an iterative procedure. The main idea is to define K centroids, one for each cluster, assuming that the num-ber of clusters K is knowna priori. One popular way to start is to randomly choose K of the samples to initialize the means. The next step assigns each point of the data set to the closest centroid and include it in the corresponding cluster. K cluster mean vec-tors (centroids) are then updated using all the pixels in each clus-ter resulting from the previous step. This recursive procedure is iterated until convergence, in other words, centroids do not move any more.
The objective of the K-means algorithm is to minimize the within cluster variability. The objective function is the Sum of Squared Errors (distances to the cluster centers) defined by equation 1.
SSE=∑
i
∑
x∈Ci
(x−mi)2 (1)
wherexcorresponds to any point in clusterCi and mi is the mean (or centroid) of the latter.
Although the K-means procedure will always reach convergence, it does not necessarily find the most optimal configuration, cor-responding to the global objective function (SSE) minimum. The algorithm is also sensitive to the initial randomly selected clus-ter means. From a statistical point of view, the clusclus-ters obtained by K-means can be seen as the maximum likelihood estimates for the cluster means assuming each cluster comes from a spher-ical normal distribution with different means but same variance. This highlights a limitation of the K-means algorithm:it is most appropriate for images with clusters that are sphere-shaped and have the same variance. This does generally not hold for re-motely sensed images. For example, aforestcluster is usually
more or less elongated with a large variability. As a consequence, the K-means algorithm will often split upforestclusters into mul-tiple smaller clusters. Another weakness of the K-means algo-rithm, which is particularly troublesome is:K has to be specified. Unfortunately, there is no general theoretical solution to find the optimal number of clusters for any given data set. A simple ap-proach is to compare the results of multiple runs with different K and choose the best one according to a given criterion, but one needs to be careful because increasing K results in smaller er-ror function values by definition. In this work, we overcome this problem by involving the Mean Shift automatic mode detection procedure.
The computational complexity of the standard K-means algo-rithm isO(n), where n is the size of the data set.
3 MEAN-SHIFT CLUSTERING ALGORITHM
3.1 Standard Mean-Shift algorithm
The Mean Shift optimization procedure was first proposed by Fukunaga and Hostetler (Fukunaga and Hostetler, 1975), and later adapted by Comaniciu and Meer for image clustering and seg-mentation (Comaniciu and Meer, 2002). The Mean Shift algo-rithm is a non-parametric density-based method for analysis of complex multi-mode feature space and for delineation of arbi-trarily shaped clusters. This approach provides excellent results in clustering and object delineation in color images (Comaniciu and Meer, 2002).
The MS algorithm is based on a density mode searching and clus-tering. The feature space is considered as the empirical prob-ability density function (p.d.f.) of the input features. The algo-rithm proposes a filtering step that associates each pixel in the im-age with the closest local mode in the density distribution of the feature space. The MS procedure actually locates theses modes without estimating the global density, hence avoiding a compu-tationally intensive task. Local modes are searched for in the feature domain ofndimensions, wherenis the number of con-sidered features. An iterative procedure of mode seeking consists in shifting the n dimensional window to a local mode. This search window is initially centered at a data point randomly chosen from the image. Thisseedpoint is then recursively shifted to the av-erage of the data points in its neighborhood. Regions associated with nearby modes are fused.
Only one input parameter is needed, that is the choice of the ra-diometric range (hr) which corresponds to the unique spectral radius in the n-dimensions search window. In a multiple feature space, feature values are normalized prior to the MS mode de-tection and clustering steps. However, the general MS algorithm allows only one unique radiometric rangehr, which limits its po-tential in a multi-spectral and/or a multi-temporal context.
In order to extract an actual cluster in the image,hr has to be both:
• higher than the maximum radiometric difference between inner cluster pixel pairs
• lower than the radiometric difference between cluster pixels and surrounding cluster pixels
piecewise constant model (such as heavily textured areas), the larger values have to be used forhr and M to discard the ef-fect of small local variations in the feature space (Comaniciu and Meer, 2002). No theoretical constraints can be imposed on the value ofhr which is task dependent. In practical settings, its choice should incorporate a top-down knowledge driven compo-nent (Comaniciu and Meer, 2002). ParameterM is chosen in practice according to the Minimum Mapping Unit (MMU) which corresponds to the size of the smallest region of the map as well as the size of the smallest image object. The choice of MMU needs thematic knowledge too.
The mean shift density mode detection is a simple iterative proce-dure that shifts eachseedpointxto the average of its neighbors (Fukunaga and Hostetler, 1975). The shiftm(x)is determined by considering the gradient,∇fb(x), of the kernel density esti-mate (Comaniciu and Meer, 2002). It is one of the two terms of the latter and can be expressed as (equation 2):
m(x) =
wherexi corresponds to any point in the neighborhood of size
lwithin a kernel bandwidthhassuming a Gaussian kernelg(). The first part of the Mean Shift vectorm(x)corresponds to the calculated neighborhood center of massC.
The MS algorithm is particularly effective in high density regions but is computationally expensive especially in case of multidi-mensional data sets due to the underlying optimization procedure to determine the modes of the pixels density.
To investigate the MS algorithm in the difficult context of very high resolution remote sensing imagery, we use a fast version of this algorithm which has been recently proposed, namely the Path-Assigned Mean-Shift (PAMS).
3.2 Fast Mean-Shift algorithm
While a few work has been reported on the use of the standard MS algorithm on remotely sensed images (Wang et al., 2006, Bo et al., 2009, Chehata et al., 2011), fast versions of this cluster-ing method have never been used yet for a remote senscluster-ing appli-cation despite the computational complexity of the general MS algorithm for remote sensing data. In this work, we aim to ef-fectively and efficiently map remote sensing data using a fast MS algorithm that preserves robustness while significantly increasing computational speed.
The Path-Assigned Mean-Shift algorithm (PAMS) is a fast ver-sion of the MS algorithm that exploits neighborhood consistency (Pooransingh et al., 2008). In the PAMS assignment, all data points along the path toward the mode point are assigned to the final mode value :
∀P∈P ath(S), cluster(P) =mode(S) (3)
Thus, points already assigned modes are eliminated from the mean shift process and are not traversed in the future. Consequently, seed points number is dramatically reduced in the mode seeking step and the complete mean shift process converges much faster.
Unlike most fast MS methods (DeMenthon, 2002, Zhang et al., 2005), this method is a true mean shift as no preprocessing phase is needed (Pooransingh et al., 2008). Furthermore, no post-processing is needed as in the case of the original algorithm (Comaniciu and Meer, 2002). In this fast process, all points of the data set are considered unlike other methods that use a sample of the data set to reduce the complexity.
The PAMS algorithm is up to 5 times faster than other fast MS algorithms (DeMenthon, 2002, Zhang et al., 2005) while induc-ing a low loss in quality compared to the original MS version. This loss is mainly due to the fact that, unlike in the original ver-sion, the data points traversed along the path toward a mode point are not considered as potential seed points to explore in the next mode seeking step. To compensate for this loss, we propose to use the K modes (cluster centroids) obtained after convergence of the PAMS algorithm as an initialization of a K-means cluster-ing algorithm.
3.2.1 PAMS algorithm The main steps of the PAMS algo-rithm are as follows (Pooransingh et al., 2008):
1. Select a point siteS(p, q)at random in the image.
2. Extract the spectral values vectorI(p, q)of the pixel at that point.
3. Find theineighborhood vectors,Ii(t), within the spectral bandwidth,hr.
4. Compute the center of mass,C, in the spectral domain.
5. Translate by the mean shift vector,m.
6. Repeat steps 3 and 5 till convergence to stationary mode vec-tor,Im. Assign the final mode vector,Im, to the entire mean shift path,Ii(t),0≤t≤T, whereT is the number of iter-ations to convergence.
3.2.2 PAMS versus MS algorithms The major conceptual difference between the PAMS and MS algorithms lies on simulta-neousversusconsecutivemode seeking and clustering steps. The computational complexity of the general MS algorithm isO(n2), where n is the size of the data set. The main computational load for this algorithm lies in the calculation of the mean shift vector,
m(see equation 2). The complexity of the PAMS algorithm is reduced toO(Φ2)whereΦrepresents the total number of unas-signed points per iteration of the algorithm. Thus, in theory, the complexity of the PAMS algorithm is betweenO(n)andO(n2) but isquasi-linearin practice as the computation time is reduced significantly with each iteration.
4 COMBINATION OF K-MEANS AND MEAN-SHIFT CLUSTERING ALGORITHMS
Our main objective is to achieve a fast and robust clustering method capable of processing multidimensional remote sensing data sets easily.
We present here a new combined method that consists of a co-operative approach of two different algorithms for unsupervised classification : the well-established K-means and the more ad-vanced Mean-Shift clustering algorithms. A fast version of the Mean-Shift was chosen for more efficiency, especially in the con-text of VHR remote sensing data, namely the PAMS algorithm.
• PAMS algorithm is involved as a first-pass process. It pro-vides reliable initial centroids for the subsequent K-Means algorithm.
• K-means algorithm is used as a second-pass refinement pro-cess. It converges very quickly to a refined solution to the underlying clustering problem. Resulting clusters are more accurately delineated than in the PAMS algorithm which, in comparison to the standard MS algorithm, sacrifices some effectiveness for efficiency.
The latter does not suffer the main drawback of the classic K-means algorithm (the number of clusters K needs to be specified) as K is automatically determined via the MS mode-seeking pro-cedure, nor the troublesome initialization of the centroids that classification outcome is sensitive to, as previously stated. And, while in the standard K-means algorithm, it frequently happens that suboptimal partitions are found, this 2-pass combination ap-proach leads to optimal and relatively stable clustering results.
The time required to perform the mode seeking (fast Mean-Shift) and clustering steps (fast Mean-Shift and K-means) is nearly lin-ear in the number of elements of the data set (complexityO(n)). Hence, the introduced combined clustering method remains al-most as fast as the standard K-means algorithm while providing comparable classification accuracy to the general Mean-Shift al-gorithm which has a quadratic computational complexity (com-plexityO(n2)).
5 EXPERIMENTAL RESULTS
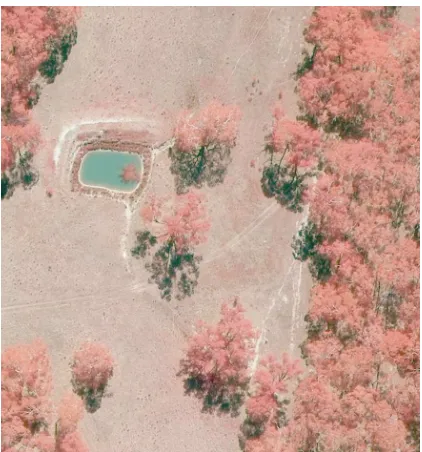
The new clustering scheme has been applied to forest site charac-terization from multispectral VHR imagery (Farmer et al., 2011). We demonstrate the effectiveness of our two-stage clustering method in performing automatic classification on an aerial multispectral forest image, of 30 cm spatial resolution, combining three spec-tral bands : Green (G), Red (R) and Near-Infra-Red (NIR), shown on fig. 1. This877×938image of a paddock field exhibits small and larger clusters of trees. Four main classes can be seen in this image: soil, water hole, trees, and shadows. The latter is an is-sue in forestry and is particularly enhanced in VHR imagery, as well as texture which is not considered in this work. Only spec-tral information is used here. Both individual bands and band combination results are presented in the following.
5.1 Classification of individual bands
Our clustering method has been applied to the NIR band of the paddock field aerial image. Only three major classes can be seen in this image: soil, trees, and shadows. The water hole cannot be spectrally distinguished from the soil class. The PAMS al-gorithm fully automatically classifies this individual band into 3 different clusters (fig. 2(a)). The classification results are rep-resented by the final mode (or cluster centroid) value of each feature point. The radiometric resolutionhrhas been automat-ically set to half the standard deviation of the whole image data (hr= 16.5) and minimum cluster sizeMhas been set to 10 pix-els. We can notice that the algorithm distinguishes well trees from soil but has trouble in separating trees from their shadows. The trees cluster is under-estimated while the shadows cluster is over-estimated. This probably comes from the neighborhood consis-tency on which is based the PAMS algorithm and also from the radiometric resolutionhr.
Our combined approach, involving both PAMS and K-means al-gorithms, leads to a meaningful classification, depicted on fig.
Figure 1: Paddock field aerial image (G,R,NIR)
2(b), with a satisfactory preservation of the details of the land-scape. This clustering result clearly exhibits a better classifica-tion quality than when using PAMS algorithm alone. Indeed, the three different clusters are now accurately delineated, including the trees and shadows which were problematic in the previous PAMS classification result (see fig. 2(a)).
Let us emphasize that the MS clustering performance is essen-tially controlled through the resolution of the analysis : radio-metric bandwidthhr. A largerhr would lead to less details in the resulting classification but at a higher speed than a smaller
hr. Only features with high radiometric contrast survive when
hris large (Comaniciu and Meer, 2002). A smallerhrwill pre-serve finer details and will produce a larger number of clusters. ParameterM has a minor impact on the clustering outcome. It can be neglected all together unless very small classes have to be filtered out in the task of interest.
Thanks to our 2-stage classification process, we can sacrifice some accuracy in the first stage, which is the most computationally de-manding (due to the mode detection optimization process), to delineate more accurately the clusters in the second refinement stage.
Visual comparison is insufficient for determining the performance of the classification procedure. Therefore, both unsupervised clas-sification approaches were also statistically analyzed using two well-known measures for clustering quality assessment : intra-class variance (or within cluster variance), defined as a weighted (by class sizes) average of variances of the different classes, and inter-class variance (or between clusters variance), which repre-sents the variance of the means (or cluster centroids) also weighted by class size. Table 1 shows these statistics for both methods as well as their running time in a matlab platform. We can notice that the improvement in classification is also significant statis-tically: intra-class variance decreased by 32% while inter-class variance increased by 43%. The whole classification process combining fast Mean Shift and K-means is performed in about 5 s.
5.2 Classification of multiple bands
Algorithm Intra-class Inter-class Computational
variance variance time
PAMS 225.26 827.68 3.68 s
Combined 154.15 1187.20 5.56 s
(PAMS+K-means)
Table 1: Performance comparison between the PAMS and the new combined (PAMS & K-means) algorithms
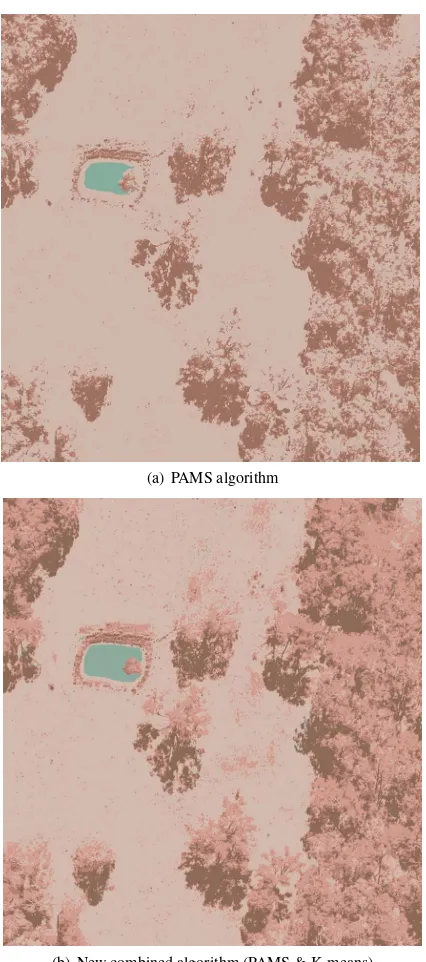
the classification results depicted on fig. 3. As in the previous single-band classification, the radiometric resolutionhrhas been automatically set to half the standard deviation of the whole im-age data (hr= 19.3) and minimum cluster sizeMhas also been set to 10 pixels. Unsurprisingly, the water hole cluster is detected now as the algorithms consider the 3 spectral bands (G, R, NIR). The PAMS algorithm automatically provides the number of clus-ters : K = 5. One of the 5 clusclus-ters is not relevant and is twice smaller than the water hole size. Let us notice that the K-means algorithm alone (withK= 5±1) fails to cluster the water hole, which is a minor class compared to the others. Our 2 pass-method allows once again to refine the results of the PAMS algorithm. Intra-class and inter-class variances for PAMS and combined al-gorithms are respectively : σ2
w1 = 238.50,σ2b1 = 944.05, and
σ2
w2 = 144.90,σb22 = 996.42. Hence, intra-class variance de-creased by 39% while inter-class variance inde-creased by 5.5%. The PAMS algorithm running time is : 17.16s. Only 3 itera-tions of the K-means algorithm permit to significantly refine the clustering results achieved by the latter. These results confirm the suitability of our method for unsupervised classification of forest remotely sensed data. Our approach is applicable to the classifi-cation of any other aerial or satellite image and in the context of any application related to forestry or not.
6 CONCLUSIONS AND FUTURE WORK
The Mean Shift algorithm is an appealing choice for image clas-sification due to its non parametric nature and its minimal user input. The user controls the classification performance through a single parameter that has a clear physical meaning and hence is easy to specify: the resolution of the analysis (radiometric band-widthhr). This nonparametric clustering paradigm is certainly a better alternative to cluster multispectral remote sensing imagery than earlier parametric methods. However, it is computationally intensive in the context of remote sensing.
We have presented a new unsupervised classification scheme, de-rived from the mean shift theorem, that better addresses the com-putational load of remote sensing data. It is an extended ver-sion of one of the simplest and most frequently used unsuper-vised classification method that solves the well-known clustering problem : the K-means algorithm. Our two-pass method follows a simple and easy way to classify a given data set into a certain number K of clusters that is automatically determined via a fast Mean Shift mode seeking procedure. Thus, it is a cooperative approach of K-means and fast Mean-Shift clustering algorithms that significantly alleviates the major weaknesses of the standard K-means algorithm. When compared to the classical PAMS al-gorithm, our technique is better in terms of classification quality. The improvement in classification is significant both visually and statistically. The whole classification process is performed in a few seconds for image tiles of around1000×1000pixels making this technique a viable alternative to traditional classifiers. The time required to perform the mode seeking and clustering steps is nearly linear in the size of the data set. Thus, it is almost as fast as the standard K-means algorithm while providing compa-rable classification accuracy to the general Mean-Shift algorithm which has a quadratic computational complexity.
Future work will focus on the proper and automatic selection of the radiometric bandwidthhr to provide a more accurate clus-ter delineation and achieve a more complete solution towards au-tonomous image classification. Furthermore, the radiometric res-olutionhr should be adapted to each spectral band, to take into account the spectral distribution variability. The combination of multiple bands may yield then more desirable results. Finally, a hierarchical clustering approach has the potential to improve the current mapping performance.
ACKNOWLEDGEMENTS
This research was supported by the Australian Commonwealth Environment Research Fund -Landscape Logichub. The au-thors acknowledge the Department of Sustainability and Environ-ment (DSE) of Victoria (Australia) for the high resolution near-infrared aerial photography.
REFERENCES
Bo, S., Ding, L., Li, H., Di, F. and Zhu, C., 2009. Mean shift-based clustering analysis of multispectral remote sensing im-agery. International Journal of Remote Sensing 30(4), pp. 817– 827.
Chehata, N., Orny, C., Boukir, S. and Guyon, D., 2011. Object-based forest change detection using high resolution satellite im-ages. In: PIA’2011, ISPRS Photogrammetric Image Analysis Conference, International Archives of Photogrammetry, Remote Sensing and Spatial Information Sciences, Munich, Germany, Vol. 38number 3, pp. 49–54.
Comaniciu, D. and Meer, P., 2002. Mean shift : A robust ap-proach toward feature space analysis. IEEE Transactions on pat-tern analysis and machine intelligence 24(5), pp. 603–619. DeMenthon, D., 2002. Spatio-temporal segmentation of video by hierarchical mean shift analysis. In: IEEE Statistical Methods in Video Processing Workshop, Washington, DC, USA.
Duda, R., Hart, P. and Stork, D., 2001. Pattern Classification. 2nd edn, Wiley-Interscience.
Farmer, E., Reinke, K. J. and Jones, S. D., 2011. A current per-spective on australian woody vegetation mapping and its implica-tions for small remnant patches. Journal of Spatial Science 56(2), pp. 223–240.
Fukunaga, K. and Hostetler, L., 1975. The estimation of the gra-dient of a density function, with applications in pattern recogni-tion. IEEE Transactions on Information Theory 1, pp. 32–40. Guo, L., 2008. Remotely sensed data classification. Technical report, EGID Institute, Bordeaux 3 University, France.
Jain, A., Murty, M. and Flynn, P., 1999. Data clustering: a review. ACM Computing Surveys 31(3), pp. 264–323.
Lu, D. and Weng, Q., 2007. A survey of image classifica-tion methods and techniques for improving classificaclassifica-tion perfor-mance. International Journal of Remote Sensing 28(5), pp. 823– 870.
Pal, S. K. and Mitra, P., 2004. Pattern Recognition Algorithms for Data Mining. 1 edn, Chapman & Hall/CRC. ISBN-10: 1584884576.
Pooransingh, A., Radix, C. and Kokaram, A., 2008. The path assigned mean shift algorithm: A new fast mean shift implemen-tation for colour image segmenimplemen-tation. In: ICIP’2008, 15th IEEE Int. conf. on Image Processing, San Diego, CA, pp. 597 – 600. Tso, B. and Mather, P., 2001. Classication methods for remotely sensed data. Taylor & Francis.
Wang, Y., Soh, Y. and Shultz, H., 2006. Individual tree crown segmentation in aerial forestry images by mean shift clustering and graph-based cluster merging. Computer Science and Net-work Security.
(a) PAMS algorithm
(b) New combined algorithm (PAMS & K-means)
Figure 2: Unsupervised classification of paddock field aerial im-age (NIR band)
(a) PAMS algorithm
(b) New combined algorithm (PAMS & K-means)