On: 27 September 2013, At: 00:56 Publisher: Routledge
Informa Ltd Registered in England and Wales Registered Number: 1072954 Registered office: Mortimer House, 37-41 Mortimer Street, London W1T 3JH, UK
Accounting and Business Research
Publication details, including instructions for authors and subscription information:
http://www.tandfonline.com/loi/rabr20
On the relation between corporate
governance compliance and operating
performance
Heidi Vander Bauwhede ab a
Ghent University b
Department of Accounting&Information Management, Maastricht University, P.O. Box 616, Maastricht, 6200, MD, Netherlands E-mail: Published online: 04 Jan 2011.
To cite this article: Heidi Vander Bauwhede (2009) On the relation between corporate governance compliance and operating performance, Accounting and Business Research, 39:5, 497-513, DOI: 10.1080/00014788.2009.9663380
To link to this article: http://dx.doi.org/10.1080/00014788.2009.9663380
PLEASE SCROLL DOWN FOR ARTICLE
Taylor & Francis makes every effort to ensure the accuracy of all the information (the “Content”) contained in the publications on our platform. However, Taylor & Francis, our agents, and our licensors make no representations or warranties whatsoever as to the accuracy, completeness, or suitability for any purpose of the Content. Any opinions and views expressed in this publication are the opinions and views of the authors, and are not the views of or endorsed by Taylor & Francis. The accuracy of the Content should not be relied upon and should be independently verified with primary sources of information. Taylor and Francis shall not be liable for any losses, actions, claims, proceedings, demands, costs, expenses, damages, and other liabilities whatsoever or howsoever caused arising directly or indirectly in connection with, in relation to or arising out of the use of the Content.
On the relation between corporate
governance compliance and operating
performance
Heidi Vander Bauwhede
*Abstract—Better corporate performance has been cited as one of the main benefits of adopting good corporate governance structures within organisations. However, in contrast to theory, a prior European study (Bauer et al., 2004) reports evidence of a negative relationship between corporate governance and corporate performance. This study re-examines this relationship, and reports evidence of a positive relationship between the extent of compliance with international best practices concerning board structure and functioning and operating performance when operating performance is measured by the return on assets (ROA). This result is robust to controlling for thefirms’compliance with best practices in other governance areas, and holds for some other governance dimensions, namely disclosure of corporate governance and the range of takeover defences. Further tests indicate that greater compliance with international best practices concerning board structure and functioning is significantly associated with reporting less income from asset disposals and that studying a performance measure that includes this item obscures the inherently positive relationship between operating performance and the extent of compliance with international best practices regarding board structure and functioning. The results provide some support for an often-cited motivation for the adoption of good governance practices, and provide explicit evidence that the measure of operating performance is crucial in examiningfirm-level operating performance.
Keywords:corporate governance; operating performance
1. Introduction
This paper examines the relationship between corporate governance compliance and operating performance for a set of large listed European companies. My focus is on compliance with international best practice in corporate governance. Following Jensen (1993) and prior governance research, I hypothesise that greater compliance with international corporate governance best practices and, more specifically, best practices concerning the structure and functioning of the board, is associated with better operating performance,ceteris paribus. I investigate the relationship between corporate governance compliance and operating performance for a sample of European companies in 2000–2001, because, during that period, there remained consid-erable variation in corporate governance practices
(see Wójcik, 2006; Bauer et al., 2008), notwith-standing that there were pressures from, for example, institutional investors or cross-listings to comply with international corporate governance best practices and that in some countries local codes were, de facto, mandatory.1,2
The study focuses on operating performance, and not stock market performance, in order to investi-gate further the result of a prior European study (Bauer et al., 2004) on the relation between compliance with best practices concerning corpor-ate governance and operating performance which seems to conflict with both theory as well as prior American results. More specifically, Bauer et al. (2004) report evidence of a negative relationship between ratings on the extent of compliance with international best practices and firm operating
*The author is at Maastricht University and at Ghent
University. She also has an affiliation to Katholieke Universiteit Leuven. She gratefully acknowledges Ping-Sheng Koh, Kevin McMeeking, Piet Sercu, Konstantinos Stathopoulos, participants at the 2006 European Accounting Association Annual Conference (Dublin, Ireland), the editor and two anonymous reviewers for useful comments. She also thanks Deminor for providing the governance data. The usual disclaimer applies.
Correspondence should be addressed to Dr Heidi Vander Bauwhede, Maastricht University, Department of Accounting & Information Management, P.O. Box 616, Maastricht, 6200 MD, Netherlands.
E-mail: [email protected]. This paper was accepted for publication in July 2009.
1I refer to a study commissioned by the European
commis-sion (Weil et al., 2002) and to the website of the European Corporate Governance Institute (http://www.ecgi.org/codes/ all_codes.php) for an overview of the corporate governance codes in the European Union. International governance codes are, for example, those established by the International Corporate Governance Network (ICGN), and the Organisation for Economic Co-operation and Development (OECD).
2
Some countries (such as the UK and Italy) required companies to disclose whether they complied with a (national) corporate governance code under a ‘comply or explain’ approach. This approach requires firms to disclose whether (and to what extent) they comply with a particular corporate governance code and, if they do not (fully) comply, to explain why they do not comply.
performance, whereas theory (Jensen, 1993), pre-dicts a positive relationship3and a prior American study (Larcker et al., 2005)finds some (albeit weak) evidence of a positive relationship. I primarily focus on board structure and functioning, and not on other dimensions of corporate governance (such as, for example, rights and duties of shareholders and range of takeover defences), because it is especially the structure and functioning of the board that can directly affect the operating efficiency and operat-ing performance of a company. However, for completeness, I also perform and report the results of some additional analyses on the relation between other dimensions of corporate governance andfirm operating performance.
I use a sample of European listed companies for which a private rating agency issues a firm-level rating of the extent of compliance with inter-national best practices concerning board structure and functioning. Results of univariate and multi-variate tests indicate that the one-year ahead return on assets (ROA) increases in the extent of compliance with international best practices con-cerning board structure and functioning. Tests show that the results are not affected by the potential endogeneity of the extent of governance compliance. In addition, the results are robust to controlling for the firms’ compliance with best practices in other governance areas, such as rights and duties of shareholders and range of takeover defences, and to controlling for country-level performance. Moreover, I also find a positive relation between the extent of compliance with recommendations in some other governance dimensions, more specifically disclosure on cor-porate governance and range of takeover defences, andfirm operating performance.
Further, additional analyses indicate that greater compliance with international best practices con-cerning board structure and functioning is signifi -cantly associated with reporting less income from asset disposals and that studying a performance measure that includes the income from asset disposals, such as the return on equity (ROE) or net profit margin (NPM) used by Bauer et al. (2004), instead of a performance measure which is not impacted by the income from asset disposals, such as the return on assets (ROA), obscures the inherently positive relationship between operating performance and the extent of compliance with
international best practices regarding board struc-ture and functioning.
This study contributes to the literature on the relation between corporate governance and corpor-ate performance. A first contribution is that the study reports a positive relation between the extent of compliance with international best practices on various governance dimensions (board structure and functioning, disclosure on corporate govern-ance) and the operating performance of European companies. A second contribution is that this study reports evidence which indicates that the unex-pected negative relationship between corporate governance compliance and operating performance as reported by Bauer et al. (2004)4is due to poorly-governed companies using the available discretion over the timing of asset sales to cover up their inherently lower operating performance. The key difference between this study and that of Bauer et al. (2004) is that the return on assets is introduced as the preferred measure of operating performance because the income measure used in computing the return on assets, i.e. operating income, is less influenced by discretionary items than the income measure used to compute the return on equity or net profit margin, i.e. income before extraordinary items. The return on equity and net profit margin are the performance measures used by Bauer et al. (2004).
The remainder of the paper is organised as follows. The next section develops the main research hypothesis. Section 3 describes the sample and data. Section 4 presents the empirical model. Section 5 presents the empirical results. Section 6 concludes.
2. Hypothesis development
The various corporate governance codes that have been issued since the late 1990s often refer to better performance as one of the key benefits of adopting their corporate governance recommendations. This performance can be understood as better market performance (i.e. higher stock returns or firm
3
Bauer et al. (2004)find indications of a positive relationship between governance ratings, and stock returns andfirm value, respectively.
4
Examples of other studies that have examined the relation between governance and performance using samples from other countries (for example, the US, Australia, and various Asian and some (individual) European countries), and using and focusing on a variety of governance attributes and performance measures, are: Larcker et al. (2006), Black et al. (2006), Brown and Caylor (2006a), Brown and Caylor (2006b), Durnev and Kim (2005), Larcker et al. (2005), Alves and Mendes (2004), Bebchuk et al. (2004), Klapper and Love (2004), Drobetz et al. (2004), Kiel and Nicholson (2003), Bhagat and Black (2002), Yermack (1996), and Klein (1998).
value)5 or as better operating performance. The expected relationship between compliance with corporate governance recommendations and oper-ating performance is based on the argument that firms with a better governance structure operate more efficiently which increases their operating performance (see, for example, Jensen, 1993). However, results of previous studies on the relation between governance and operating performance are mixed. Larcker et al. (2005), for example,find some evidence of a positive relationship between an overall governance metric (The Corporate Library Board Effectiveness Rating) and the one-year ahead ROA for a set of large listed American companies. By contrast, Bauer et al. (2004) find a negative relationship between an overall governance score and operating performance for large European companies.
As with any governance study, a crucial element in examining the relationship between governance and performance is how one defines and measures ‘better governance’. In this study, I use a rating, issued by a private rating agency (Deminor rating),6 that assesses the extent to which large listed European firms comply with international best practices concerning corporate governance and, more specifically, the extent to whichfirms comply with international best practices concerning board structure and functioning.7 Higher compliance is implicitly assumed to be better governance. However, this is not necessarily true. Afirst reason is that European companies may have adopted governance mechanisms and practices that differ from the internationally accepted best practices, but are better tailored to the specific context in which they operate. However, it is probably also true that
there is less need for governance practices tailored to local contexts for the largest companies in Europe, which operate globally instead of locally. Whether large listed European companies benefit from compliance with international best practices, and then specifically in terms of higher operating performance, is ultimately an empirical question. Another reason why higher compliance is not necessarily better governance is that the best practices identified by Deminor are not always unequivocally related to better governance. For example, evidence on whether CEO duality is bad governance and board diversity is good governance, is mixed (see, for example, Sonnenfeld, 2004; Massa and Simonov, 2007).8In order to refine the analysis I focus on the dimension of corporate governance which is particularly likely to directly influence operating efficiency and operating per-formance, i.e. the structure and functioning of the board of directors.9As Jensen (1993: 862–863) puts it, ‘The board, as the apex of the internal control system, has thefinal responsibility for the function-ing of thefirm. Most importantly, it sets the rules of the game for the CEO. The job of the board is to hire,fire, and compensate the CEO, and to provide high-level counsel’and‘. . . the very purpose of the internal control mechanism is to provide an early warning system to put the organisation back on track before difficulties reach a crisis stage.’Jensen (1993) then also attributes the weak corporate performance from the early 1990s to problems with the internal control activity (Jensen, 1993: 352) in the 1980s, which, in turn, stemmed from problems with the board of directors (Jensen, 1993: 862).
The major threat to a well-functioning board, and strong operating performance, is that the board is dominated by managers (especially in Anglo-Saxon countries) or majority shareholders (especially in continental European countries) who act in their own interest (instead of in the interest of all stakeholders), and cover up any underperformance by earnings management or manipulation to appease (minority) shareholders. Jensen (1993: 869) then also recognises that characteristics such as, for example, high-equity ownership by man-agers and board members, a small board, not many insiders on the board, and a CEO which is not the chairman of the board, are key elements of a well-functioning governance system, which limits self-interested behaviour by managers, uncovers bad performance in time and takes the necessary actions 5
Examples of studies that have examined aspects of corpor-ate governance and market performance in an American setting are Yermack (1996), Bhagat and Black (2002), Gompers et al. (2003) and Bebchuk et al. (2004). Beiner et al. (2006), Alves and Mendes (2004), Drobetz et al. (2004) and Kiel and Nicholson (2003) are examples of governance-market perform-ance studies using samples of Swiss, Portuguese, German and Australian companies, respectively.
6In Section 3, I provide more detail on the rating. 7
Most governance studies use either a single indicator of governance, or an‘arbitrary’index. Larcker et al. (2006) argue that measurement error in these governance metrics may be partly responsible for the mixed results on the association between the typical measures of corporate governance and accounting and economic outcomes. Nevertheless, I prefer to use the ratings issued by an independent rating agency as measures of governance compliance since these are publicly available and easily accessible for market participants. The aim of the study is to see whether these publicly available measures of the extent of compliance with international best practices are related to future operating performance and can as such signal future operating performance to market participants, who can, in turn, use this information for decision making.
8I thank one of the anonymous reviewers for this observation. 9
For completeness, I later expand the analyses to governance dimensions other than board structure and functioning. The results are reported in Section 5.4.
to ‘put the organisation back on track’ (Jensen, 1993: 863). These key elements of a well-function-ing board mentioned by Jensen (1993) are all covered by the international best practices concern-ing board structure and functionconcern-ing. Therefore, I expect that higher compliance with international best practices concerning board structure and functioning is related to better operating perform-ance.
Although greater compliance with international best practices concerning rights and duties of shareholders and range of takeover defences may increase the pressure by investors and the market for corporate control on companies to perform well, it is less straightforward that this greater compliance with international best practices concerning rights and duties of shareholders and range of takeover defences is per se related to better underlying operating performance, for in the absence of a well-functioning board, managers and majority share-holders could still act in their own self-interest, underperform, and cover up weak performance by earnings management or manipulation.10,11 This leads to the following hypothesis:
H1: A company’s operating performance increases in the extent of compliance with international best practices concerning board structure and functioning,ceteris paribus.
3. Sample and data
This study uses ratings of compliance with inter-national best practices regarding board structure and functioning which are supplied by a private rating agency, Deminor Rating. Deminor Rating (a sub-sidiary of Deminor International) releases, since March 2001, corporate governance ratings on the companies of the FTSE Eurotop 300 index.12,13The ratings are based on over 300 corporate governance indicators, which were identified after consulting
institutional investors. The indicators can be div-ided into four categories: rights and duties of shareholders, range of takeover defences, disclosure on corporate governance and board structure and functioning. Deminor Rating issues a rating of each one of the four categories. This study focuses on the rating regarding board structure and functioning. This rating covers indicators on the election of members of the company’s bodies, composition of the board, functioning of the board, remuneration of the company’s bodies and committees of the board. Ratings are assigned by senior analysts from the different European offices of Deminor after all the most recent publicly available information on a particular company (i.e. not onlyfinancial reports, but also articles of association, agendas, resolutions and minutes of ordinary and extra-ordinary general meetings, investor’s handbooks and newsletters, internet-sites and all other publicly available infor-mation) has been benchmarked against the best practice found in internationally accepted stand-ards. Those internationally accepted standards are established by, for example, the International Corporate Governance Network (ICGN) and the Organisation for Economic Co-operation and Development (OECD). A rating is measured on a scale of 5 to 1, with 5 representing the best practice (Deminor Rating, 2001: 9–10).
The sample studied in this paper consists of all companies from the FTSE Eurotop 300 for which there is a Deminor rating of board structure and functioning for the year 2000 and/ or 2001, as well as complete information on the other variables in the model.14I excludefinancial companies (FTSE industry sector code 80) because their financial structure is distinct from other companies and they are often subject to special rules and recommenda-tions. I delete observations with extreme observa-tions (i.e. values outside the 5thand 95thpercentile) for the ratios in the model, namely leverage and the three measures of operating performance (i.e. ROA, ROE and NPM), for ratios easily take on extreme values. The final sample exists of 201 firm-year observations (from 118 different companies). Table 1, Panels A and B give a breakdown of the observations by industry sector and by country, respectively.
I obtain financial statement data from Worldscope.
10
De Angelo (1988), for example, reports that, during an election campaign, managers exercise accounting discretion to portray a favourable earnings picture to voters.
11
As concerns disclosure on corporate governance, it is straightforward that mere disclosure per se cannot improve the operating performance of a company. However, the level of disclosure is highly positively correlated with the quality of the structure and the functioning of the board: companies with well-structured and -functioning boards have no problem in disclos-ing this information, while companies with badly-structured and
–functioning boards are less transparent about this. A positive association between high disclosure and good operating performance is then probably also due to a well-structured and well-functioning board than to the level of disclosure per se.
12On 25 May 2005, Deminor announced that it had sold its
corporate governance unit Deminor Rating to Institutional Shareholder Services (ISS).
13
Some other studies that have used Deminor data are Bauer et al. (2008), Bauer et al. (2006), Wόjcik (2006), Wόjcik et al. (2005), and Bauer et al. (2004).
14
The item that is most frequently missing is the Deminor governance rating. This rating is missing because not all FTSE Eurotop 300firms are followed by Deminor.
Table 1
Sample description
Panel A: Breakdown of sample by industry#
Industry code Industry description Number offirms % Number offirm-years %
4 Mining 2 1.69 3 1.49
7 Oil & Gas 6 5.08 10 4.98
11 Chemicals 9 7.63 15 7.46
13 Construction & Building Materials 6 5.08 11 5.47
15 Forestry & Paper 1 0.85 2 1.00
21 Aerospace 3 2.54 5 2.49
24 Diversified Industrials 3 2.54 4 1.99
25 Electronic & Equipment 7 5.93 12 5.97
26 Engineering and Machinery 7 5.93 12 5.97
31 Automobiles 8 6.78 16 7.96
34 Household Goods & Textiles 4 3.39 8 3.98
41 Beverages 2 1.69 4 1.99
43 Food Producers & Processors 4 3.39 7 3.48
44 Health 1 0.85 1 0.50
47 Personal Care & Household Products 2 1.69 3 1.49
48 Pharmaceuticals 4 3.39 8 3.98
49 Tobacco 2 1.69 4 1.99
52 General Retailers 7 5.93 11 5.48
53 Leisure, Entertainment & Hotels 2 1.69 3 1.49
54 Media & Photography 9 7.63 15 7.46
58 Support Services 3 2.54 5 2.49
59 Transport 1 0.85 1 0.50
63 Food & Drug Retailers 4 3.39 8 3.98
67 Telecommunication Services 6 5.08 8 3.98
72 Electricity 8 6.78 14 6.97
73 Gas Distribution 2 1.69 4 1.99
78 Water 1 0.85 1 0.50
93 Information Technology Hardware 2 1.69 3 1.49
97 Software & Computer Services 2 1.69 3 1.49
Total 118 100 201 100
#Following the FTSE Global Classification System.
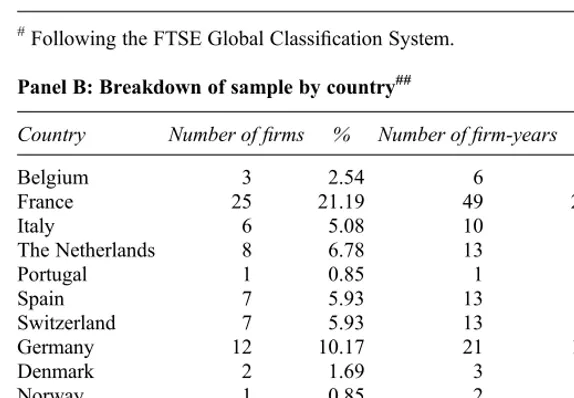
Panel B: Breakdown of sample by country##
Country Number offirms % Number offirm-years %
Belgium 3 2.54 6 2.99
France 25 21.19 49 24.38
Italy 6 5.08 10 4.98
The Netherlands 8 6.78 13 6.47
Portugal 1 0.85 1 0.50
Spain 7 5.93 13 6.47
Switzerland 7 5.93 13 6.47
Germany 12 10.17 21 10.45
Denmark 2 1.69 3 1.49
Norway 1 0.85 2 1.00
Sweden 8 6.78 12 5.97
Finland 1 0.85 2 1.00
Ireland 1 0.85 2 1.00
UK 36 30.51 54 26.87
Total 118 100 201 100
##All but two countries in the sample (Switzerland and Norway) are member of the European Union. All other countries, but the UK, Denmark and Sweden are part of the Eurozone or EMU (i.e. Europe’s European and Monetary Union).
4. Research design and model speci
fi
cation
I test the relationship between the extent of compliance with international best practices con-cerning corporate governance, and more specifi c-ally board structure and functioning, and the operating performance of large listed European companies by estimating the following operating performance model:
Performanceit¼b0þb1CG COMPitþb2LEVit
þb3LNTAitþb4Y2001itþb5Xit
þeit ð1Þ
where:
Performanceit = ROA, where: ROA is one-year ahead return on assets forfirm i in year t;
CG_COMPLit = a rating proxying for the extent of compliance with international best practices regarding board structure and functioning for firm i in year t;
LEVit = leverage, as measured by the sum of short-term and long-term debt divided by total assets, forfirm i in year t;
LNTAit = the natural logarithm of total assets forfirm i in year t;15,16 Y2001it = indicator variable which takes one
if the observation is from 2001, and zero if the observation is from 2000;
Xit = a vector of industry dummies, i.e. indicator variables for the (two-digit) industry codes of the FTSE Global Classification system.
I measure the dependent variable in the operating performance model, i.e. one-year aheadfirm-level operating performance, by the one-year ahead ROA. I use the one-year ahead, instead of the contemporaneous, ROA to make sure that the governance systems described by the ratings are in place and operational at the moment that I start measuring operating performance. Consistent with prior studies (e.g. Larcker et al., 2006), ROA is measured as operating income divided by average total assets.17 For comparison, I also perform
analyses in which I replace the one-year ahead ROA with the one-year ahead ROE and the one-year ahead NPM, because the ROE and the NPM were used as performance measures in the study by Bauer et al. (2004). The ROE is measured as earnings before extraordinary items dividend by the average book value of stockholders’ equity, and net profit margin is the ratio of earnings before extraordinary items divided by sales (see, for example, Gompers et al., 2003). As argued by Core et al. (2006) and Barber and Lyon (1996), the ROA is clearly the preferred measure of operating performance because it is less affected by discretionary items than the ROE and the NPM. This implies that I expect a stronger relationship between the extent of compliance with international best practices con-cerning board structure and functioning and the one-year ahead ROA, than between the extent of compliance and the year ahead ROE or the one-year ahead NPM. I will further refer to the three models as the ROA model, the ROE model and the NPM model.
The test variable is a measure of the level of compliance with international best practices con-cerning corporate governance, and more specifi c-ally best practices concerning board structure and functioning (CG_COMPL). CG_COMPL is prox-ied by Deminor’s rating of board structure and functioning. The rating takes a value from 1 to 5 with 5 indicating the highest compliance with international best practice. A positive sign on CG_COMPL indicates that greater compliance with best practices concerning board structure and functioning is related to better operating perform-ance, and is consistent with the hypothesis. I further include in the regression leverage (LEV), computed as the sum of short-term and long-term debt over total assets, to control for the well-known impact of leverage on ROE, the natural logarithm of total assets (LNTA) as a measure of firm size, a year dummy (Y2001) to control for the impact of the general macro-economic context on individualfirm performance, and a vector of industry dummies.
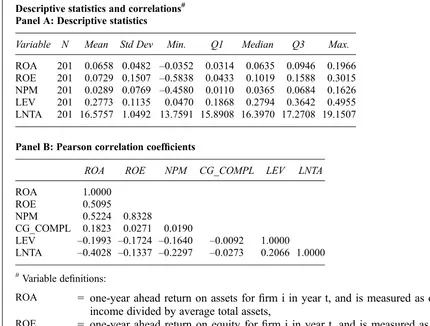
5. Descriptive statistics and results
5.1. Descriptive statisticsTable 2, Panel A, presents descriptive statistics for the dependent and independent variables of the operating performance model. Table 2, Panel A, shows that the mean one-year ahead ROA is about 6.6% (median 6.4%). The mean one-year ahead ROE is higher, and about 7.3% (median 10.2%). The mean one-year ahead NPM amounts to 2.9% (median 3.7%). Mean and median leverage is about 28%.
15
Total assets are measured in thousands of Euros. Values initially stated in a local currency are converted to Euros by using the exchange rate at the balance sheet date.
16
I use the natural logarithm because I do not expect a linear relationship between operating performance andfirm size.
17
The average is computed as the sum of the value at the beginning of the accounting period and the value at the end of the accounting period, divided by two.
Table 2, Panel B, presents the Pearson correlation coefficients between the dependent and independ-ent variables of the operating performance model. The dependent variables, one-year ahead ROA, one-year ahead ROE and one-year ahead NPM are all positively correlated with CG_COMPL. However, only the correlation of ROA and CG_COMPL is significant. The highest absolute value of the correlations among the independent variables is 0.21, which indicates that the regression results are not affected by multicollinearity.
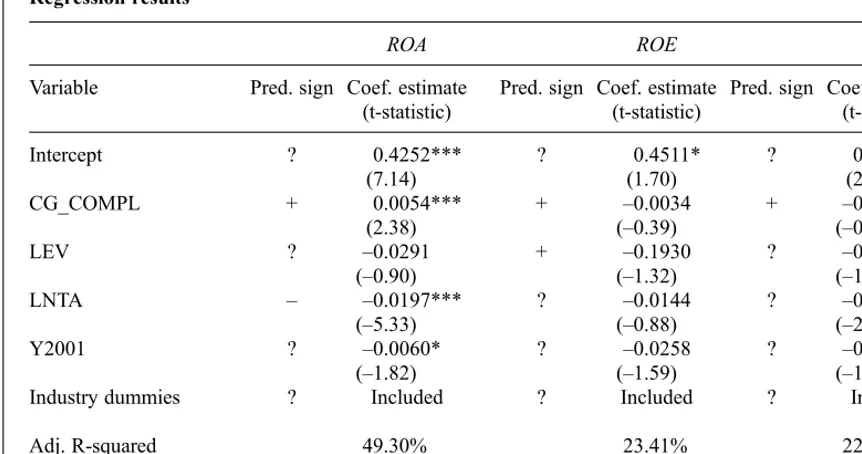
5.2. Regression results
I estimate the performance model using ordinary least squares (OLS). A concern in testing the relation between the extent of compliance with international best practices concerning corporate governance, and more specifically board structure and functioning, and the operating performance of large listed European companies is thatfirms with
good prospects may self-select into the group with stronger governance structures, while firms with poor prospects may self-select into the group with weaker governance structures. If this is indeed true, the OLS parameter estimates are inconsistent. However, the results of a Hausman-like test for endogeneity as described in Gujarati (2003: 713) show that CG_COMPL is not endogenous with respect to any of the dependent variables (p on the fitted value of CG_COMPL > 0.10, two-sided). For the endogeneity test, I used the followingfirst stage model (governance compliance model), which is based on prior empirical disclosure and governance studies (see, for example, Pincus et al., 1989 and Willekens et al., 2004):
CG COMPLit¼g0þg1FFLOATitþg2LEVit
þg3ROACitþg4LNTAit þg5Yitþg6Zitþmit; ð2Þ Table 2
Descriptive statistics and correlations# Panel A: Descriptive statistics
Variable N Mean Std Dev Min. Q1 Median Q3 Max.
ROA 201 0.0658 0.0482 –0.0352 0.0314 0.0635 0.0946 0.1966 ROE 201 0.0729 0.1507 –0.5838 0.0433 0.1019 0.1588 0.3015 NPM 201 0.0289 0.0769 –0.4580 0.0110 0.0365 0.0684 0.1626 LEV 201 0.2773 0.1135 0.0470 0.1868 0.2794 0.3642 0.4955 LNTA 201 16.5757 1.0492 13.7591 15.8908 16.3970 17.2708 19.1507
Panel B: Pearson correlation coefficients
ROA ROE NPM CG_COMPL LEV LNTA
ROA 1.0000
ROE 0.5095
NPM 0.5224 0.8328
CG_COMPL 0.1823 0.0271 0.0190
LEV –0.1993 –0.1724 –0.1640 –0.0092 1.0000 LNTA –0.4028 –0.1337 –0.2297 –0.0273 0.2066 1.0000
#Variable definitions:
ROA = one-year ahead return on assets for firm i in year t, and is measured as operating income divided by average total assets,
ROE = one-year ahead return on equity for firm i in year t, and is measured as earnings before extraordinary items divided by the average book value of stockholders’ equity,
NPM = one-year ahead net profit margin for firm i in year t, and is measured as earnings before extraordinary items divided by sales revenues
LEV = ratio of short-term debt plus long-term debt over total assets forfirm i in year t LNTA = natural logarithm of total assets forfirm i in year t
CG_COMPL = score from 1 to 5 with higher scores indicating greater compliance offirm i in year t with international best practice concerning board structure and functioning
where: FFLOATit= the freefloat offirm i in year t; ROA_Cit = the contemporaneous return on assets for firm i in year t; Yit = a vector of country dummies, i.e. indicator variables for the country of domicile of thefirms in the sample; Zit= a vector of other exogenous variables from the operating performance model (i.e. second stage regression). The other variables are as defined in Equation (1). Re-performing the endogeneity tests (1) deleting the contemporaneous return on assets in the first stage regression, or (2) replacing the contemporan-eous return on assets with the past return on assets in thefirst stage regression confirm that CG_COMPL is not endogenous with respect to any of the dependent variables. This contrasts with results in Renders and Gaeremynck (2006), and is most likely due to differences in research design. More specif-ically, to be sure that the corporate governance systems are in place and operational at the moment that I start measuring operating performance, I use one-year ahead operating performance measures (instead of contemporaneous operating perform-ance measures).
As there are two years of data, there are repeated observations on some companies. Although obser-vations are still independent acrossfirms, they are no longer independent withinfirms. Therefore, the t-values are adjusted to control for within-company dependence by using clustered robust standard errors.18
Table 3 reports the results of the OLS regression analyses. Columns 3, 5, and 7 show the results of models that use the year ahead ROA, the one-year ahead ROE and the one-one-year ahead NPM as the dependent variable, respectively. Table 3 shows that the performance models have explanatory power (adjusted R2 of 49.30%, 23.41% and 22.11%, respectively). The coefficient on CG_COMPL is positive and significant at the 1% level (one-sided) in the ROA model. The magnitude of the CG_COMPL coefficient (0.0054) suggests a dif-ference of 2.16% in the realised one-year ahead ROA betweenfirms with the lowest and the highest rating of CG_COMPL (i.e. 4*0.54%). This result supports the hypothesis that operating performance is higher forfirms that comply to a greater extent with international best practices concerning board structure and functioning. Consistent with the argument that the one-year ahead ROA is the preferred measure of operating performance, the coefficient on CG_COMPL is not significant for the ROE and NPM models.
Table 3 further shows that the one-year ahead ROA and one-year ahead NPM decrease in size (LNTA). In addition, the industry dummies (not reported) are significant predictors of all three performance measures.19
5.3. Additional analyses
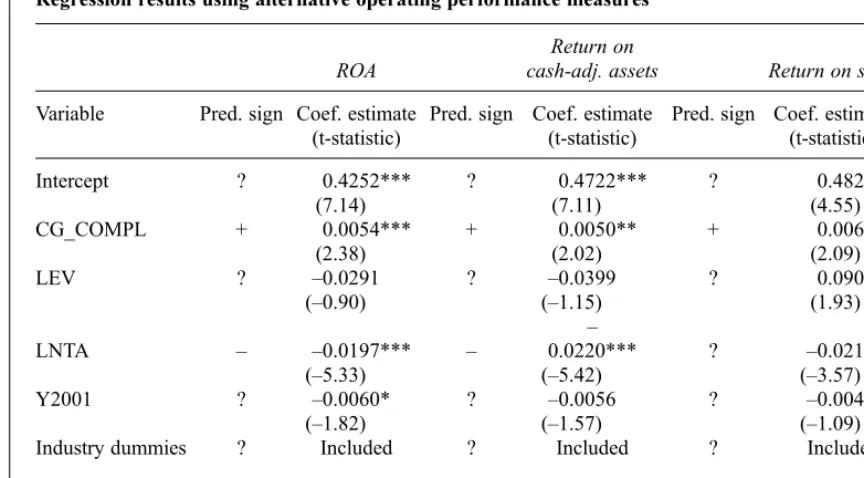
Other measures of operating performance
To confirm the evidence from the ROA model on the positive and significant relation between the extent of compliance with international best prac-tices concerning board structure and functioning and operating performance, I replace the one-year ahead ROA in the operating performance model with two alternative measures of operating per-formance, i.e. the one-year ahead return on cash-adjusted assets and the one-year ahead return on sales (ROS) (see Barber and Lyon, 1996). The return on cash-adjusted assets is measured by dividing operating income by the average cash-adjusted assets, i.e. total assets minus cash and cash equivalents. The ROS is operating income divided by sales. Table 4 reports the results of the operating performance regressions when using these alterna-tive operating performance measures. Table 4 also reports the results of the regression when using the one-year ahead ROA as the dependent variable for comparison. Table 4 shows that the results on the test variable (CG_COMPL) when using the alter-native operating performance measures are qualita-tively similar to the result when using the one-year ahead ROA.
Examining the difference in results between performance measures
The results in Tables 3 and 4 report a significantly positive relationship between the extent of compli-ance with international best practices concerning board structure and functioning (CG_COMPL) and performance for some performance measures (i.e. the one-year ahead ROA, the one-year ahead return on cash-adjusted assets and the one-year ahead ROS, all measures which use operating income in the numerator), but not for other performance measures (i.e. the one-year ahead ROE) and one-year ahead NPM, two measures which use income before extraordinary items in the numerator). Especially the difference in results when using the ROS and the NPM is striking, since the only difference between these two measures is the numerator. (The ROS uses operating income
18The results are qualitatively similar when not adjusting for
within company dependence.
19
Deleting the industry dummies from industries with only one observation (i.e. health, transport, and water) or all industry dummies does not change the results on the test variable.
whereas the NPM uses earnings before extraordin-ary items in the numerator. Both measures have sales revenues in the denominator.) This suggests that something that causes the difference between operating income and earnings before extraordinary items can explain why there is a significant relationship between performance and the extent of compliance with international best practices concerning board structure and functioning when using some performance measures, but not when using other performance measures. Some of the difference between operating income and earnings before extraordinary items is in interest payment and taxes. Moreover, given the Worldscope data definitions of operating income and earnings before
extraordinary items, some of the difference between the two income measures stems from allocations to and/or from reserves, from minority interests, from equity in earnings,20and from other non-operating income and expenses. These other non-operating income and expenses include items such as: non-operating interest income, non-non-operating dividend income, and the gain/ loss on disposal of assets, i.e. the income from asset disposals.
To further explore what causes the difference in the relationship between corporate governance Table 3
Regression results#
ROA ROE NPM
Variable Pred. sign Coef. estimate Pred. sign Coef. estimate Pred. sign Coef. estimate (t-statistic) (t-statistic) (t-statistic)
Intercept ? 0.4252*** ? 0.4511* ? 0.4142***
(7.14) (1.70) (2.87)
CG_COMPL + 0.0054*** + –0.0034 + –0.0023
(2.38) (–0.39) (–0.61)
LEV ? –0.0291 + –0.1930 ? –0.0702
(–0.90) (–1.32) (–1.2)
LNTA – –0.0197*** ? –0.0144 ? –0.0179**
(–5.33) (–0.88) (–2.04)
Y2001 ? –0.0060* ? –0.0258 ? –0.0106
(–1.82) (–1.59) (–1.10)
Industry dummies ? Included ? Included ? Included
Adj. R-squared 49.30% 23.41% 22.11%
N 201 201 201
Evidence of endogeneity No No No
#This table reports the results of the OLS estimation of the following regression model:
Performanceit¼b0þb1CGCOMPLitþb2LEVitþb3LNTAitþb4Y2001itþb5Xitþeit Where: Performanceit= ROA, ROE or NPM. ROA = one-year ahead return on assets forfirm i in year t, and is measured as operating income divided by average total assets; ROE = one-year ahead return on equity forfirm i in year t, and is measured as earnings before extraordinary items divided by the average book value of stockholders’equity; NPM = one-year ahead net profit margin forfirm i in year t, and is measured as earnings before extraordinary items divided by sales revenues; CG_COMPLit= score from 1 to 5 with higher scores indicating greater compliance offirm i in year t with international best practice concerning board structure and functioning; LEVit= ratio of short-term debt plus long-term debt over total assets forfirm i in year t; LNTAit= natural logarithm of total assets forfirm i in year t; Y2001it= year dummy, =1 when an observation is from 2001, zero otherwise; Xit= a vector of industry dummies based on the FTSE Global Classification System two-digit code for the industry sector.
*,** and *** denote statistical significance at the 10%, 5% and 1% level respectively and is based on a one-tailed test if the sign of the coefficient is in the predicted direction, and is based on a two-tailed test
otherwise. T-values are adjusted for within-company dependence by using clustered robust standard errors. Results on the two-digit industry dummies are not reported for parsimony.
20This represents the‘pretax portion of the earnings or losses
of a subsidiary whosefinancial accounts are not consolidated with the controlling company’s accounts’ (see Thomson Financial, 2003).
compliance (CG_COMPL) and performance when using the NPM instead of the ROS as the measure of performance, I compute the pairwise correlations between each one of the identified items which make up the difference between operating income and earnings before extraordinary income (scaled by sales) and the measure of corporate governance compliance (CG_COMPL).21I further adjust oper-ating income for each one of the items at a time and regress each one of the new income measures
(scaled by sales) on the measure of corporate governance compliance (CG_COMPL) and the control variables, i.e. I replace the dependent variable in the performance model with a new performance measure.
The results of these detailed analyses show that income from asset disposals22 (scaled by sales) is significantly negatively related to the extent of corporate governance compliance (CG_COMPL) (correlation coefficient =0.1869, p-value<0.01), Table 4
Regression results using alternative operating performance measures#
ROA
Return on
cash-adj. assets Return on sales
Variable Pred. sign Coef. estimate Pred. sign Coef. estimate Pred. sign Coef. estimate (t-statistic) (t-statistic) (t-statistic)
Intercept ? 0.4252*** ? 0.4722*** ? 0.4829***
(7.14) (7.11) (4.55)
CG_COMPL + 0.0054*** + 0.0050** + 0.0062**
(2.38) (2.02) (2.09)
LEV ? –0.0291 ? –0.0399 ? 0.0901*
(–0.90) (–1.15) (1.93)
LNTA – –0.0197*** –
–
0.0220*** ? –0.0212***
(–5.33) (–5.42) (–3.57)
Y2001 ? –0.0060* ? –0.0056 ? –0.0048
(–1.82) (–1.57) (–1.09)
Industry dummies ? Included ? Included ? Included
Adj. R-squared 49.30% 50.05% 47.90%
N 201 201 201
#This table reports the results of the OLS estimation of the following regression model:
Performanceit¼b0þb1CGCOMPLitþb2LEVitþb3LNTAitþb4Y2001itþb5Xitþeit Where: Performanceit= ROA, Return on cash-adjusted assets or Return on sales. ROA = one-year ahead return on assets forfirm i in year t, and is measured as operating income divided by average total assets; Return on cash-adjusted assets = one-year ahead return on cash-adjusted assets forfirm i in year t, and is measured as operating income divided by average (total assets minus cash and cash equivalents); Return on sales = one-year ahead return on sales forfirm i in year t, and is measured as operating income divided by sales revenues; CG_COMPLit= score from 1 to 5 with higher scores indicating greater compliance offirm i in year t with international best practice concerning board structure and functioning; LEVit= ratio of short-term debt plus long-short-term debt over total assets forfirm i in year t; LNTAit= natural logarithm of total assets forfirm i in year t; Y2001it= year dummy, =1 when an observation is from 2001, zero otherwise; Xit= a vector of industry dummies based on the FTSE Global Classification System two-digit code for the industry sector.
*,** and *** denote statistical significance at the 10%, 5% and 1% level respectively and is based on a one-tailed test if the sign of the coefficient is in the predicted direction, and is based on a two-tailed test
otherwise. T-values are adjusted for within-company dependence by using clustered robust standard errors. Results on the two-digit industry dummies are not reported for parsimony.
21
As the performance measures used in the primary analyses, these items and the newly computed performance measures are on a one-year ahead basis.
22The sample companies report a gain on disposal of assets in
64% of thefirm-years, a loss on disposal of assets in 22% of the
firm-years, and neither a gain nor a loss on disposal of assets in 14% of thefirm-years.
and that, once operating income is adjusted for the income from asset disposals and this measure scaled by sales is used as the measure of performance (i.e. the ‘new ROS’), the significant relationship between performance and corporate governance compliance (CG_COMPL), established when using the original ROS as the measure of performance, disappears. The coefficient is 0.0025, p-value > 0.10, one-sided, when using the new ROS, com-pared to a coefficient = 0.0062, p-value<0.05, one-sided, when using the original ROS (see Table 4).
Moreover, although some other items which make up the difference between operating income and earnings before extraordinary items are also negatively related to corporate governance com-pliance, none of the adjustments to operating income for these items makes the relationship between performance and the corporate govern-ance compligovern-ance insignificant like the adjustment for the income from asset disposals does. Taken together, the results of the additional analyses suggest that the income from asset disposals plays a major role in the disappearance of the significant relationship between performance and corporate governance compliance, once the NPM is used instead of the ROS as the measure of perform-ance.
Management has some discretion over the timing of asset sales and previous studies (Herrmann et al., 2003; Bartov, 1993) have shown that the timing of assets sales is used as an instrument to manage earnings. More specifically Bartov (1993)finds that companies use the timing of asset sales to smooth income, i.e. report a higher (lower) income from asset sales in years in which (pre-managed) income is lower (higher) compared to the previous year. Further analyses23indicate that this study’s sample companies present similar behaviour. Moreover, the extent of corporate governance compliance (CG_COMPL) is significantly negatively correlated with the occurrence of a lower (pre-managed) income compared to the previous year (correla-tion coefficient = 0.2076, p-value <0.01). That is, poorly governed companies underperform more often than well-governed companies. Consequently, one expects that poorly governed companies record a higher income from asset disposals than well-governed companies. The sig-nificantly negative correlation between the income from asset disposals (scaled by sales) and the
extent of corporate governance compliance (CG_COMPL) is consistent with this expectation. In sum, the results indicate that companies which comply less with international best practices con-cerning board structure and functioning try to make up their inherently lower performance by reporting a higher income from asset disposals (scaled by sales). The net result of this earnings management behaviour is that, once the income from asset disposals is included in the numerator of the performance measure, one no longer observes a significant relationship between operating perform-ance and the extent to which firms comply with international best practices concerning corporate governance.
To further examine whether the income from asset disposals can help explain that there is a significant relationship between performance and the extent of compliance with international best practices concerning board structure and function-ing when usfunction-ing some performance measures but not others, I replace in the performance model the original ROA, which uses operating income in the numerator, by a new ROA measure which uses operating income adjusted for the income from asset disposals in the numerator. The result of replacing the original ROA with this new ROA measure is that the coefficient on CG_COMPL becomes insignificant. The coefficient is 0.0027, p-value> 0.15, one-sided, when using the new ROA, compared to a coefficient = 0.0054, p-value<0.01, one-sided, when using the original ROA (see Table 3). This confirms the idea that the income from asset disposals plays a major role in explaining the differences in the significance of the relationship between operating performance and the extent of compliance with international best practices con-cerning board structure and functioning when using other performance measures.
Bauer et al. (2004) suggest that lacking man-agerial discretion to manipulate earnings is respon-sible for their observation that well-governed companies report lower performance (ROE and NPM) than poorly governed companies, but do not provide evidence to support this suggestion. The results of the above analyses confirm that manager-ial discretion is an important factor to consider when examining the relationship between corporate governance compliance and operating performance. More specifically, the results of the analyses are evidence: (1) that, in contrast to thefinding of Bauer et al. (2004), well-governed companies perform better than poorly governed companies, once examining performance measures which are less prone to managerial discretion (ROA or ROS); and 23
Consistent with the results of Bartov et al. (1993), the OLS estimation results of a regression of the income from asset disposals (scaled by sales) on: (1) the difference between the ROS and the prior period NPM; and (2)firm leverage show a significantly negative coefficient on the performance difference.
(2) that poorly governed companies exploit their discretion to manage bottom line earnings upwards to a level which is (relatively) similar to that of well-governed companies.
Code law versus common-law countries
Various elements of the institutional infrastructure, such as investor protection, differ between com-mon-law and code-law countries. These differ-ences were, in turn, found to be related to differences in, for example, the size of the capital markets (both equity and debt markets) (La Porta et al., 1997), ownership concentration (La Porta et al., 1998, and La Porta et al., 1999), information provision (see, for example, La Porta et al., 1998, Ball et al., 2000, Francis et al., 2003, Leuz et al., 2003), and the demand for auditing (Francis et al., 2003). I test whether the observed relation between the extent of compliance with international best practices regarding board structure and functioning and operating performance is present in both types of countries by estimating the operating perform-ance model on the subsamples of the code-law and law countries separately. The common-law countries in the sample are the UK and Ireland. The code-law countries are all other countries in the sample. The results for the code-law subsample (145 firm-year observations, 81 different companies) and common-law subsample (56 firm-year observations, 37 different com-panies) (not reported) are qualitatively similar to the results reported in Table 3, i.e. Ifind a positive, albeit somewhat less significant, relation between the extent of compliance with international best practices concerning board structure and function-ing and the one-year ahead ROA.
5.4. Robustness checks
The robustness of the results is tested to model specification. Ifirst replace the 28 two-digit industry dummies, which consume a lot of degrees of freedom given the size of the sample, with dummies for broader industry classes with at least 10firms per class. I formed the broader classes by using the one-digit classification and by redistributing the observations from one-digit classes with less than 10firms, i.e. mining, oil & gas (one-digit 0) and information technology (one-digit 9) to the other one-digit classes. The results of estimating these new operating performance models (not reported) are qualitatively similar to the results reported in Table 3.
As an additional check, I replace the dependent variables, i.e. the performance variables, with the industry median adjusted values, and deleted the
two-digit industry dummies from the operating performance model. The medians were computed per broader industry class. Results (not reported) are qualitatively similar to the results reported in Table 3.
Next, I test whether the results are robust to controlling for country-level performance differ-ences by including country dummies in the original operating performance model. I also estimate an operating performance model with inclusion of country dummies and replacement of the two-digit industry dummies by dummies for broader industry classes, and an operating performance model with inclusion of country dummies, exclusion of two-digit industry dummies and replacement of the dependent variables with their industry median adjusted values. The estimation results of all these alternative operating performance models show that the results on the test variable CG_COMPL (not reported) are qualitatively similar to the results reported in Table 3 for all three performance measures.
In the primary analyses, I use one-year ahead instead of contemporaneous performance meas-ures in order to make sure that the governance systems described by the ratings are in place and operational at the moment that I start measuring performance. To test whether the results depend on this specification, I reran the operating performance model using contemporaneous per-formance measures. The results on the test variable are similar to the results reported in Table 3.
To test whether the results are dependent on the measure offirm size, I replace the natural logarithm of total assets (LNTA) by the natural logarithm of market capitalisation. I explore the impact offirm history on the corporate governance–operating performance relation by including in the regression modelfirm age or book-to-market. The results on the test variable are qualitatively similar to the results reported in Table 3.
I further test whether the results for the operating performance model are not biased by correlated omitted corporate governance variables. If a vari-able which is related to both performance and the extent of compliance with international best prac-tices concerning board structure and functioning is omitted from the analyses, then this variable may actually cause the observed relation between per-formance and the extent of compliance with inter-national best practices concerning board structure and functioning, and we may wrongly conclude that the extent of compliance with international best practice regarding board structure and functioning
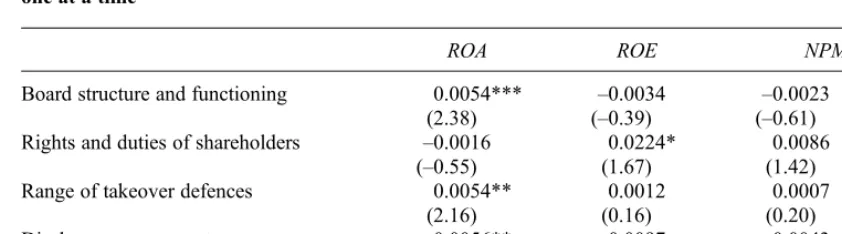
per se is related tofirm performance. A correlation matrix (not reported) shows that the extent of compliance with best practices in various other governance areas, such as rights and duties of shareholders,24 range of takeover defences,25and disclosure on corporate governance26 are signifi -cantly and positively related to thefirms’ compli-ance with best practices concerning board structure and functioning. Moreover, the results of estimating (using OLS) the basic regressions in which the variable board structure and functioning is replaced sequentially by,first, the Deminor rating of rights and duties of shareholders, next, the rating of takeover defences, andfinally, the rating of disclo-sure on corporate governance (see Table 5, Panel A) show that the rating of the range of takeover defences and the rating of disclosure on corporate governance are significantly correlated with the ROA. Consequently, the question arises whether the primary results suffer from correlated omitted variables bias, for the other dimensions of govern-ance are clearly linked to the test variable and the dependent variable ROA, but not included in the main analyses. To address this concern I expand the operating performance model with the rating of rights and duties of shareholders and the rating of takeover defences, in addition to the rating of board structure and functioning (i.e. the expanded oper-ating performance model). I do not include the rating of disclosure of corporate governance because the correlation coefficient between the disclosure rating and the rating of board structure and functioning is high (0.7927). This high correl-ation does not only suggest that both ratings contain very similar information, but also implies that the results of a regression including both ratings suffer from multicollinearity, which makes interpretation of the coefficient estimates difficult. Table 5, Panel B, reports the results of the expanded operating performance model. These results closely parallel the results from the primary operating performance
model as reported in Table 3, which suggests that the primary results are not biased by correlated omitted governance variables. More specifically, the rating of board structure and functioning remains positive and significant in the ROA model, while it remains insignificant in the ROE and NPM models. The results on the other two ratings, i.e. rights and duties of shareholder and range of takeover defences, parallel the results of the regressions in which each rating was included separately as reported in Table 5, Panel A.
By excluding the rating of disclosure on corpor-ate governance in the expanded operating perform-ance model there is still a possibility that the results in Table 3 and Table 5, Panel B are biased because of correlated omitted variables. In order to further address this concern, I also performed a principal component factor analysis27 on the four different ratings disclosed by Deminor, i.e. the rating of board structure and functioning, the rating of rights and duties of shareholders, the rating of takeover defences and the rating of disclosure on corporate governance. The solution is rotated using an orthogonal VARIMAX rotation. This analysis shows that the four ratings can be summarised in two underlying factors. (All factors with an eigenvalue greater than unity are retained.) As expected, the rating of board structure and func-tioning and the rating of disclosure on corporate governance load on factor 1. This confirms that both ratings contain very similar information. The rating of rights and duties of shareholders and the rating of takeover defences load on factor 2. The corres-ponding factors scores were computed (using the regression method) and the two factors scores were then introduced together in the basic regression (i.e. Regression (2)) for CG_COMPL. Table 5, Panel C, reports the results of these tests. As concerns the one-year ahead ROA, the results show that factor 1, but not factor 2, is positively and significantly correlated with this performance meas-ure (p<0.01). As concerns the one-year ahead ROE and the one-year ahead NPM, the results show that neither factor 1 nor factor 2 are significantly correlated with these performance measures. The results on the factor scores confirm the results reported in Table 3 and Table 5, Panels A and B.
In order to further investigate the overall impact of firms’ governance structures, I estimate an operating performance regression in which I replace the rating of board structure and functioning by a total rating (i.e. a total across the different govern-24
The rating of rights and duties of shareholders covers indicators concerning the respect of the share vote one-dividend principle, voting right restrictions, voting issues, shareholder proposals and voting procedures (Deminor, 2001: 7).
25
The rating of range of takeover defences covers indicators concerning the presence and strength of anti-takeover devices such as poison pills, golden parachutes, core shareholdings, extensive cross-shareholdings and co-option systems that could be used to protect the company from a hostile takeover and to disenfranchise shareholders (Deminor, 2001: 7).
26The rating of disclosure on corporate governance covers
indicators regarding the quantity and quality of non-financial information, such as the diversity and independence of board members, board committees, director remuneration, accounting standards, information on major shareholders of the company, and environmental information (Deminor, 2001: 7).
27Results are qualitatively similar when using a principal
factor method.
Table 5
Additional regression results#
Panel A: OLS coefficient estimates (and t-statistics) on the different governance ratings, included each one at a time
ROA ROE NPM
Board structure and functioning 0.0054*** –0.0034 –0.0023
(2.38) (–0.39) (–0.61)
Rights and duties of shareholders –0.0016 0.0224* 0.0086
(–0.55) (1.67) (1.42)
Range of takeover defences 0.0054** 0.0012 0.0007
(2.16) (0.16) (0.20)
Disclosure on corporate governance 0.0056** –0.0097 –0.0043
(2.27) (–1.18) (–1.09)
Panel B: OLS coefficient estimates (and t-statistics) on ratings included together in one model
ROA ROE NPM
Board structure and functioning 0.0046** –0.0073 –0.0041
(2.27) (–0.80) (–0.98)
Rights and duties of shareholders –0.0066** 0.0280** 0.0107
(–2.04) (2.00) (1.56)
Range of takeover defences 0.0060** –0.0052 –0.0013
(2.20) (–0.64) (–0.30)
Other regressors Included Included Included
Adj. R-squared 51.56% 25.54% 22.96%
N 201 201 201
Panel C: OLS coefficient estimates (and t-statistic) for factor scores
ROA ROE NPM
Factor 1 0.0094*** –0.0178 –0.0082
(2.69) (–1.42) (–1.47)
Factor 2 0.0008 0.0238 0.0097
(0.25) (1.63) (1.58)
Other regressors Included Included Included
Adj. R-squared 49.82% 25.46% 23.33%
N 201 201 201
Panel D: OLS coefficient estimates (and t-statistic) for overall governance rating
ROA ROE NPM
Total rating 0.0018** –0.0002 –0.0004
(2.03) (–0.06) (–0.29)
Adj. R-squared 49.12% 23.32% 21.99%
N 201 201 201
#This table reports the results of the OLS estimation of the following regression model:
Performanceit¼b0þb1CGCOMPLitþb2LEVitþb3LNTAitþb4Y2001itþb5Xitþeit
Where: Performanceit= ROA, ROE or NPM. ROA = one-year ahead return on assets forfirm i in year t, and is measured as operating income divided by average total assets; ROE = one-year ahead return on
ance dimensions) as disclosed by Deminor. The estimation results for that model are included in Table 5, Panel D. These results show that the total rating is significantly and positively related with the one-year ahead ROA, but is not significantly related with the one-year ahead ROE nor with the one-year ahead NPM.
Note that, notwithstanding that the performance model was carefully constructed based on theory and prior empirical evidence, and that the above tests indicate that the results of our primary analysis are robust to correlated omitted governance vari-ables, one can never exclude that there exists an unknown correlated factor which is omitted from the analyses and actually causes the relationship between performance and the extent of compliance with international best practices concerning board structure and functioning.
6. Conclusion
This paper has examined the relation between the extent of compliance with international best prac-tices concerning board structure and functioning
and the operating performance of large listed European companies. Although theory suggests that greater compliance with international best practices concerning board structure and function-ing is positively related with operatfunction-ing perform-ance, a prior European study (Bauer et al., 2004) reports evidence of a negative association between corporate governance compliance and corporate performance. I have re-examined the relation between corporate governance compliance and operating performance in a setting where there remained considerable diversity in the extent of compliance with international best practices regard-ing corporate governance. Consistent with expect-ations, results of univariate and multivariate tests show that greater compliance with international best practices concerning board structure and function-ing is significantly and positively correlated with the one-year ahead ROA. The results are robust to controlling forfirms’compliance with best practices in other governance areas, such as rights and duties of shareholders and range of takeover defences, and to controlling for country-level performance. Table 5
Additional regression results(continued)
equity forfirm i in year t, and is measured as earnings before extraordinary items divided by the average book value of stockholders’equity; NPM = one-year ahead net profit margin forfirm i in year t, and is measured as earnings before extraordinary items divided by sales revenues; CG_COMPLit= score from 1 to 5 with higher scores indicating greater compliance offirm i in year t with international best practice concerning board structure and functioning; LEVit= ratio of short-term debt plus long-term debt over total assets forfirm i in year t; LNTAit= natural logarithm of total assets forfirm i in year t; Y2001it= year dummy, =1 when an observation is from 2001, zero otherwise; Xit= a vector of industry dummies based on the FTSE Global Classification System two-digit code for the industry sector.
Panel A reports the results on CG_COMPL in four different regressions. The four regressions differ in the measure used for CG_COMPL. In thefirst regression, CG_COMPL equals the Deminor rating of board structure and functioning (cf. the model and the results reported in Table 3). In the second regression, CG_COMPL is the Deminor rating of rights and duties of shareholders. In the third regression, CG_COMPL is the Deminor rating of range of takeover defences. And in the fourth regression,
CG_COMPL is the Deminor rating of disclosure on corporate governance. Panel B reports the results on CG_COMPL of a regression in which CG_COMPL is measured by including three separate Deminor ratings (i.e. rating of board structure and functioning, rating of rights and duties of shareholders and the rating of takeover defences) together in one regression. Panel C reports the results of a performance regression in which CG_COMPL is replaced by two factor scores. These two factors scores are obtained (using the regression method) from a principal component factor analysis (using an orthogonal VARIMAX rotation) on the four sub-ratings disclosed by Deminor. The rating of board structure and functioning and the rating of disclosure on corporate governance load on factor 1. The rating of rights and duties of shareholders and the rating of takeover defences load on factor 2. Panel D reports the results on CG_COMPL in a regression in which CG_COMPL is measured by the total governance rating as reported by Deminor. The total governance rating summarisesfirms’performance in the various governance dimensions covered by Deminor.
*,** and *** denote statistical significance at the 10%, 5% and 1% level respectively and is based on a one-tailed test if the sign of the coefficient is in the predicted direction, and is based on a two-tailed test
otherwise. T-values are adjusted for within-company dependence by using clustered robust standard errors. Results on the two-digit industry dummies are not reported for parsimony.
Results of additional tests show that greater com-pliance with international best practices in other governance dimensions, namely disclosure of cor-porate governance and range of takeover defences, is significantly and positively correlated with the one-year ahead ROA.
Further tests show that greater compliance with international best practices concerning board struc-ture and functioning is significantly associated with reporting less income from asset disposals and that studying a performance measure that includes this item, as Bauer et al. (2004) do, obscures the inherently positive relationship between operating performance and the extent of compliance with international best practices regarding board struc-ture and functioning. The measure of operating performance is thus crucial when examiningfi rm-level operating performance.
Although the results show only correlation between one-year ahead operating performance and the extent of compliance with international corporate governance best practices, and do not prove causation, the results suggest thatfirms may benefit from complying with international corporate governance best practices, which may help to convince companies to adopt good governance practices. In addition, the results of the investigation may support regulators in motivating and defending their corporate governance decisions, and may prove useful for investors when assessing and evaluating company performance. One has to bear in mind, however, that not all individual governance characteristics identified by the independent rating agency as being best practices can unequivocally be classified as such. Also, as with most other governance studies, tests were performed on a set of large listed non-financial companies. Therefore, the results do not necessarily hold in a sample of smaller companies, privately-held companies, or financial companies. An examination of the impact of governance on the operating performance of smaller companies, privately-held companies, or financial companies is then also an interesting avenue for future research.
References
Alves, C. and Mendes, V. (2004).‘Corporate governance policy and company performance: the Portuguese case’.
Corporate Governance: An International Review, 12(3): 290–301.
Ball, R., Kothari, S. P. and Robin, A. (2000).‘The effect of international institutional factors on properties of account-ing earnaccount-ings’. Journal of Accounting and Economics, 29(1): 1–51.
Barber, B. M. and Lyon, J. D. (1996).‘Detecting abnormal operating performance: the empirical power and specifi
ca-tion of test statistics’. Journal of Financial Economics, 41(3): 359–399.
Bartov, E. (1993).‘The timing of asset sales and earnings manipulation.’The Accounting Review, 68(4): 840–855. Bauer, R., Braun, R. and Clark, G. L. (2008).‘The emerging
market for European corporate governance: the relation-ship between governance and capital expenditure, 1997– 2005’.Journal of Economic Geography, 8(4): 441–469. Bauer, R., Clark, G. L. and Wójcik, D. (2006).
‘Geographically dispersed ownership and inter-market stock price arbitrage–Ahold’s crisis of corporate govern-ance and its implications for global standards’.Journal of Economic Geography, 6(3): 303–322.
Bauer, R., Günster, N. and Otten, R. (2004). ‘Empirical evidence on corporate governance in Europe: the effect on stock returns, firm value and performance’. Journal of Asset Management, 5(2): 91–104.
Bebchuk, L., Cohen, A. and Ferrell, A. (2004). ‘What matters in corporate governance?’ Olin Paper No. 491, Harvard Law School.
Beiner, S., Drobetz, W., Schmid, M. M. and Zimmermann, H. (2006).‘An integrated framework of corporate govern-ance and firm valuation’. European Financial Management, 12(2): 249–283.
Bhagat, S. and Black, B. (2002). ‘The non-correlation between board independence and long-termfirm perform-ance’.Journal of Corporate Law, 27(2): 231–273. Black, B. S., Jang, H. and Kim, W. (2006).‘Does corporate
governance predictfirms’market values? Evidence from Korea’.Journal of Law, Economics, and Organization,22 (2): 366–413.
Brown, L. D. and Caylor, M. L. (2006a). ‘Corporate governance and firm valuation’. Journal of Accounting and Public Policy, 25(4): 409–434.
Brown, L. D. and Caylor, M. L. (2006b). ‘Corporate governance and firm operating performance’. Working paper, Georgia State University and University of South Carolina.
Core, J. E., Guay, W. R. and Rusticus, T. (2006).‘Does weak governance cause weak stock returns? An examination of
firm operating performance and investors’expectations’.
Journal of Finance,61(2): 655–687.
De Angelo, L.E. (1988).‘Managerial competition, informa-tion costs and corporate governance: the use of accounting performance measures in proxy contests. Journal of Accounting and Economics,10: 3–36.
Deminor Rating (2001). Corporate Governance Rating Service Europe. http://www.deminor.com (22pp.). Drobetz W., Schillhofer, A. and Zimmermann, H. (2004).
‘Corporate governance and expected stock returns: evi-dence from Germany’.European Financial Management, 10(2): 267–293.
Durnev, A. and Kim, E. H. (2005).‘To steal or not to steal:
firm attributes, legal environment, and valuation’.Journal of Finance, 60(3): 1461–1493.
Francis, J. R., Khurana, I. K. and Pereira, R. (2003).‘The role of accounting and auditing in corporate governance and the development of financial markets around the world’. Asia–Pacific Journal of Accounting and Economics, 10: 1–30.
Gujarati, D. (2003). Basic Econometrics. International Edition. McGraw-Hill Companies, Inc.
Gompers, P., Ishii, J. and Metrick, A. (2003).‘Corporate governance and equity prices’. Quarterly Journal of Economics, 118(1): 107–155.