Handaru Jati, Ph.D
Universitas Negeri Yogyakarta
[email protected]
Clustering
Clustering allows a user to make groups of data to determine patterns from the data. Clustering has its advantages when the data set is defined and a general pattern needs to be determined from the data. You can create a specific number of groups, depending on your business needs. One defining benefit of clustering over classification is that every attribute in the data set will be used to analyze the data. (If you remember from the classification method, only a subset of the attributes are used in the model.) A major disadvantage of using clustering is that the user is required to know ahead of time how many groups he wants to create. For a user without any real knowledge of his data, this might be difficult. Should you create three groups? Five groups? Ten groups? It might take several steps of trial and error to determine the ideal number of groups to create.
However, for the average user, clustering can be the most useful data mining method you can use. It can quickly take your entire set of data and turn it into groups, from which you can quickly make some conclusions. The math behind the method is somewhat complex and involved, which is why we take full advantage of the WEKA.
Overview of the math
This should be considered a quick and non-detailed overview of the math and algorithm used in the clustering method:
1. Every attribute in the data set should be normalized, whereby each value is divided by the difference between the high value and the low value in the data set for that attribute. For example, if the attribute is age, and the highest value is 72, and the lowest value is 16, then an age of 32 would be normalized to 0.5714.
2. Given the number of desired clusters, randomly select that number of samples from the data set to serve as our initial test cluster centers. For example, if you want to have three clusters, you would randomly select three rows of data from the data set.
3. Compute the distance from each data sample to the cluster center (our randomly selected data row), using the least-squares method of distance calculation.
4. Assign each data row into a cluster, based on the minimum distance to each cluster center.
clusters and cluster members don't change, you are complete and your clusters are created. If they change, you need to start over by going back to step 3, and continuing again and again until they don't change clusters.
Obviously, that doesn't look very fun at all. With a data set of 10 rows and three clusters, that could take 30 minutes to work out using a spreadsheet. Imagine how long it would take to do by hand if you had 100,000 rows of data and wanted 10 clusters. Luckily, a computer can do this kind of computing in a few seconds.
Data set for WEKA
The data set we'll use for our clustering example will focus on our fictional BMW dealership again. The dealership has kept track of how people walk through the dealership and the showroom, what cars they look at, and how often they ultimately make purchases. They are hoping to mine this data by finding patterns in the data and by using clusters to determine if certain behaviors in their customers emerge. There are 100 rows of data in this sample, and each column describes the steps that the customers reached in their BMW experience, with a column having a 1 (they made it to this step or looked at this car), or 0 (they didn't reach this step). Listing 4 shows the ARFF data we'll be using with WEKA.
Listing 4. Clustering WEKA data
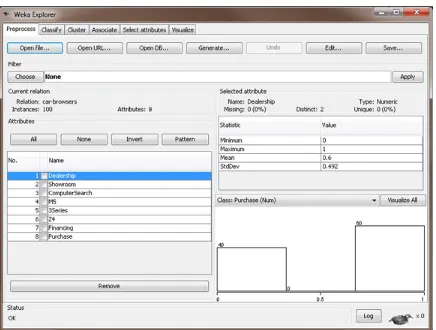
Figure 5. BMW cluster data in WEKA
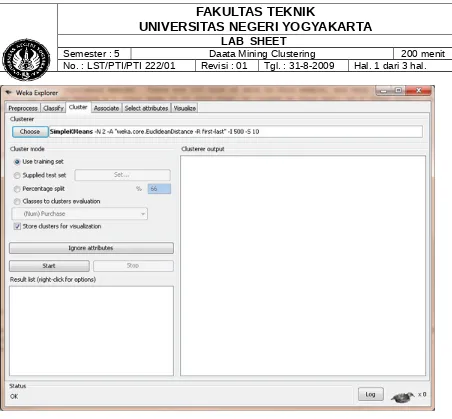
Finally, we want to adjust the attributes of our cluster algorithm by clicking SimpleKMeans (not the best UI design here, but go with it). The only attribute of the algorithm we are interested in adjusting here is the numClusters field, which tells us how many clusters we want to create. (Remember, you need to know this before you start.) Let's change the default value of 2 to 5 for now, but keep these steps in mind later if you want to adjust the number of clusters created. Your WEKA Explorer should look like Figure 7 at this point. Click OK to accept these values.
At this point, we are ready to run the clustering algorithm. Remember that 100 rows of data with five data clusters would likely take a few hours of computation with a spreadsheet, but WEKA can spit out the answer in less than a second. Your output should look like Listing 5.
Listing 5. Cluster output
Cluster#
Attribute Full Data 0 1 2 3 4 (100) (26) (27) (5) (14) (28) ================================================================================== Dealership 0.6 0.9615 0.6667 1 0.8571 0 Showroom 0.72 0.6923 0.6667 0 0.5714 1 ComputerSearch 0.43 0.6538 0 1 0.8571 0.3214 M5 0.53 0.4615 0.963 1 0.7143 0 3Series 0.55 0.3846 0.4444 0.8 0.0714 1 Z4 0.45 0.5385 0 0.8 0.5714 0.6786 Financing 0.61 0.4615 0.6296 0.8 1 0.5 Purchase 0.39 0 0.5185 0.4 1 0.3214
Clustered Instances
together, with a "1" meaning everyone in that cluster shares the same value of one, and a "0" meaning everyone in that cluster has a value of zero for that attribute. Numbers are the average value of everyone in the cluster. Each cluster shows us a type of behavior in our customers, from which we can begin to draw some conclusions:
Cluster 0 — This group we can call the "Dreamers," as they appear to wander around the dealership, looking at cars parked outside on the lots, but trail off when it comes to coming into the dealership, and worst of all, they don't purchase anything.
Cluster 1 — We'll call this group the "M5 Lovers" because they tend to walk straight to the M5s, ignoring the 3-series cars and the Z4. However, they don't have a high purchase rate — only 52 percent. This is a potential problem and could be a focus for improvement for the dealership, perhaps by sending more salespeople to the M5 section.
Cluster 2 — This group is so small we can call them the "Throw-Aways" because they aren't statistically relevent, and we can't draw any good conclusions from their behavior. (This happens sometimes with clusters and may indicate that you should reduce the number of clusters you've created).
Cluster 3 — This group we'll call the "BMW Babies" because they always end up purchasing a car and always end up financing it. Here's where the data shows us some interesting things: It appears they walk around the lot looking at cars, then turn to the computer search available at the dealership. Ultimately, they tend to buy M5s or Z4s (but never 3-series). This cluster tells the dealership that it should consider making its search computers more prominent around the lots (outdoor search computers?), and perhaps making the M5 or Z4 much more prominent in the search results. Once the customer has made up his mind to purchase the vehicle, he always qualifies for financing and completes the purchase.
Cluster 4 — This group we'll call the "Starting Out With BMW" because they always look at the 3-series and never look at the much more expensive M5. They walk right into the showroom, choosing not to walk around the lot and tend to ignore the computer search terminals. While 50 percent get to the financing stage, only 32 percent ultimately finish the transaction. The dealership could draw the conclusion that these customers looking to buy their first BMWs know exactly what kind of car they want (the 3-series entry-level model) and are hoping to qualify for financing to be able to afford it. The dealership could possibly increase sales to this group by relaxing their financing standards or by reducing the 3-series prices.
looked at the M5 and who purchased one. Also, turn up the "Jitter" to about three-fourths of the way maxed out, which will artificially scatter the plot points to allow us to see them more easily.
Do the visual results match the conclusions we drew from the results in Listing 5? Well, we can see in the X=1, Y=1 point (those who looked at M5s and made a purchase) that the only clusters represented here are 1 and 3. We also see that the only clusters at point X=0, Y=0 are 4 and 0. Does that match our conclusions from above? Yes, it does. Clusters 1 and 3 were buying the M5s, while cluster 0 wasn't buying anything, and cluster 4 was only looking at the 3-series. Figure 8 shows the visual cluster layout for our example. Feel free to play around with the X and Y axes to try to identify other trends and patterns.
Figure 8. Cluster visual inspection


