Owen Thompson is an assistant professor of economics at the University of Wisconsin, Milwaukee. He thanks the Center for Research on Families and the Political Economy Research Institute at the University of Massachusetts for fi nancial support, and three anonymous referees, Michael Ash, Arindrajit Dube, Maureen Perry- Jenkins, Andrew Smolen, Fidan Kurtulus, and Samuel Bowles and seminar participants at the University of South Carolina, the University of Miami, McGill University, the University of Wisconsin- Milwaukee, Bryn Mawr College, the University of New Mexico, Syracuse University, Middlebury College, the University of Massachusetts, and at the 2012 NICHD- Add Health Users Conference for helpful com-ments. The computer code needed to replicate this paper is available at http://jhr.uwpress.org/ and at the author’s university homepage, http://www4.uwm.edu/letsci/economics/faculty/thompson.cfm. To access the data used in this paper, researchers must apply directly to Add Health at http://www.cpc.unc.edu/projects /addhealth/data/restricteduse.
The author is happy to advise and assist other researchers in applying for access to the data. Add Health requires that the following statement be placed on all articles that make use of the data: “This research uses data from Add Health, a program project directed by Kathleen Mullan Harris and designed by J. Richard Udry, Peter S. Bearman, and Kathleen Mullan Harris at the University of North Carolina at Chapel Hill, and funded by grant P01- HD31921 from the Eunice Kennedy Shriver National Institute of Child Health and Human Development, with cooperative funding from 23 other federal agencies and foundations. Special acknowledgment is due Ronald R. Rindfuss and Barbara Entwisle for assistance in the original design. Information on how to obtain the Add Health data fi les is available on the Add Health website (http://www.cpc.unc.edu/Add Health). No direct support was received from Grant P01- HD31921 for this analysis.
[Submitted August 2012; accepted April 2013]
ISSN 0022- 166X E- ISSN 1548- 8004 © 2014 by the Board of Regents of the University of Wisconsin System
T H E J O U R N A L O F H U M A N R E S O U R C E S • 49 • 2
Economic Background and
Educational Attainment
The Role of Gene- Environment Interactions
Owen Thompson
A B S T R A C T
The Journal of Human Resources 264
“A gene for aggression lands you in prison if you are from the ghetto, but in the board room if you are manor born.” (Conley 2011)
“Flamingos everywhere are famous for their beautiful pink color. [But] if fl amin-gos do not have access to their usual diet [of shrimp and plankton] for any reason, they are white, not pink. Their color is entirely dependent on the environmental infl uence of diet. On the other hand, the fl amingo’s ability to turn pink with diet is entirely dependent on their genes. You could feed seagulls forever on the same diet and they would never turn pink. It would make no sense to say the fl amingos’ color was 50 percent due to genes and 50 percent due to diet. The color is due to the joint action of genes and environment.” (Rutter 2006)
“The nature versus nurture distinction, although traditional, is obsolete. Genes and environments cannot be meaningfully parsed by traditional linear models that assign unique variances to each component.” (Heckman 2007)
I. Introduction
It is well established that family income is an important predictor of educational performance (Coleman 1966; Reardon 2011; Björklund and Salvanes 2011; Dahl and Lochner 2012). Education, in turn, is widely seen as a central mecha-nism underlying the intergenerational transmission of economic status (Black and Devereux 2010). Together, these two relationships imply that any factors that affect the link between family income and education will also play an important role in determining socioeconomic mobility. Conforming to the classic nature versus nurture dichotomy, it is common for researchers to broadly classify such factors into genetic and environmental components, and economists studying intergenerational mobility and human capital development have long been interested in the relative importance of genes and environments in determining economic outcomes. (See Taubman 1976; Behrman and Taubman 1989; Plug and Vijverberg 2003; Black, Devereux, and Sal-vanes 2005; and Sacerdote 2007, among many others.)
However, modern fi ndings from molecular genetics suggest that this traditional dichotomous approach is often inappropriate, and that interactions between nature and nurture may be of substantial importance. Rather than any given outcome be-ing neatly divisible into portions attributable to genes and environments, the partial effect of a particular environmental factor often depends on an individual’s genetic endowment and vice versa. While the possible importance of such interactive effects have been acknowledged and discussed by economists (Heckman 2007; Lundborg and Stenberg 2010; Beauchamp et al. 2011; Benjamin et al. 2012), it remains largely unknown whether gene- environment interactions play a signifi cant role in shaping basic economic relationships, such as the effect of income on education.
Thompson 265
nature and nurture in this area appear to be large. For children with one variant of MAOA, I fi nd that increases in household income have the expected positive associa-tion with college enrollment, college graduaassocia-tion, and total years of schooling com-pleted. For children with another MAOA variant, who comprise over half of the popu-lation, I fi nd that there is a much weaker association between economic background and educational attainment. These results hold when the genetic component of the interactive effects are identifi ed using MAOA variation across full biological siblings, which is determined entirely by chance at the time of conception.
The paper proceeds in fi ve additional sections. Section II lays out a simple theoreti-cal framework and briefl y reviews existing work in this area. Section III describes the data. Section IV presents the main sets of results. Section V considers several addi-tional issues and the mechanisms underlying the main results. Section VI concludes by discussing several of the study’s limitations and suggesting directions for future research in this area.
II. Theoretical Framework and Existing Literature
The basic concept underlying my empirical exercises can be concisely expressed as a conventional economic production function. Specifi cally, let y be a measure of educational attainment, and let g and e be measures of genetic and envi-ronmental factors that infl uence y. If these cross partials are nonzero, then the process by which academic achievement is produced includes gene- environment interactions. One familiar functional form that helps to illustrate several conceptually important cases is a CES production function.1
Recall that the CES production function takes the form y = A[αgγ + (1 − α)eγ]1/γ where γ ≤ 1 and 0 ≤ α ≤ 1. In the special case where γ = 1, genetic and environmental inputs are perfect substitutes and this equation reduces to y = A[αg + (1 − α)e]. In this case, the genetic and environmental infl uences on academic achievement are additively separable, ∂2f / ∂e∂g = 0, and there are no gene- environment interactions. The relative importance of genetic as opposed to environmental infl uences is given by the param-eter α. Much of the economic and psychometric literature on heritability has implicitly assumed a functional form of this kind, and the primary research exercise in that litera-ture has been to estimate the value of α. These estimates (most commonly derived us-ing twin and adoptee research designs) are then interpreted as the proportion of popula-tion variance in the trait under study that is due to genes, implicitly or explicitly ruling out gene- environment interactions of any importance. At the other extreme, when γ =
−∞, genetic and environmental inputs are perfect compliments. This can be seen as an extreme case of gene- environment interactions, where changes in one factor are of no consequence when the other factor is held constant. Likely more realistic than either of these extreme cases is a CES production function where −∞≤ γ ≤ 1, so that the marginal effect of environmental improvements vary with genetic endowment and vice- versa. The empirical evidence presented below is consistent with such an intermediate case.
The Journal of Human Resources 266
While direct measurement of human genotypes is now a reasonably straightforward process, studies of how genetic endowments modify the effects of environmental con-ditions have also been conducted with nonbiological data, typically using twin and adoptee research designs to identify genetic and environmental effects. A prominent example is Turkheimer et al. (2003), who found that the heritability of IQ is greater among high SES families than it is among low SES families, suggesting interactive complementarities between genetic and environmental advantages in infl uencing cog-nitive skills.2 Another important contribution comes from Bjö rklund, Lindahl, and Plug (2006), who study the educational and earnings outcomes of Swedish adoptees. The authors fi nd signifi cant interactions between the characteristics of the adopted children’s biological parents and those of their adoptive parents, which they credibly argue refl ect genetic and environmental factors, respectively.3
While these studies demonstrate that much can be learned without directly observ-ing genetic markers, relatively recent technological advances have made such direct observation practical in many cases, considerably increasing the level of scientifi c rigor possible in gene- environment interaction studies. One of the fi rst and most widely cited studies taking advantage of genetic markers was Caspi et al. (2002), which addressed the question of why some abused children themselves go on to de-velop aggressive and antisocial behaviors while others function relatively normally. Caspi and his collaborators obtained data indicating the functional presence of MAOA (the same gene used in the present study) for participants in a study of 1,037 children who were followed from ages three to 26. Each study participant was then classifi ed as having been severely maltreated, probably maltreated or not maltreated during child-hood, and the relationship between maltreatment status and an index of antisocial be-havior was estimated for children with and without MAOA gene presence. The authors found a striking gene- environment interaction: Among children with high MAOA activity, childhood maltreatment was associated with a relatively modest 0.24 standard deviation increase in antisocial behavior but among children with low MAOA activity childhood maltreatment was associated with a much larger increase of 0.68 standard deviations. This difference was highly statistically signifi cant and was robust to vari-ous changes in the specifi cation and in how antisocial behavior was measured.
A large subsequent literature has explored gene- environment interactions with re-spect to a wide range of psychological traits, including child temperament (Sheese et al. 2007), depression (Wilhelm et al. 2006), alcoholism (Hutchison et al. 2002), schizophrenia (Caspi et al. 2005), and ADHD (Retz et al. 2008), among others.4
While the overwhelming majority of gene- environment interaction studies have focused on psychological traits and conditions like those noted above, researchers
2. In the more general literatures on intergenerational mobility and heritability, an important methodologi-cal distinction can be made between studies that regress child outcomes onto parent outcomes and studies that use different types of twins or adoptees to decompose the proportion of variation in a characteristic that is attributable to genetic versus environmental infl uences. The decomposition approach has tended to fi nd a larger overall role for genetic factors, while the regression approach is more amenable to incorporating genetic market data to estimate gene- environment interactions. Black and Devereux (2010) review both the regression and decomposition approaches, while Sacerdote (2011) provides a thoughtful discussion of issues related to the decomposition approach.
3. Other notable studies in this literature include Cadoret et al. (1996) and Kendler, Karkowski, and Prescott (1999).
Thompson 267
have recently begun to explore the moderating effects of genetic background on a more general set of social outcomes. For example Guo, Roettger, and Cai (2008) study the determination of juvenile delinquency and fi nd signifi cant interactions between ge-netic markers and factors like eating regular family meals and repeating a grade, while Settle et al. (2010) fi nd a signifi cant interaction between a dopamine receptor gene and social networks in the formation of political ideologies.5 However, I have been able to identify only two previous studies that examined the role of gene- environment interactions in determining any measure of academic achievement.
First, Conley and Rauscher (2010) use within twin- pair birthweight differences to study how genetic traits may moderate the relationship between birth weight and several outcomes including high school grade point average. They fi nd only one sig-nifi cant gene- environment interaction, and its sign is the opposite of what had been suggested by prior research. Whereas the plausible exogeneity of within twin- pair birth weight differences make Conley and Rauscher’s research design attractive, its scope is inherently limited since birth weight is only one environmental factor that may impact educational outcomes. The present study analyzes a distinct and arguably broader environmental condition, economic background, and also expands the set of educational outcomes under consideration.
Second, a study by Shanahan et al. (2008) analyzes the determination of educational continuation beyond high school, and fi nds signifi cant interactions between a variant of the dopamine receptor gene DRD2 and environmental factors such as having a par-ent that belongs to the PTA and how often parpar-ents discuss school related issues with the student. While their fi ndings are suggestive of important interactive effects, the qualitative methodological approach of Shanahan et al. makes their results diffi cult to interpret, and no attention is given to issues of selection bias. In the present study, I take advantage of family level clustering in my data to estimate sibling fi xed- effects models that identify the critical interaction terms using plausibly exogenous varia-tion in genetic status, and do so within a standard multiple regression methodologi-cal approach. Additionally, I analyze distinctly economic environmental factors and a broader set of educational outcomes.
III. Data
The data used in this paper is drawn from the National Longitudinal Study of Adolescent Health (Add Health). The Add Health study includes a nationally representative sample of adolescents who were in grades 7–12 during the 1994–95 school year and who have since been interviewed in four waves, with the most recent wave occurring in 2008 when participants were between 24 and 32 years old. The initial Add Health sampling procedure took place in two stages. In the fi rst stage, a
5. Studies within economics have incorporated genetic markers as well but to my knowledge none have investigated their interactive effects. One literature investigates the effects of genetic markers in experimental and behavioral contexts. For example, Carpeneter, Garcia, and Lum (2011) and De Neve and Fowler (2010)
The Journal of Human Resources 268
stratifi ed random sample of 88 high schools was drawn from the frame of all high schools in the US with more than 30 students. For each high school that did not in-clude a seventh grade, a feeder school that did inin-clude a seventh grade and regularly sent graduates to the high school was also selected. In the second stage, a sample of 27,000 adolescents from the selected high schools and their feeder schools was drawn, with oversampling of individuals with certain social and demographic characteristics of interest.6 Selected participants completed an extensive in- home questionnaire on a variety of demographic- , academic- , and health- related topics, and a separate survey was also completed by a resident parental fi gure of each respondent.
The Add Health study also included an overlapping “genetic subsample.” Students who identifi ed themselves as twins in a preliminary questionnaire were selected for this sample with certainty, resulting in the inclusion of over 300 monozygotic and dizygotic twin pairs. Respondents with full siblings were typically not oversampled, but more than 1,000 full sibling pairs entered into the sample, mostly by chance. In the third wave of the survey, all active participants from the subsample of twin and full sibling groups were asked to provide a saliva specimen for genetic testing pur-poses, and 2,612 out of 3,139 eligible respondents (83 percent) did so. The analysis conducted here uses this subset of original Add Health respondents for whom genetic marker data is available.7 The fact that the Add Health sampling procedure was strati-fi ed at both the school and household level makes it especially amendable to fi xed- effects modeling techniques, and I exploit this unique feature of the data below.
As measures of educational attainment, I use variables indicating whether each in-dividual attended any college and whether they graduated from college,8 as well as a continuous educational attainment variable measured in years.9 To measure childhood economic status, I use the logarithm of gross household income in 1994, as reported by the respondent’s resident parental fi gure.10 Self- reported parental education is also used in some specifi cations.
6. The oversampled populations included minority ethnic groups and African American students with college educated parents.
7. Because the siblings of twins were not selected through probability sampling, sampling weights are un-available for 35.83 percent of the genetic subsample. Given this, I follow the recommendation of Chantala (2001) and conduct my analysis without sampling weights. Of course, the genetic subsample also excludes only children and carries a disproportionate number of twins. As a result of these survey design features, my working sample is not necessarily nationally representative, and this consideration should be kept in mind when interpreting my results.
8. While high school completion is also an important dichotomous measure of educational attainment, it is very common within my sample and there was relatively little variation in high school completion status, especially within families. However, as a robustness check I do confi rm that my basic results hold when using high school completion as the dependent variable (see Table 4).
9. This measure is actually semicontinuous because in the fi nal wave of the survey education was reported in detailed categories. These categories were recoded as follows: 8th grade or less was assigned a value of 8; some high school was assigned a value of 10; high school graduate and vocational training were assigned a value of 12; some college was assigned a value of 14; completed college was assigned a value of 16; some graduate school and some postbaccalaureate professional education (for example, law school, medical school, nurse) were assigned a value of 17; completed master’s degree, some graduate training beyond a master’s degree, and completed postbaccalaureate professional education were assigned a value of 18; completed doctoral degree was assigned a value of 20.
Thompson 269
With respect to genetic markers, I investigate the interactive effects of variation at the gene locus most strongly suggested by prior research: monoamine oxidase A (MAOA), which individuals inherit in varying forms known as alleles. MAOA is a 30 base- pair repeat element, and allelic variation at the MAOA locus takes the form of differing numbers of repeats. Individuals can have 2, 3, 3.5, 4, or 5 repeats, but about 95 percent of individuals have either three or four repeats.11 Those with 3.5 or 4 repeats are believed to be better able to chaperone and break down neurotransmitters such as serotonin, norepinephrine, and dopamine than are individuals with 2, 3, or 5 repeats (Guo, Roettger, and Cai 2008). In turn, the levels of such neurotransmitters have been linked with reduced impulsivity, novelty seeking, anxiety, and aggression, among other social and behavioral traits that could impact educational attainment.
Importantly, MAOA is located on the X chromosome, so that males possess only one MAOA copy, while females possess two MAOA copies (such genes are called “X linked”).12 Males inherit their single copy of MAOA from their biological moth-ers, while females inherit a separate MAOA copy from each biological parent. The presence of two MAOA copies in females substantially complicates the classifi cation of their MAOA status. For example, consider a case in which a female has both a 3 repeat and a 4 repeat MAOA allele, which is by no means a rare occurrence, occurring in over 41 percent of female Add Health respondents. Because the phenotypes associ-ated with MAOA status are generally complex, and no clear dominance relations exist between the different MAOA alleles, it is not at all clear how such a female’s MAOA status should be classifi ed. Unfortunately, the biological literature offers little guidance on this issue since both animal and human studies of MAOA have has focused primar-ily on males (see below). To avoid these complications, I follow the existing literature and focus only on males.13
Accordingly, I created an indicator variable for each male respondent equal to one if the individual had 3.5 or four repeats as their single MAOA copy, and zero other-wise.14 For ease of exposition, I will refer to such individuals as having “positive” MAOA status, but no normative assessment of favorable genetic status should be in-ferred from this choice of language. (Indeed my primary fi nding is that the association between MAOA status and educational attainment is highly dependent on economic background.) Importantly, positive MAOA status is not a rare genetic trait: of the 1,213 males in the Add Health data with valid MAOA test results, 686 of them (ap-proximately 57 percent) have positive MAOA status. Given this relatively uniform dis-tribution, any substantial interactions involving MAOA will have broad implications. As noted below, there are approximately 20,000 to 25,000 distinct protein encoding DNA sequences in the human genome, and picking out just one of these may seem
11. There is also a very rare seven- repeat allele at the MAOA locus but no Add Health respondents were found to possess this variant.
12. This is because males possess one X chromosome and one Y chromosome while females possess two X chromosomes.
13. A preliminary analysis of the female sample (available on request) produced some results similar to those reported below for males, but these results depended strongly on the classifi cation of female’s MAOA status and on other modeling choices. Given the lack of guidance from the scientifi c literature on these questions, choosing between different classifi cations and specifi cations for females is necessarily arbitrary and thus avoided.
The Journal of Human Resources 270
rather arbitrary. This is not the case, primarily due to the fact that animal studies provide scientifi cally rigorous guidance in the selection of genes to study. The most powerful technique is the use of so- called knockout mice that have had certain genes experimen-tally blocked by researchers. Such knockout studies have been conducted with male mice on genes similar to MAOA (Cases et al. 1995; Shih and Thompson 1999), and the results suggest that MAOA is likely among the most important genetic loci for behav-ioral and social functioning. Additional evidence on the importance of MAOA comes from studies of an extended Dutch family in which males carry no MAOA repeat, cre-ating in essence a human MAOA knockout (Brunner et al. 1993). The men in this fam-ily were found to display disproportionate levels of aggression, impulsivity, and crimi-nal behavior.15 The evidence supporting a major role for MAOA status in determining behavioral traits is suffi cient that in a 2009 U.S. murder trial, the defense successfully used MAOA status (combined with a history of child abuse) as an argument to limit conviction to voluntary manslaughter and avoid the death penalty (Barber 2010). Given this body of evidence, the selection of MAOA for study here is far from arbitrary.
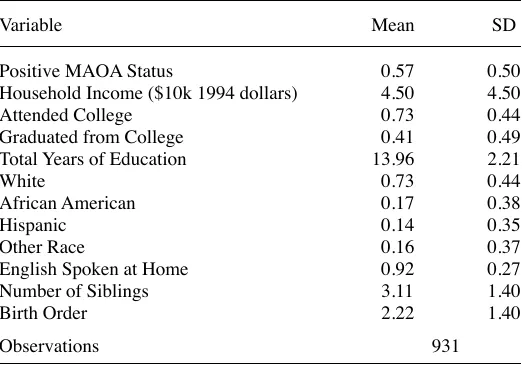
Table 1 presents descriptive statistics of the data. Despite the fact that the genetic subsample was not drawn at random, the descriptive statistics show that it still con-tains substantial socioeconomic diversity. Approximately 27 percent of the working sample is nonwhite, all levels of educational attainment are reasonably well
repre-15. Note that in both types of studies (those using knockout mice and rare human mutations), the focus has been on males. There is far less evidence linking MAOA status to social and behavioral outcomes in females.
Table 1
Descriptive Statistics
Variable Mean SD
Positive MAOA Status 0.57 0.50
Household Income ($10k 1994 dollars) 4.50 4.50
Attended College 0.73 0.44
Graduated from College 0.41 0.49
Total Years of Education 13.96 2.21
White 0.73 0.44
African American 0.17 0.38
Hispanic 0.14 0.35
Other Race 0.16 0.37
English Spoken at Home 0.92 0.27
Number of Siblings 3.11 1.40
Birth Order 2.22 1.40
Observations 931
Thompson 271
sented, and the $45,000 standard deviation of household income indicates substantial income dispersion.
IV. Results
A. The Basic Result
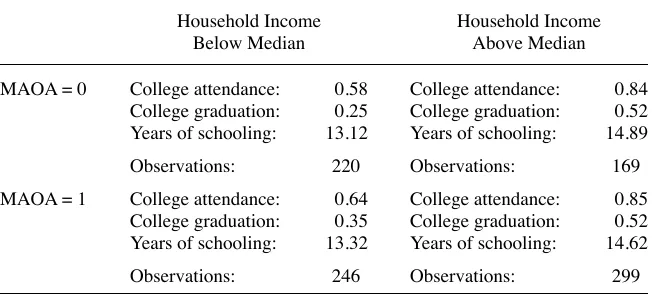
As a preliminary test of interactions between family income and MAOA status, Table 2 reports mean levels of educational attainment separated by MAOA status and whether the child came from a home with an income above or below the sample median.16 The fi rst column of Table 2 shows that among children from homes with incomes below the median, those with positive MAOA status are approximately six percentage points more likely to attend college, ten percentage points more likely to graduate from college, and on average complete around 0.2 years more schooling than children without positive MAOA status. In contrast, the second column shows that among children from homes with incomes above the median, MAOA status is virtually unas-sociated with college attendance and graduation, and that in fact children with positive MAOA status complete an average of 0.27 fewer years of schooling than those without positive MAOA status. We could equivalently view the summary statistics by row, in which case they suggest that the association between educational attainment and com-ing from a home with income above the median is larger for children without positive MAOA status. These simple mean differences suggests that educational outcomes may depend interactively on economic background and MAOA status.
Next, I estimate a series of models that include a large set of control variables and
16. The sample median annual income was $38,000. Table 2
Mean Educational Outcomes by Income and MAOA Status
Household Income Below Median
Household Income Above Median
MAOA = 0 College attendance: 0.58 College attendance: 0.84 College graduation: 0.25 College graduation: 0.52 Years of schooling: 13.12 Years of schooling: 14.89
Observations: 220 Observations: 169
MAOA = 1 College attendance: 0.64 College attendance: 0.85 College graduation: 0.35 College graduation: 0.52 Years of schooling: 13.32 Years of schooling: 14.62
Observations: 246 Observations: 299
The Journal of Human Resources 272
the results are reported in Table 3. Because previous work has found substantial con-cavities in the relationship between family income and educational attainment (Loken, Mogstad, and Wiswall 2012; Dahl and Lochner 2012), I enter family income in logs and estimate models of the following form, where each individual student is denoted with subscript i17
(1) EducationalAttainmenti=β0+1LogIncomei+Xi′+εi if MAOAi=0,1
where Xi is a vector of controls that includes school dummies,18 number of siblings, birth order, racial and ethnic group indicators,19 language spoken at home, and sets of indicators for child age (by month and year of birth) and parental age (by year of birth).20 The inclusion of school fi xed- effects in these models is noteworthy because access to higher quality schools is a potentially crucial mechanism by which income infl uences educational success. Selection bias of this nature is eliminated here by re-stricting the comparison to students in the same school.
Equation 1 was estimated via OLS. For the binary dependent variables indicating college attendance and college graduation a linear probability model was used but the results are similar when using a logit model or other common limited dependent vari-able estimation methods. The results parallel the mean differences found in Tvari-able 2 in suggesting that the association between family income and educational outcomes depends on MAOA status. For all of the outcomes studied, the estimated effect of childhood income on educational attainment is much smaller for students with positive MAOA status than it is for students without positive MAOA status. P- values from sig-nifi cance tests for cross- model differences in the log income coeffi cients are reported at the bottom of Table 3, and in all three cases the differences across MAOA groups are statistically signifi cant at beyond the 5 percent level. Taking the models predicting college graduation as an example, the results indicate that for students without positive MAOA status, a doubling of gross family income is associated with an 11.7 percent-age point increase in the likelihood of college graduation. However, the size of this effect is only 1.7 percentage points for students with positive MAOA status. Results for college attendance and years of education similarly reveal large differences in the strength of the income- education association across the two MAOA groups.
B. Robustness Checks
A series of checks were performed to test the robustness of these fi ndings, and the results are reported in Table 4. To conserve space, the dependent variable is in most cases limited to total years of education completed, but the results when the dependent variable is college attendance and college completion are all qualitatively similar to those shown here, and are available from the author on request. For purposes of com-parison, the baseline specifi cation from Table 3 is reproduced in the fi rst column of
17. As a robustness check, I also show estimates from models with alternative functional forms below. 18. For convenience, I refer to “school” dummies, but it should be noted that in many cases the clusters include both the selected high school and the associated feeder school.
19. The included racial and ethnic groups are white, African American, Hispanic, Asian, American Indian and other.
Thompson
273
Table 3
The Effect of Income on Educational Attainment by MAOA Status
College Attendance College Graduation Years of Education
MAOA = 0 (1)
MAOA = 1 (2)
MAOA = 0 (3)
MAOA = 1 (4)
MAOA = 0 (5)
MAOA = 1 (6)
Log Income 0.136*** 0.042** 0.117** 0.017 0.913*** 0.287**
(0.051) (0.020) (0.051) (0.024) (0.282) (0.136)
Observations 394 537 394 537 354 471
R-squared 0.460 0.320 0.451 0.295 0.587 0.347
P-value from test of whether income
coeffi cients are equal across MAOA groups 0.0256 0.0379 0.0157
The Journal of Human Resources
274
Table 4
Robustness Checks
Baseline
Minimal Controls
Alternative Functional Forms
White Sample
High School Completion
Graduate Degree
Alternative MAOA
Classifi cation
(1) (2) (3) (4) (5) (6) (7) (8)
Panel A: MAOA = 0
Log Income 0.913*** 1.030*** — — 1.547*** 0.071*** 0.016 0.859***
(0.282) (0.260) (0.497) (0.023) (0.036) (0.273)
Level Income ($10k units) — — 0.321*** 0.679*** — — — —
(0.065) (0.193)
Level Income Squared — — — –0.027* — — — —
(0.014)
Parent and Child Age Controls Y Y Y Y Y Y Y Y
Full Controls Y N Y Y Y Y Y Y
Thompson
275
Panel B: MAOA = 1
Log Income 0.287** 0.428*** — — 0.407*** 0.017 –0.000 0.264*
(0.136) (0.156) (0.125) (0.010) (0.016) (0.134)
Level Income ($10k units) — — 0.046 0.211*** — — — —
(0.037) (0.068)
Level Income Squared — — — –0.002*** — — — —
(0.001)
Parent and Child Age Controls Y Y Y Y Y Y Y Y
Full Controls Y N Y Y Y Y Y Y
Observations 471 480 471 471 341 537 538 480
The Journal of Human Resources 276
Table 4, while the remaining columns present alternative specifi cations as described below. (Note that Table 4 contains two panels corresponding to the two MAOA sta-tuses, so that the relevant comparisons for each specifi cation are between the top and bottom panels.)
One concern is that the differences across MAOA groups may only hold conditional on the large set of controls included in the models of Table 3. To address this concern, Column 2 of Table 4 reports results from a parsimonious specifi cation that contains only parent and child age indicators as control variables. Not surprisingly, the coef-fi cients on log income in these specifi cations are somewhat larger for both MAOA groups but the differences between the two groups remain large. Another potential concern is that the results are sensitive to decisions regarding the functional form of the income- education relationship. Columns 3 and 4 of Table 4 show results from models where income is entered in level instead of log form, both linearly and quadrat-ically. While the signifi cant negative quadratic terms in the models from Column 4 in-dicate that the income- education relationship is moderately concave, functional form decisions are inconsequential with respect to the basic result because large differences across MAOA groups are present in both of these alternative models.
While the specifi cations presented thus far have shown that the baseline results hold both with and without racial and ethnic group controls, all of the models have still forced the income coeffi cient to be equal across racial groups. Because many basic socioeconomic processes vary by race in the United States, there may be concerns that simple linear controls do not suffi ciently account for racial effects. To help address this concern, the models reported in Column 5 estimate the baseline specifi cation us-ing only the white portion of the sample. The results indicate that differences across MAOA groups within the white sample are actually substantially larger than the ones found in the full sample.21
There may also be questions as to whether the results hold for levels for educational attainment in the less populated tails of the educational distribution, such as those who do not complete high school or who complete graduate degrees. Columns 6 and 7 of Table 4 address this question by showing results from models where the dependent variables are indicators of high school graduation and of obtaining a post baccalaure-ate gradubaccalaure-ate or professional degree. The difference in income coeffi cients by MAOA status in the models from Column 6, predicting high school graduation, are very similar to the differences found in Table 3 for college attendance and college gradu-ation, suggesting that interactive effects are equally important in the lower tail of the educational distribution. The models reported in Column 7 estimate that income has a negligible effect on the probability of competing postgraduate training for students of both MAOA statuses. This may be because income is simply less important at the high end of the educational distribution, but may also be because Add Health respondents were between ages 24 and 32 years old when last interviewed, and individuals often do not complete graduate training until their thirties or later.
While the classifi cation of MAOA status used here is the same as most previous studies, there is a degree of ambiguity regarding the classifi cation of individuals with
Thompson 277
fi ve MAOA repeats, and some previous studies have included such individuals in the positive MAOA status group. To test the sensitivity of my results to this alternative classifi cation, Column 8 of Table 4 shows results where individuals with fi ve repeats are classifi ed as having positive MAOA status, and they are not materially different from those using the classifi cation scheme of the baseline specifi cations.
A fi nal issue is population stratifi cation by MAOA status. It has been established elsewhere that positive MAOA status is not evenly distributed across the population but is instead more common at the higher end of the income distribution, among the college educated, and within the white population, among other socioeconomic and demographic traits (Sabol, Hu, and Hamer 1998). To the extent that the control vari-ables in my baseline specifi cations are correlated with household income, this strati-fi cation could lead to bias in the estimated interaction between income and MAOA status due to missing interactions between income and other righthand side variables. To address this possibility, Table A1 of the web appendix22 shows results from mod-els where the two MAOA groups are pooled, and both MAOA status and household income are interacted with all of the other righthand side variables. For purposes of comparison, baseline pooled specifi cations in which only income and MAOA are in-teracted are shown as well. The results indicate that while the addition of so many interaction terms increases the size of the standard errors, the point estimate for the income- MAOA interaction term actually increases when these highly fl exible interac-tive models are implemented, which reduces concerns about the basic results being driven by missing interaction terms. Of course these models do not remove bias that is due to unobserved traits which are correlated with MAOA status or family income. This issue is discussed further in the next two subsections.
To summarize, the differences in the association between family income and educa-tional attainment across MAOA groups is robust to a variety of reasonable alternative specifi cation, modeling, and classifi cation choices.
C. Selection Bias and Sibling Fixed- Effects Models
The models presented above found large interactions between genetic status and envi-ronmental conditions but alone they are not suffi cient for assigning those interactions causal interpretations. Because the effect of interest is an interaction, a fully causal model would need to rely on conditionally exogenous variation in both MAOA sta-tus and childhood income. Despite the relatively large set of controls included in the models above, it is diffi cult to maintain that the residual of the educational attainment measures are conditionally independent of MAOA status and childhood income. With respect to MAOA status, the primary problem is that for a given student in my sample to inherit positive MAOA status, their biological mother must have at least one copy of the implicated MAOA alleles as well. Because maternal MAOA status may impact relevant but unobserved childhood conditions that affect educational attainment, this could lead to a violation of the assumption that MAOA status is conditionally orthogo-nal to the unexplained portion of educatioorthogo-nal attainment. With respect to childhood in-come, there may be factors that are related to both income and academic achievement
The Journal of Human Resources 278
but that are not directly controlled for in the regression models. Examples of such omitted variables may include personality traits or ability, and their omission would also lead to inconsistent estimation of the gene- environment interaction under study.
If a controlled experiment were possible, causal gene- environment interactions could be established by randomly assigning students into groups that differ in terms of both MAOA status and childhood income, and then estimating models similar to those in Table 3. While such an experiment is clearly implausible, the Add Health data does include a substantial number of sibling pairs, and this allows for the estimation of sibling fi xed- effects models that come closer to the experimental ideal of random assignment—at least with respect to MAOA status. The ability of such models to identify defensibly causal genetic effects comes from an elementary principle of ge-netics, sometimes called the principle of random fertilization. This principle states that parental genes combine at random during fertilization so that the probability of a given zygote (fertilized egg) having a particular gene combination is directly proportional to the frequency of those genes among the biological parents (or biological mother in the case of an X- linked gene like MAOA). Because full biological siblings defi nitionally share the same parents, any genetic differences between such siblings are due entirely to chance.
As an example, consider a mother with a three- repeat allele at one copy of her MAOA locus and a four- repeat allele at the other copy (recall that since females have two X chromosomes, they also have two copies of the MAOA gene). Random fertil-ization asserts that each male biological child of this mother will have an independent 50- 50 chance of inheriting a three- repeat versus a four- repeat allele as their sole copy of MAOA.23 In the context of the current study, this means that if a particular male student has positive MAOA status, but their full biological brother does not, this dif-ference is as good as randomly assigned and can therefore be used to estimate an arguably causal MAOA effect.24
While powerful, the sibling fi xed- effects approach has the disadvantage of sub-stantially reducing the sample size and precision of parameter estimation. This is be-cause while the Add Health data reports both MAOA and household income data for 931 male respondents, only 468 of these observations are part of a male- male sibling pair. Furthermore, these pairs cannot be used to identify causal effects unless the two siblings differ in terms of MAOA status, which further reduces the sample to 70.25
23. While random fertilization ensures that the MAOA status of siblings are independent of each other, the fact that each allelic variant possessed by the mother has an equal probability of being transmitted to the child is due to the related genetic principle of segregation, which holds that paired genes separate (or segregate) in such a way that each reproductive cell is equally likely to contain either member of the pair. See Hartl and Jones (1999).
24. The use of within- family genetic variation has some precedence in the economics literature. For ex-ample, Fletcher and Lehrer (2009, 2011) term such variation “the genetic lottery” and use it as an instrument to identify the effect of mental health on academic performance.
Thompson 279
Finally, even among male- male sibling pairs with differing MAOA status, there is no guarantee that the two siblings will have differing educational attainment; indeed, it is quite common for siblings to complete identical amounts of education.
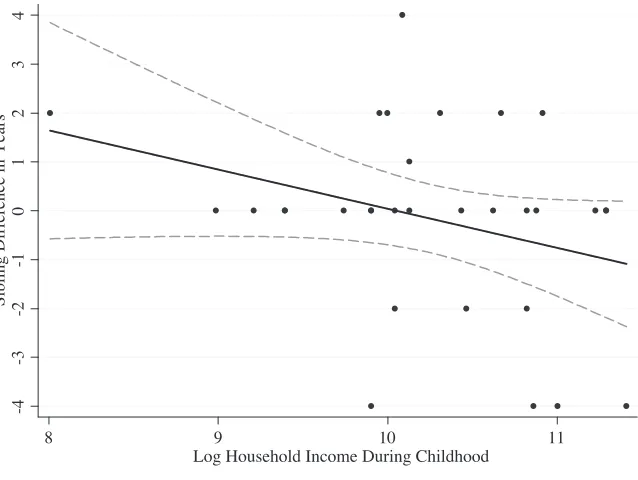
While a larger sample of MAOA- varying male- male sibling pairs would of course be preferable, the relatively small number of such cases in the Add Health data turns out to be suffi cient for generating reasonably precise estimates of the MAOA- income interaction term of interest. As a fi rst approximation of the interactive effect, Fig-ure 1 presents a scatter plot of childhood income against sibling- differenced years of education. Each point in the scatter plot represents one sibling pair in which the “fi rst” sibling has positive MAOA status while the “second” sibling does not, and the vertical axis records the difference between the fi rst and second siblings in terms of
from their sibling in terms of MAOA status, the identifying sample in the sibling fi xed- effects models would be 69, which is very close to the number who actually do differ (70). Of these 70 observations, 22 are full siblings and the remaining 48 are DZ twins.
Figure 1
Within Sibship Differences in Educational Attainment by Household Income Notes: Each point of the scatter plot represents a sibling pair in which one sibling has MAOA = 1 status and the other sibling has MAOA = 0 status. The vertical axis measures the difference in years of education between the MAOA = 1 sibling and the MAOA = 0 sibling, so that points where the y- coordinate is zero represent cases in which both siblings completed the same number of years of education, points with a positive y- coordinate represent cases in which the MAOA = 1 sibling completed more years of education than the MAOA = 0 sibling, and points with a negative y- coordinate represent cases in which the MAOA = 1 sibling completed fewer years of education than the MAOA = 0 sibling.
-4
-3
-2
-1
0
1
2
3
4
8 9 10 11
Log Household Income During Childhood
The Journal of Human Resources 280
educational attainment. Therefore, points on the zero- line of the vertical axis represent pairs in which both siblings had the same number of years of education while points above the zero- line represent pairs in which the MAOA positive sibling completed more years of education, and vice versa for points below the zero- line.
If the effect of having positive MAOA status falls as income increases, then we would expect the locus of points in Figure 1 to be downward- sloping, and the included fi t line shows that we do in fact observe a declining relationship between the effect of positive MAOA status and household income. However, the included confi dence bands make it clear that this estimated relationship is not particularly precise, in large part due to the small size of the subsample used to identify it.26
Regression- based estimates of the sibling fi xed- effects models are reported for all three educational outcomes in Table 5. Specifi cally, I estimate models of the following form, where subscript i, f denotes student i from family f:
(2) EducationalAttainmentif =0+1MAOAif+2(MAOAif×LogIncomef)
+Xif′+␥f +εif.
Here Xif is a vector that now contains only control variables that vary within families (child age and birth order), and γf is a family fi xed- effect.
Results of these models are shown in the fi rst, third, and fi fth columns of Table 5. Because household income is invariant within families, its main effect is unidentifi ed in the sibling fi xed- effects models. But MAOA’s main effect and its interaction with household income are identifi ed, and our primary interest lies in the interaction term. In each of the three cases, this interaction term has the expected negative sign and is nontrivial in magnitude, although the small sample sizes typically prevent the interac-tions from achieving statistical signifi cance at conventional levels. For example, the interaction term in the model estimating total years of schooling (Column 5) has a coeffi cient of –1.487, which indicates that the increase in total years of education as-sociated with a doubling of household income is estimated to be 1.487 years greater for students without positive MAOA status that it is for students with positive MAOA status. The interaction terms are similarly negative and substantively large in magni-tude for the models predicting college enrollment and college completion.
To better understand how selection on MAOA status impacts the estimation of the MAOA- income interactions, the second, fourth, and sixth columns of Table 5 show re-sults from models that are estimated using the same sample as the sibling fi xed- effects models but use simple cross- sectional MAOA variation to identify the interaction term (that is, they exclude the sibling fi xed- effect). Perhaps surprisingly, the size of the interactions are broadly similar in the cross- sectional and sibling fi xed- effects speci-fi cations. For example, the interaction term in the cross- sectional model estimating college attendance is –0.304, as opposed to –0.247 in the sibling fi xed- effects speci-fi cation. Similarly, the cross sectional and sibling fi xed- effects estimates of the inter-action term in the models predicting for college completion are –0.165 and –0.118, respectively, while the analogous estimates in the models predicting total years of
Thompson
281
Table 5
Sibling Fixed-Effects Models
College Attendance College Graduation Years of Education
Sibling FE (1)
Cross-Sectional
(2)
Sibling FE (3)
Cross-Sectional
(4)
Sibling FE (5)
Cross-Sectional
(6)
Log Income — 0.128 — –0.904* — 11.158**
(0.648) (0.494) (4.929)
MAOA 2.505 2.989 0.977 1.419 14.907*** 9.517
(1.727) (4.016) (1.307) (2.110) (3.350) (11.954)
MAOA × Log Income –0.247 –0.304 –0.118 –0.165 –1.487*** –1.052
(0.171) (0.395) (0.133) (0.231) (0.347) (1.154)
Observations 70 70 70 70 60 60
The Journal of Human Resources 282
education are –1.052 and –1.487, respectively. The broad similarity of these two sets of estimates suggests that, while selection bias from nonrandom MAOA variation is important in principle, it may be relatively small in practice, at least in the context of the particular sample and environmental measures used here.
The robustness of the basic result to sibling fi xed- effects specifi cations that use plausibly exogenous genetic variation to identify the interaction terms is important suggestive evidence that those interactions are causal in nature. However, a number of considerations make it inappropriate to assign the interaction a fully causal in-terpretation. One outstanding issue is whether the interactive effects are specifi c to family income, as opposed to socioeconomic background more generally, and this is discussed in the next subsection. Additional reasons for caution are discussed in Sec-tions V and VI below.
D. Parental Education as an Alternative Measure of Economic Background
As noted, a causal estimate of the interaction between childhood income and MAOA status requires exogenous variation in both of these variables, but with respect to in-come all of the models estimated above utilize simple cross- sectional variation. This leaves open the possibility that the observed interactions are actually between MAOA status and something associated with household income, rather than household income itself. Indeed, some researchers have questioned whether income is causally related to educational outcomes at all, or if this commonly observed association is wholly due to omitted variable bias. Recent work in this area suggests that household income does indeed exert a causal effect on educational outcomes. For instance: Dahl and Lochner (2012) use discontinuous changes in the U.S. Earned Income Tax Credit schedule to instrument for income and fi nd that a $1,000 increase in income improves student test scores by approximately 6 percent of a standard deviation; Milligan and Stabile (2011) use income variation stemming from changes in the Canadian Child Tax Benefi t and fi nd that a $1,000 increase in income decreases the chances that a child is diagnosed with a learning disability by 2.8 percentage points and positively affects child test scores; and Duncan, Morris, and Rodrigues (2011) use income variation induced by 16 “welfare- to- work” experiments that randomly assigned participants to benefi ts packages and employment programs, and in their preferred specifi cation fi nd that a $1,000 increase in income improved student achievement by 6 percent of a standard deviation.
Despite this evidence, family income as measured in the present study still may simply refl ect more general socioeconomic status or unobserved parental character-istics, and it would be informative to know the extent to which the interactive effects are present with respect to other markers of socioeconomic background. A natural alternative, which is available in the Add Health data, is maternal education.27
To investigate the relative importance of family income and maternal education more closely, Table 6 reports results from two sets of models: Panel A of Table 6 shows estimates from models that include indicators of whether the respondent’s
Thompson
283
Table 6
Maternal Education as an Alternative Measure of Economic Background
College Attendance College Graduation Years of Education
MAOA = 0 (1)
MAOA = 1 (2)
MAOA = 0 (3)
MAOA = 1 (4)
MAOA = 0 (5)
MAOA = 1 (6)
Panel A: Maternal Education Only
Mom High School Graduate 0.163 0.071 –0.029 –0.042 0.797 0.752
(0.125) (0.070) (0.131) (0.089) (0.643) (0.481)
Mom College Graduate 0.334** 0.264*** 0.328*** 0.231** 2.206*** 1.874***
(0.129) (0.080) (0.116) (0.089) (0.586) (0.461)
Observations 397 543 397 543 356 474
Panel B: Both Income and Maternal Education
Log Income 0.091* 0.032 0.069 0.014 0.748*** 0.224
(0.047) (0.020) (0.043) (0.025) (0.278) (0.141)
Mom High School Graduate 0.382*** 0.019 0.062 –0.101 1.180* 0.244
(0.119) (0.085) (0.127) (0.095) (0.623) (0.513)
Mom College Graduate 0.424*** 0.219** 0.357*** 0.195** 1.821*** 1.322***
(0.125) (0.101) (0.119) (0.097) (0.617) (0.488)
Observations 362 495 362 495 328 432
The Journal of Human Resources 284
mother completed high school and whether she completed college or beyond but do not include family income (the omitted maternal education category is less than high school), while Panel B reports estimates from models that contain both family income and maternal education indicators. The results show that when maternal education is entered without family income, its association with child educational success is stron-ger among children without positive MAOA status than among children with positive MAOA status. For example, among those without positive MAOA status, having a mother who completed high school (as opposed to dropping out of high school) is as-sociated with a 16.3 percentage point increases in the probability of attending college, and having a mother who completed college is associated with a 33.4 percentage point increase in the probability of attending college. However, the analogous associations for children with positive MAOA status are considerably weaker, only 7.1 and 26.4 percentage points, respectively. When household income is added to these specifi ca-tions in Panel B of Table 6, the association between child educational outcomes and both maternal education and household income are much stronger for children without positive MAOA status than those with positive MAOA status.28
In short, Table 6 shows that the results from the baseline models that used house-hold income also apply to another reasonable measure of family background, maternal education. Discerning precisely which aspects of socioeconomic background interact with MAOA status to determine educational outcomes will require additional work using research designs that rely on well measured and plausibly exogenous varia-tion in family background measures, and unfortunately such designs are not possible with the data used in this study. Given this, at present household income is probably best viewed as an imperfect index of general socioeconomic background, as opposed to having a well- identifi ed interactive effect in its own right. The fact that maternal education displays interactive effects that are broadly similar to those of household income reinforces this view.
V. Further Issues
A. Gene- Gene Interactions
A common concern in observational gene- environment interaction studies is that any documented statistical interactions between genetic and environmental factors could actually refl ect interactions between multiple genes or so- called gene- gene interac-tions. This concern arises in the present context because educational attainment is a complex phenotypic trait that undoubtedly involves hundreds if not thousands of genes, and it is quite likely that the effect of many of these genes depend to some degree on the presence of others. Furthermore, it is entirely plausible that specifi c
Thompson 285
genes (or sets of genes) could directly impact both the earnings of parents and the edu-cational attainment of their children. Taken together, these factors raise the possibility that what I have interpreted as an interaction between MAOA status and childhood income actually may be an interaction between MAOA status and other genes. Put differently, childhood income may be standing in for unobserved genetic traits, leading to spuriously nonzero interaction terms. While there is some evidence that the effects of different gene loci on complex phenotypes are largely additive in nature (Hill et al. 2005), gene- gene interactions remain an important concern.
However, the sibling fi xed- effects approach reduces the likelihood of major bias re-sulting from gene- gene interactions. This is due to another basic principle of genetics, known as the principal of independent assortment, which holds that the combining of parental alleles at any given gene locus is independent of reproductive cell formation at all other gene loci. If genes are inherited independently of one another, then because full biological siblings share the same parental gene profi les, if a given male sibling inherits positive MAOA status while their brother does not, this difference is orthogo-nal to any other genetic differences that may exist between the two. As a result, it is unlikely that the observed interaction between childhood income and MAOA status is merely an artifact of MAOA interacting with other genetic traits.
It should be noted that while the principle of independent assortment is fundamen-tal to Mendelian genetics, there may be important exceptions, and this remains an active area of genetic research. In particular, it may be the case that genes located close together on the same chromosome are sometimes inherited as a group. Using the same data as this study, Fletcher and Lehrer (2009) conduct formal tests for link-ages between all of the available genetic markers and fi nd no evidence that the law of independent assortment is violated in this case. However, the data contains only a small number of genes and this evidence cannot be considered conclusive. If MAOA is indeed inherited with genes that jointly impact educational outcomes, then this paper’s core fi ndings could be partially attributable to gene- gene interactions.
While the sibling fi xed- effects approach reduces the chances that the basic results are due to gene- gene interactions, this is not to say that such interactions do not ex-ist or that they do not affect educational attainment. Gene- gene interactions almost certainly do exist to some degree, and the single gene models presented here may mask substantial heterogeneity in the income- education association across children who have the same MAOA status but who differ with respect to other genetic charac-teristics. Investigating such interactions will require larger genetic samples than are currently available in the Add Health data, and are an important direction for future research. This potential heterogeneity notwithstanding, the robustness of my results to sibling fi xed- effects specifi cations reduces the possibility that the interaction studied here is driven by the omission of other genetic traits.
B. MAOA Induced Differences in Environmental Conditions
The Journal of Human Resources 286
teachers, or peers, giving rise to an association between MAOA status and environ-ment even within sibling pairs.29
There is a substantial body of economic research on the issue of how parent’s investments in their children’s human capital might respond to child endowments, especially across siblings (Behrman, Pollack, and Taubman 1982; McGarry 1999; Er-misch and Francesconi 2000). From a theoretical standpoint, it is equally plausible that parents make “compensating” investments in which more resources are allocated to the less able sibling to promote equality, and that they make “reinforcing” investments in which more resources are allocated to the more able sibling to maximize marginal returns. Empirically, the majority of evidence from the United States has found that parental investments are indeed associated with child endowments, and that compen-sating investments predominate. There is less existing work on how child endowments may infl uence treatment within the formal educational system or by their peers, but at least some degree of differential treatment is highly plausible.
With respect to the current study, it is important to note that if children with posi-tive MAOA status are treated differently than those without posiposi-tive MAOA status, then the effects of this differential treatment will be absorbed by the MAOA terms in the models estimated above, including the sibling fi xed- effects models. In other words, the estimated effect of MAOA status in these models includes both the effect of MAOA status itself, and the effect of any environmental conditions that were ex-perienced as a result of having MAOA status. This is not necessarily problematic, as treatment experienced as a direct result of MAOA status can reasonably be considered an effect of MAOA status. Still, it is important to note that the estimates above incor-porate both the direct and induced effects of MAOA status, and that there is no readily available method of disentangling the two.
C. MAOA Inhibitors
The results above are concerned with the effects of variation in MAOA activity that is due to natural polymorphisms at the MAOA gene locus, but MAOA activity can also be intentionally manipulated with a class of pharmaceuticals known as MAO Inhibi-tors, or MAOIs. By preventing the production of enzymes that remove neurotransmit-ters, MAOIs increase the quantity of the relevant neurotransmitters in the brain, which can in turn impact psychological functioning and mood (Tollefson 1983).
If signifi cant numbers of Add Health respondents were taking MAOIs, it could po-tentially bias the interactive effects under study, especially if individuals with positive MAOA status were more or less likely to use MAOIs. Fortunately, this possibility is quite remote. MAOIs were among the fi rst commercially available antidepressants, and were prescribed fairly widely from the late 1950s to around 1970. However, MAOIs were discovered to have serious side effects and to be subject to numerous potentially serious interactions, both with widely used medications such as decongestants and with common food items such as cheese, pickles, and wine (Mayo Clinic Staff 2012). These issues, along with the development of other effective classes of antidepressants, have
Thompson 287
greatly reduced the use of MAOIs, and they are now seen as a last resort for treating se-vere or atypical depression that has not responded to other treatments. Given this, it is highly unlikely that signifi cant numbers of adolescents in the Add Health sample used MAOIs, and biasing of the reported results from this source is not a major concern.
D. Mechanisms and Intermediate Traits
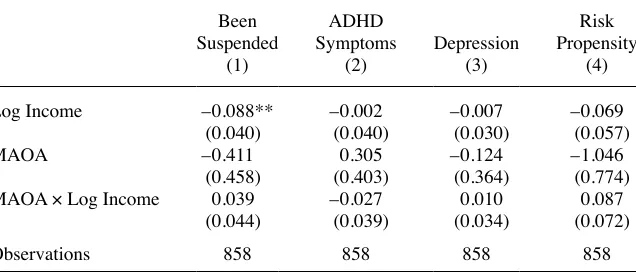
Although the association between economic background and educational attainment robustly differs by MAOA status and there is suggestive evidence that this interaction is causal, the results presented above do not clearly delineate the mechanisms that may underlie this hypothesized interaction. As noted, MAOA variation has been linked to traits such as aggression, novelty seeking, and impulsivity, and it would be insightful to know the extent to which these psychological and behavioral factors contribute to the observed interaction. Fortunately, the Add Health data contains several defensible proxies for the relevant traits. These include measures of risk seeking, attention defi cit and hyperactivity problems, depression, and school suspensions (an indicator of be-havioral problems).30 The presence of these measures allows me to test whether the overall income- MAOA interaction studied above is partially due to MAOA modifying the effect of family income on these intermediate traits.
Table 7 assesses this possibility by using the psychological and behavioral measures as dependent variables and regressing them onto childhood income, MAOA status, and their interaction, as well as the standard battery of control variables. In contrast to the models where educational attainment is the dependent variable, the interac-tion terms in these specifi cations are uniformly small and statistically insignifi cant, indicating that MAOA status does not substantively modify the association between income and these traits. These results do not necessarily mean that traits like novelty seeking and impulsivity, broadly defi ned, are an unimportant element of the mecha-nisms through which MAOA status may modify the income- education relationship. However, the exact nature of the intermediate characteristics responsible for my main results are potentially quite subtle in nature, and the available proxies may simply be too crude to detect their effects.
Even if we were able to identify intermediate traits that explained a substantial portion of this study’s core results, questions would remain regarding the nature of the interactive processes at work. One major distinction can be made between what I will call “biological” and “social” interactions. By biological interaction, I refer to a process in which income improves environmental conditions in such a way that any unfavorable phenotypes associated with MAOA status are never physiologically
The Journal of Human Resources 288
expressed. For example, increased income likely reduces stress, and in doing so may prevent a child without positive MAOA status from ever developing, say, disruptive behavioral patterns or attention defi cit issues. In contrast, a social interaction refers to a process by which increased income does not impact gene expression itself but rather affects the manner in which expressed genetic propensities are translated into educational performance. For example, a child without positive MAOA status from a high- income home may develop behavioral or attention defi cit issues similar to those of a child from a low- income home but receive more support in controlling or over-coming these issues, thus reducing their ultimate negative consequences. The basis of the distinction between biological and social interactions will be clarifi ed by a brief review of how genes operate.
Genes, or functional units of heredity, exert their infl uence on observable traits by coding for particular proteins. The mapping of the human genome ( Venter et al. 2001) has cataloged some 20,000–25,000 distinct protein encoding sequences of DNA, each containing “instructions” for producing specifi c proteins. However, the existence of instructions on how to build proteins does not guarantee that those instructions will be carried out. The difference is well framed by way of a metaphor due to Champagne and Mashoodh (2009). They describe DNA sequences as being like books precisely Table 7
Determination of Psychological and Behavioral Traits
Been Suspended
(1)
ADHD Symptoms
(2)
Depression (3)
Risk Propensity
(4)
Log Income –0.088** –0.002 –0.007 –0.069
(0.040) (0.040) (0.030) (0.057)
MAOA –0.411 0.305 –0.124 –1.046
(0.458) (0.403) (0.364) (0.774)
MAOA × Log Income 0.039 –0.027 0.010 0.087
(0.044) (0.039) (0.034) (0.072)
Observations 858 858 858 858
Thompson 289
arranged in a library. Once read, the consequences of the information in these books can be profound and far reaching, but the probability of them actually being read de-pends critically on the nature of the environment in which they are arranged. Relative accessibility or display prominence can impact the consequences of a given book as much or even more than its particular contents. Despite the fact that the information in the books is fi xed and predetermined, environment still has a big role to play in that information’s implications.
The genetic transmission of many traits follows an analogous conditional process. Despite the innate and immutable nature of DNA sequences themselves, the actual production of relevant proteins often only occurs under specifi c environmental condi-tions (Rutter 2007).31 The protein encoded at the MAOA gene locus is also called monoamine oxidiaze A,32 and if the results presented in this paper are primarily due to biological interactions, then the quantity of the MAOA protein present in the brain would depend jointly on allelic variation at the MAOA gene locus and the environ-mental factors associated with household income. Conversely, if the results are primar-ily due to social interactions, then only the effect of a given quantity of the MAOA protein in the brain would differ across students of varying economic backgrounds and not its actual level. In principle, the quantity of the MAOA protein present in the brain is observable through a process known as positron emission tomography, and this information would provide a direct method of distinguishing between biological and social interactions. However, it is unsurprisingly not available in the Add Health data. Furthermore, the lack of positive results in Table 7 suggests that the available psychological and behavioral traits, as measured, are poor proxies for MAOA gene expression. While these data constraints make it presently diffi cult to distinguish be-tween biological and social interactions empirically, the difference remains conceptu-ally important, and as additional data becomes available, the ability of researchers to study the precise intermediary process at work will improve.
VI. Study Limitations and Directions for Future
Research
The primary exercise of this study has been to empirically demonstrate that the association between economic background and educational attainment varies across groups of children with different allelic variants at a particular gene locus, monoamine oxidase A. These differences are robust to various modeling and specifi -cation choices, are present when using multiple measures of economic background, and exist within sibling groups, where a reasonable case can be made that MAOA status is as good as randomly assigned. While the results constitute important initial evidence in favor of this particular gene- environment interaction, there are a number
31. Proteins are actually created by DNA sequences via intermediary RNA sequences. This series of pro-cesses is outlined in any introductory biology textbook, and is often referred to as the “central dogma” of molecular genetics.