Adults in the United States
The Importance of Money versus People
Nicole M. Fortin
a b s t r a c t
Using two single-cohort longitudinal surveys, the NLS72 and the NELS88, I investigate the impact of four noncognitive traits—self-esteem, external locus of control, the importance of money/work and the importance of people/ family—on wages and on the gender wage gap among these young workers. I find that gender differences in these noncognitive factors, especially the importance of money/work, have a modest but significant role in accounting for the gender wage gap. Methodologically, this paper proposes a correction to the Oaxaca-Blinder-Ransom decomposition that results in a truly decomposable approach compatible with the simple pooled regression that includes a gender dummy.
I. Introduction
After spectacular gains in the 1970s and 1980s, the gender wage gap has shown slower progress during the 1990s (O’Neill 2003; Blau and Kahn 2004). Given the realized promises of the 1980s that convergence in human capital (O’Neill and Polachek 1993; O’Neill 2003) would be key to the closing of the gender pay gap, this stagnation was disappointing. In the 1980s and 1990s, dramatic increases in ed-ucational attainment among younger cohorts allowed women to enter professions, es-pecially managerial professions, previously dominated by men. These gains were concurrent with increases in labor market experience among older cohorts, which
Nicole Fortin is professor of economics at the University of British Columbia and a fellow of the Canadian Institute for Advanced Research (CIFAR). She would like to thank Francine Blau, David Card, Peter Dolton, Thomas Lemieux, Markus Mobius, Nathaniel Wilcox, anonymous referees, and seminar participants at the 2002 and 2006 AEA Meetings, at the 2005 SOLE Meetings, at UC-Berkeley and at the CIFAR Workshop on Social Interactions, Identity and Well-Being for helpful comments on this and earlier versions of the manuscript. The early stages of the project benefited from Michael Coelli’s diligent research assistance. The data used in this article can be obtained beginning May 2009 through April 2012 from Nicole Fortin, Dept. of Economics, UBC, nifortin@interchange.ubc.ca. Financial support was provided by SSHRC Grants #410-99-0959 and #501-2002-0118.
½Submitted May 2006; accepted February 2007
ISSN 022-166X E-ISSN 1548-8004Ó2008 by the Board of Regents of the University of Wisconsin System
also contributed to the narrowing of gender gap (Blau and Kahn 2000). Thus perhaps unsurprisingly, Blau and Kahn (2004) attribute the 1990s slowdown in the gender convergence in pay to factors, other than educational attainment and labor market experience that contributed to changes in the unexplained gender pay gap. These fac-tors include changes in labor market selectivity, changes in gender differences in un-measured characteristics and labor market discrimination, as well as less favorable supply and demand shifts.1
Following a renewed interest in the impact of behavioral and personality traits on earnings (Bowles, Gintis, and Osborne 2001), this paper attempts to move some of the typically unmeasured characteristics into the measurable dimension.2The main goal of the paper is to assess the contribution of noncognitive factors in accounting for the gender pay gap among workers in their early thirties in the mid-1980s. A sec-ond goal of the paper is to shed some light on the sources of changes in the gender pay gap over the last two decades of the twentieth century among young workers.
The recent literature on personality and earnings has incorporated noncognitive factors from the Rosenberg self-esteem and the Rotter locus of control scales (Gold-smith, Veum, and Darity 1997; Osborne Groves 2005; Heckman, Stixrud, and Urzua 2006; Manning and Swaffield 2008; Waddell 2006), and from the Five-Factor Model (FFM) of personality structure (Mueller and Plug 2006; Nyhus and Pons 2005).3 Like the papers in this first group, I consider the role of personality traits such as self-esteem and external locus of control, but the gender differences in these traits are not very large.
Because this paper is concerned with the gender wage gap, I put more emphasis on noncognitive factors where there are important gender differences, namely those as-sociated with differentiated gender roles. In this sense, this study complements that of Mueller and Plug (2006), which focuses on personality traits that are prototypi-cally masculine and feminine. Consistent with the traditional roles of men as ‘‘bread-winners,’’ responsible for the financial welfare of the family, and of women as ‘‘homemakers’’ or ‘‘caregivers,’’ entrusted with the care of children and the support of relationships, I pay special attention to gender differentials in valuing money and work on the one hand, and in valuing people, usefulness to society, and family on the other.4These traits also are easily tied to the economic literature on the household division of labor (Becker 1985), as argued in Section II. In addition, an impor-tant focus of the recent experimental literature has been on gender differences in altruism.5
1. Much recent research on the gender pay gap has focused on the impact of labor market selectivity, an issue outside of the scope of the present paper.
2. Early research in this area goes back to the late 1970s and early 1980s; a review can be found in Bowles, Gintis, and Osborne (2001) and Osborne Groves (2005).
3. The Rosenberg self-esteem scale is a widely used measure of self-esteem. The Rotter scale indicates whether an individual is more external or fatalistic, believing that hard work and effort are not rewarded, but rather that luck, fate, or good fortune determine success and achievement. The five personality traits included in the FFM are extroversion, agreeableness, conscientiousness, neuroticism, and openness to ex-perience.
4. Various terminologies have been used to describe these potentially conflicting values: career-life choices, work-family balance, etc.
5. The experimental literature also focuses on gender differences in risk taking and competiveness, because experimental methods are more appropriate to study these traits than career-life choices.
Ample anecdotal evidence suggests that women give greater importance in their choice of job to its value to society and to personal interactions, and less importance to money and prestige than men, but few studies investigate this path directly.6Yet, a recent hypothesis in the gender pay gap literature, called the negotiating divide hy-pothesis (Babcock and Laschever 2003), argues that women may have less of a sense of entitlement to higher wages and are less likely to initiate negotiation or bargain.7 I utilized data from two widely used high school-cohort surveys: the National Lon-gitudinal Study of the High School Class of 1972 (NLS72) and the National Educa-tion Longitudinal Study of 1988/94 (NELS88). The longitudinal aspect of these surveys allows me to use noncognitive traits measured when the individuals were in their teens (or early twenties)—in fact, many years before the labor market data was collected. The wage data was recorded when the individuals were in their mid-twenties (in 1979 for the NLS72, in 2000 for the NELS88) and in their early thirties (in 1986 for the NLS72). The measured noncognitive traits cannot suffer from a reverse causality problem since they are recorded before the respondents’ wages are observed. Further there is relatively little time for these noncognitive traits to affect the labor market outcomes of individuals in their mid-twenties by an indi-rect behavioral route, such as a more altruistic mother taking longer maternal leaves, working part-time and getting lower pay then a career-oriented mother working full-time with minimal work interruptions and getting higher pay. I thus argue that for these young workers the impact of noncognitive traits is relatively untainted by direct feedback effects from the labor market, rather these traits can be thought off as pre-determined factors.8While considering these younger workers presents an advantage with respect to the identification of the impact of noncognitive traits, it is a disadvan-tage in terms of a deeper understanding of the gender pay gap in the whole economy. Finally to the extent that there are cohort effects in the gender pay gap, looking at single cohorts rather than cross-sectional data arguably provides a cleaner assess-ment of changes in the gender pay gap within and between cohorts.9
I assess the importance of these noncognitive traits on wages, appealing to a he-donic wage function framework, and of gender differentials in these traits on the mean gender wage gap. Because of the nature of the noncognitive traits, I cannot claim to identify the ‘‘causal’’ effects of these factors on wages; rather I am inter-ested in their impact as omitted variables on potential biases in the gender dummy of a standard wage regression.10To assess the impact of the traits on gender wage differentials, I propose a correction to the Blinder-Oaxaca-Ransom wage gap decom-position that makes it fully compatible with the simple pooled regression that
6. Filer (1986) evaluates the impact of various personality traits and job characteristics, including ‘‘contri-bution of job to society,’’ on occupational structure. Chevalier (2004) investigates the impact of gender dif-ferences in motivation on the gender wage gap in the United Kingdom among recent graduates. 7. Sa¨ve-So¨derbergh (2003) indeed finds that not only were Swedish female university graduates asking for lower wages, but they also were receiving lower counter-offers.
8. This case, of course, is not as clear for workers in their early thirties. In their mid-twenties, women in my samples have on average about one year of parental experience, but more than five years of parental expe-rience in their early thirties.
9. On this issue, see for example Blau and Kahn (2000) and Weinberger and Kuhn (2006).
includes a gender dummy, and for which standard errors are easily computed. The correction also solves the problems resulting for the choice of the nondiscriminatory wage structure (Oaxaca and Ransom 1994) and includes recent propositions (Gar-deazabal and Ugidos 2004) to correct the identification problem caused by the left-out reference group, acknowledged in Oaxaca and Ransom (1999).
The main finding of the paper is of a modest but significant role (1.9 log points out of 22.9 log points) for gender differences in noncognitive traits, in particular valuing money/work and people/family (1.7 log points), to account for the gender wage gap in 1986 (among workers in their early thirties from the NLS72). This role is larger than the role of gender differences in educational attainment and cognitive skills (math score) combined, about 1.2 log points. It is almost as important in magnitude as the role of gender differences in labor market experience and job tenure (2.4 log points), which is however lower than typically found in cross-sectional data.
Considering changes in the gender pay gap, from 1979 to 2000, among workers in their mid-twenties, the raw gender pay has decreased by a 5.6 log points (from 23.7 to 18.1 log points). The human capital variables accounted for 2.8 log points of the gap in 1979 and -2.2 log points in 2000, thus accounting for -5.0 log points (-2.2–2.8) of the change in the gap. The noncognitive traits accounted for an additional -0.6 log points (0.9–1.5) of the change. Essentially the gender convergence in educational at-tainment, cognitive skills, valuing money, and work can explain away all of the gen-der convergence in pay between young workers from the NLS72 and NELS88 cohorts. This result suggests that the clear progression across cohorts of women’s preparation for the labor market is responsible for the decrease in the gender pay gap. The within-cohort decrease in the gender gap pay of less than 1 log points (from 23.7 log points to 22.9 log points for the NLS72 cohort) from age 25 to age 32 fur-ther suggests a rafur-ther small role for within-cohort relative earnings growth. These findings help clarify the deliberations of Blau and Kahn (2000) on which factor— within-cohort, between-cohort changes or lower discrimination—is more important in accounting for the gender convergence in pay among young workers.
The remainder of the paper is organized as follows. The next section reviews the literature on gender differences in work values and presents a hedonic wage function framework in which noncognitive factors are thought to influence wages. Section III addresses detailed data issues. Section IV presents the update on the Oaxaca-Blinder-Ransom methodology. The wage regression and decomposition results are discussed in Section V. Finally, I conclude with a review of the findings in Section VI.
II. The Influence of Work Values on Economic Behavior
Historically gender differences in work values, which were perceived as a rationalization for occupational gender segregation, have been deemphasized in the sociological literature (Bielby and Bielby 1984; Rowe and Snizek 1995). More recently, in an effort to account for the unexplained part of the gender pay gap and increasing returns to unobserved skills, there has been a renewed interest in eco-nomics for ‘‘soft’’ skills or noncognitive traits.
Experimental studies in behavioral economics have noted important differences between men and women in individual attitudes toward altruism and greed (Andreoni
and Vesterlund 2001), leadership, and competitiveness (Gneezy, Niederle, and Rus-tichini 2003). Empirical studies have found a substantial impact of these and related traits on wages. Kuhn and Weinberger (2005) find sizeable positive returns, among white males, to leadership skills ranging from 4 to 24 percent and an even larger im-pact for workers in managerial occupations.
Another trait at the opposite end of the leadership spectrum is the ‘‘external locus of control,’’ that is a belief that one’s outcomes are controlled more by external forces than by internal forces (or that chance and luck are more important for success than one’s own efforts). The effect of external locus of control on earnings, often to-gether with the effect of self-esteem, has been investigated by many authors (Gold-smith, Veum, and Darity 1997; Osborne Groves 2005; Heckman, Stixrud, and Urzua 2006; Manning and Swaffield 2008; Waddell 2006, among others). For example, us-ing the same surveys that I use, Waddell (2006) (usus-ing the NLS72) and Coleman and DeLeire (2003) (using the NELS88), find that low self-esteem and an external locus of control are associated with lower investment in human capital, among other neg-ative indicators of future labor market performance. On the other hand, Goldsmith, Veum, and Darity (1997) who include both predicted values of self-esteem and locus of control in their wage regressions, find that only self-esteem was statistically sig-nificant.
Psychologists believe that work effort reflects motivation, which is governed in part by these personality factors. Individuals with an external locus of control believ-ing that hard work and effort will be not rewarded are less likely to display high lev-els of effort on the job. On the positive side, self-esteem has been found to be a strong predictor of job performance (Judge, Tippie, and Bono 2001). Brockner (1988) argues that workers with high self-esteem will tend to be more confident about making decisions, will use their time more effectively and more produc-tively. Psychologists also expect that higher wages will enhance self-esteem, but that poor self-esteem may lead to a decline in productivity and wages which may in turn erode a person’s perception of self. Thus, theories of self-esteem formation advanced by psychologists suggest that wages and self-perception may be jointly determined, which could lead to an endogeneity problem. To avoid this potential problem, I use measures of personality traits and features obtained many years before the wages are observed.
toward money are predicted by competitiveness or the motive to outperform others. To the extent that there are gender differences in competitiveness, these will translate into gender differences in attitudes toward money.
Gender differences in the importance of people/family are well-known, but there are few attempts to study directly how they affect work-related behaviors.11In their analysis of changes in the gender pay gap, Borghans, ter Weel, and Weinberg (2006) model the importance of interpersonal interactions in the context of an assignment model, where there are positive returns to interpersonal skills. Here, I combine this dimension of altruism, the importance of ‘‘working with people rather than things,’’ with one that goes beyond interpersonal skills, the importance of ‘‘a job usefulness to others or society’’ and I focus on the implications of women’s higher demand for al-truistic rewards for earnings. Many more women than men, indeed, choose lines of work, such as education and health care, where they perform many tasks for the love of others and reap lower market rewards working for public and nonprofit organiza-tions.12Women also are more likely than men to use their time to volunteer in organ-izations with some altruistic purpose, such as schools, religious organorgan-izations, and hospitals.13
I show how, in a classic hedonic wage model (Rosen 1974) the importance of money/work can have a positive impact on earnings, while the importance of peo-ple/family can have a negative impact. By contrast with the human capital model, the hedonic wage function model is job-oriented, and indeed assumes the workers choose and change jobs on the basis of the characteristics of the job. The importance of money/work, self-esteem, and external locus of control are preferences and per-sonality features that influence the choice of wage level and the level of effort and responsibility linked to the job. The importance of people/family influences the choice of altruistic rewards of the job.
These noncognitive traits are thought to impact wages through a hedonic wage function resulting from a matching equilibrium between the employers’ wage and amenity offers, and the workers’ utility maximizing choices of job characteristics. The worker/consumer i maximizes utility over wages, effort and responsibility, and altruistic rewards
Ui¼UðWi;Ri;AiÞ ð1Þ
whereWiis the wage rate,Riis the level of effort and responsibility exerted by the worker/consumer, andAiis the level of altruistic rewards, which is derived from both market and nonmarket activities:Ai¼AM
i +AHi. The marginal utility of wages and
altruistic rewards is positive, but its sign with respect to effort and responsibility is ambiguous. To the extent that leadership and ambition denote different flavors of effort, one can see those as positively linked to utility, but when effort and respon-sibility exceed some threshold they entail a disutility.
11. Daymont and Andrisani (1984), who focus their analysis of the gender pay gap on the choice of college major, also study the effect of these values.
12. There is some evidence that men are becoming more like women on this ‘‘usefulness to others’’ dimen-sion, as found across birth cohorts in the European Value Survey (Fortin 2005).
13. On the other hand, men are more likely to volunteer as coaches in youth sports teams, in unions, pro-fessional organizations, social and political clubs, where they can use and perfect leadership skills.
Following Becker (1985), who argues that individuals have a limited amount of time and energy to split between market work and homemaking, I assume a total amount of effort and responsibility that an individual can devote to either market or nonmarket activities,Ri¼RM
i +RHi #RTi, whereRTi denotes to the total amount
available, fixed for each individual, andRHi denotes the amount of effort and
respon-sibility allocated to nonmarket activities, like household work and volunteering ac-tivities. To the extent that women carry the double-shift of housework and market work more often than men do, this implies that the marginal utility (disutility) of market effort and responsibility is greater (less) for men than for women,
@Uim=@RM
im.@Uif=@RMif, and more generally for individuals who value homemaking
and volunteering more than others.
The utility function of individuals for whom ‘‘working with people’’ and feelings of ‘‘usefulness of a job to others and society’’ are more important relative to financial rewards will be characterized by a greater marginal rate of substitution between the altruistic rewards and wages than other workers. To the extent this trait characterizes women (f) more than men (m):
For these individuals, working for philanthropic nonprofit organizations can take place at a wage cost.14Alternatively, individuals could accept a job with lower altru-istic rewards and lower effort, but volunteer in altrualtru-istic organizations or become a part-time caregiver at home. Because of the quantity constraint on effort and respon-sibility, when the worker/consumer chooses a job vectorðWi;R
iM;A
i
MÞto maximize
his/her utility, he/she simultaneously chooses a level of nonmarket effort and respon-sibility, RiH¼RiT2RiM. Similarly, the individual’s demand for the altruistic market amenity may depend on the level already provided by home and volunteering activ-ities. These potential utility maximizing choices generate a job demand locus uiðW;RM;AMÞ.
Employers are thought to be cost–minimizers, so that optimizing behavior gener-ates an offer function,fðW;RM;AMÞ, indicating unit prices that employers are will-ing to pay on various combinations of wage, effort, and altruistic amenities.15 Because it is time-consuming, the altruistic amenity is by definition costly to pro-vide.16 It is assumed that employers pay higher wages for higher levels of effort and responsibility.
Subsumed in the worker/consumer job demand functions and the employers’ offer functions are the human capital variables, which are thought to help eliminate mul-tiple equilibria.17I circumvent the identification problems (Ekeland, Heckman, and
14. For example, in the NELS88, 11.7 percent of women work for nonprofit organizations by contrast with 4.4 percent of men.
15. To the extent that some employers (for example, hospitals) are exert monopsony power in some mar-kets for altruistic jobs (for example, nursing), the offer functions cannot be seen as perfectly competitive outcomes.
16. For example, smaller classes are more rewarding to teach.
17. I could have more explicitly conditioned the utility function on the human capital variables
Nesheim 2004) associated with hedonic wage functions by including information on usually unobserved tastes for job characteristics. I simply assume that one equilib-rium is realized in the data and seek to broadly identify preferences from value state-ments and reported behaviors in a reduced-form approach. In the equilibrium assignment, we thus find a wage equation,
Wi¼gðSi;EiÞ+hðRMi Þ+tðAMi Þ;
ð3Þ
where in addition the usual human capital component,gðSi;EiÞi, with Si denoting schooling andEilabor market experience, there is a component that rewards effort and responsibilityhðRMi Þand another one that taxes altruistic amenitiestðAMi Þ.
My aim is to first assess the impact of work values and altruistic preferences on wages, then I will consider the impact of gender differentials in these traits on the gender pay gap.18The importance of money/work will prove to have an impact on wages more distinct from cognitive factors that self-esteem and external locus of control. Noncognitive factors offer a unique possibility to improve the empirical analysis of models of the household division of labor and of wage determinat-ion by incorporating variables that predate household formatdeterminat-ion and labor market decisions.19
III. Data and Descriptive Statistics
To avoid problems of ex post rationalization, I appeal to two single-cohort longitudinal surveys conducted by the National Center for Education Statis-tics (NCES) to study education issues. The National Longitudinal Study of the High School Class of 1972 (NLS72), known as the grandmother of educational longitudi-nal surveys, is widely used (Adelman 1994) outside of the education field. For exam-ple, Brown and Corcoran (1997) use it, in conjunction with the SIPP, to study the impact of gender differences in the field of the highest degree on the gender wage gap.20The NLS72 interviewed students in their senior year of high school in the spring of 1972, with followup surveys conducted in 1973, 1974, 1976, 1979, and fi-nally in 1986. While the sample is not fully natiofi-nally representative because it ignores students who dropped out before Grade 12, Krueger and Dale (2002) argue that it is representative for college graduates.
The NLS72 contains answers to many questions on what is important in life and in selecting a career. For example, respondents are asked, with reference to selecting a
18. In a previous version of the paper, I had shown that work values and altruistic preferences have behav-ioral implications of the expected signs on promotions (or training for career advancement), volunteering in either philanthropic (hospitals, youth organization, etc.) or leadership organizations (sports teams, rotary club, etc.) among men and women, and on the incidence of working part-time or long maternal leave (or the number of dependents) among women.
19. Although the influences of neurological, environmental, psychological and social factors have been im-plicated with varying degrees in the development of gender roles, it is generally recognized that gender and sex-role knowledge are acquired early in life (Ruble and Martin 1998).
20. Here I omit field of study because it is missing for a sizeable portion (more than a quarter) of the sample.
career, about the importance of‘‘Making a lot of money’’and‘‘The chance to be a leader,’’which speaks to the importance of money and ambition in work values. They are also asked about the importance of‘‘Opportunities to be helpful to others or use-ful to society,’’ ‘‘Opportunities to work with people rather than things,’’this speaks to the altruistic and social aspect of work. The survey also contains questions from the well-known Rosenberg and Rotter scales. Many of these questions are asked repeat-edly in each followup. Because of the longitudinal aspect of the survey, it is possible to use preferences expressed in a time period that precedes the behavior of interest. Wage information was recorded in the fourth followup in 1979, when most respond-ents were age 25, and in the fifth followup in 1986, when most respondrespond-ents were age 32. Note that in 1986 more respondents were likely to have completed their studies and there was more time for labor market experience to have an effect.
The National Education Longitudinal Study of 1988/94 (NELS88) interviewed students in eighth grade in the spring of 1988. A sample of these respondents was then resurveyed through four followups in 1990, 1992, 1994, and 2000, and a refreshed sample was added in the 1990 and 1992 waves to ensure a representative sample of high school sophomores and seniors in those years. The wage data was recorded in 2000 when most respondents were age 24, which leaves little time for labor market intermittency to have an effect. To enhance the comparability between the two samples, I select only respondents from the NELS88 who reached the 12th grade. The NELS88 was explicitly administered with the intent of maintaining com-parability with the NLS72, so the major components of the two studies are very sim-ilar, including the components on values important in life.
Being very detailed and complex also means that these longitudinal surveys are at times difficult to code. In particular, there is detailed information about employment and unemployment spells, which are used to construct an actual work experience var-iable, but it is not straightforward to code.21I retain individuals from the NLS72 (NELS88) who were working in 1979 or in 1986 (2000) and that have valid informa-tion on wage, educainforma-tional attainment, high school math test, and quesinforma-tions from the Rosenberg and Rotter scales.22
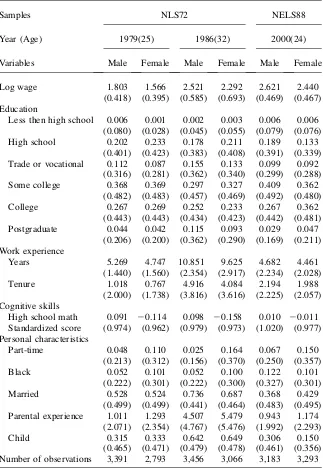
The means of the human capital variables and other individual characteristics are reported separately by gender for each time period in Table 1. They show that, in the NLS72, when workers are in their mid-twenties, women’s educational attainment is
21. In the NLS-72, the information on these spells from October 1972 to October 1979 is available in the first to the fourth followup. The information from October 1979 to July 1986 is available in terms of spells of employment for up to four jobs and unemployment for up to eight spells, thus individuals with more than eight spells of unemployment were excluded. In the NELS88, detailed labor force status by month is avail-able from June 1990 to August 1994. In 1997, 1998, and 1999, only information on whether the respondent was unemployed for more than six months was available.
Table 1
Mean and Standard Deviations of Commonly Used Variables
Samples NLS72 NELS88
Year (Age) 1979(25) 1986(32) 2000(24)
Variables Male Female Male Female Male Female
Log wage 1.803 1.566 2.521 2.292 2.621 2.440
(0.418) (0.395) (0.585) (0.693) (0.469) (0.467) Education
Less then high school 0.006 0.001 0.002 0.003 0.006 0.006 (0.080) (0.028) (0.045) (0.055) (0.079) (0.076)
High school 0.202 0.233 0.178 0.211 0.189 0.133
(0.401) (0.423) (0.383) (0.408) (0.391) (0.339) Trade or vocational 0.112 0.087 0.155 0.133 0.099 0.092
(0.316) (0.281) (0.362) (0.340) (0.299) (0.288)
Some college 0.368 0.369 0.297 0.327 0.409 0.362
(0.482) (0.483) (0.457) (0.469) (0.492) (0.480)
College 0.267 0.269 0.252 0.233 0.267 0.362
(0.443) (0.443) (0.434) (0.423) (0.442) (0.481)
Postgraduate 0.044 0.042 0.115 0.093 0.029 0.047
(0.206) (0.200) (0.362) (0.290) (0.169) (0.211) Work experience
Years 5.269 4.747 10.851 9.625 4.682 4.461
(1.440) (1.560) (2.354) (2.917) (2.234) (2.028)
Tenure 1.018 0.767 4.916 4.084 2.194 1.988
(2.000) (1.738) (3.816) (3.616) (2.225) (2.057) Cognitive skills
High school math 0.091 20.114 0.098 20.158 0.010 20.011 Standardized score (0.974) (0.962) (0.979) (0.973) (1.020) (0.977) Personal characteristics
Part-time 0.048 0.110 0.025 0.164 0.067 0.150
(0.213) (0.312) (0.156) (0.370) (0.250) (0.357)
Black 0.052 0.101 0.052 0.100 0.122 0.101
(0.222) (0.301) (0.222) (0.300) (0.327) (0.301)
Married 0.528 0.524 0.736 0.687 0.368 0.429
(0.499) (0.499) (0.441) (0.464) (0.483) (0.495) Parental experience 1.011 1.293 4.507 5.479 0.943 1.174
(2.071) (2.354) (4.767) (5.476) (1.992) (2.293)
Child 0.315 0.333 0.642 0.649 0.306 0.150
(0.465) (0.471) (0.479) (0.478) (0.461) (0.356) Number of observations 3,391 2,793 3,456 3,066 3,183 3,293
Note: Standard deviations in parentheses.
similar to men’s, but by their early thirties, more men than women have a postgrad-uate degree. In the NELS88, where the workers are in their mid-twenties, this pattern has been reversed with not only more women holding a college degree than men, but also more women holding a postgraduate degree. In these single cohorts of young workers, the differences in the labor market experience of women and men are rel-atively small (at most 13 percent). There is thus limited scope for labor market in-termittency to account for a large share of the gender wage gap. This contrasts with the recent work of O’Neill and O’Neill (2005) were differences in labor market experience and work interruptions for family reasons are found to account for more than half of the gender wage gap.
Cognitive skills are captured using high school math score measured when the respondents were in 12th grade, both in the NLS72 and NEL88. Since the samples exclude earlier dropouts, this measure of cognitive skills generally precede the real-izations of the educational attainment observed. I standardize the measure to have zero mean and a variance of one over the entire sample in each case. Thus in NSL72, the measure for women is negative while the measure for men is positive. This male advantage seemed to have shrunk somewhat in the NELS88.23Table 1 also reports the means and standard deviations of demographic characteristics commonly used in wage regressions.
Table 2 reports the descriptive statistics of the four composite noncognitive traits used in the analysis: self-esteem, external locus of control, the importance of money/ work and the importance of people/family. I report the means and standard devia-tions of the variables by gender, as well as the differences between the male and fe-male averages. First note that all the composite variables are scaled between 0 and 1 inclusively, and that the standard deviations of these variables are in the same range, from 0.141 to 0.286. Also reported in the table is Cronbach’s alpha, a measure of reliability that indicates whether the responses to each question comprising the com-posite are highly correlated.24It is computed over the sample of men and women combined.
The measures of self-esteem and external locus of control are constructed using answers to a subset of four or five questions, asked in the surveys, from the widely used Rosenberg self-esteem scale and the Rotter locus of control scale. The descrip-tion of the precise statements used and the aggregadescrip-tion method is in the Appendix. As explained in the Appendix, the responses are recoded in terms of a binary variable (1 or 0) reflecting agreement or disagreement with the statements. In these samples, the reliability indexes for self-esteem and external locus of control seem relatively low; they are, however, higher than the ones of Waddell’s (2006) Attitude and Self-Esteem indexes, also computed with the NLS72 data, which range from 0.36 to 0.50.
The measures of the importance of money/work and of people/family are con-structed using subjective questions about values generally important in life, which are asked in the base year and in each followup of the NLS72, and in selected
23. This is consistent with the literature on the gender gap in math tests.
Table 2
Mean, Standard Deviations, and Reliability Coefficient of the NonCognitive Variables
Samples NLS72 NELS88
Year (Age) 1979(25) 1986(32) 2000(24)
Variables Male Female D Male Female D Male Female D
Self-esteema 0.851 0.877
20.026 0.935 0.930 0.005 0.757 0.731 0.026 (0.286) (0.244) (0.141) (0.159) (0.144) (0.178)
[0.7967] [0.5629] [0.6310]
External locus of controlb 0.123 0.100 0.023 0.096 0.104
20.008 0.179 0.156 0.023 (0.228) (0.205) (0.181) (0.305) (0.247) (0.238)
[0.4529] [0.4858] [0.5975]
Money/workcvery important 0.447 0.390 0.057 0.456 0.391 0.065 0.561 0.518 0.043
(0.189) (0.167) (0.183) (0.160) (0.206) (0.196)
[0.5869] [0.6347] [0.5487]
People/familydvery important 0.326 0.389
20.063 0.322 0.382 20.060 0.629 0.686 20.057 (0.196) (0.199) (0.193) (0.196) (0.253) (0.254)
[0.6268] [0.6823] [0.4823]
Note: Standard deviations in parentheses. Cronach’s alpha scale measure of reliability in brackets. The composite noncognitive variables are generated using STATA’s alpha procedure, as explained in detail in the Appendix, using components measured many years before the wage data is gathered. They are on a [0,1] scale.Dis equal to the male minus the female measure.
a. The self-esteem measure is constructed using four/five questions from the Rosenberg scale. b. The external locus of control measure is constructed using four/five questions from the Rotter scale.
c. The money/work composite is constructed using the answers coded 1 for ‘‘Very important,’’ 0 otherwise to valid answers about the importance in selecting a career of ‘‘Making of lot of money’’ and of ‘‘The chance to be a leader in one line of work’’ and about the importance in life of ‘‘Being successful at work’’ and ‘‘Having lots of money.’’ d. The people/family composite is constructed using the answers coded 1 if ‘‘Very important,’’ 0 otherwise to valid answers about the importance in selecting a career of ‘‘Opportunities to be helpful to others or useful to society’’ and ‘‘Opportunities to work with people rather than things,’’ and in life of ‘‘Helping other people in the com-munity,’’ the ‘‘Ability to give children better opportunities,’’ and ‘‘Living close to parents and relatives.’’
F
ortin
followups of the NELS88 and, about values important in selecting a career, which is asked only in the base survey of the NLS72. The values selected to capture the im-portance of money/work include questions about the imim-portance in selecting a career of‘‘Making a lot of money’’and of‘‘The chance to be a leader’’and about the im-portance in life of ‘‘Being successful at work’’ and ‘‘Having lots of money.’’ As explained in the Appendix, the composite is constructed as means of the underlying answers coded 1 if ‘‘very important,’’ 0 otherwise. Recoding the variable to capture the intensity of preferences is consistent with the idea that workers who really think that money is ‘‘very important’’ are more likely to initiate bargaining talks with employers or change jobs for more money, than workers who simply think that money is ‘‘somewhat important.’’25
The importance of people/family composite is constructed using questions about the importance in selecting a career of‘‘Opportunities to be helpful to others or use-ful to society’’and‘‘Opportunities to work with people rather than things,’’ and in life of‘‘Helping other people in the community,’’the‘‘Ability to give children better opportunities,’’ and‘‘Living close to parents and relatives.’’This composite is con-structed using the same recoding as the previous variable. The reliability indexes for these two composites are in the same range as the indexes for the more com-monly used self-esteem and locus of control composites. This nevertheless indicates the potential for measurement error in these values, which should lead to an attenu-ation bias and weaker results than more precise measures would entail.
The gender differences (D) in the importance of money/work and people/family, ranging fromj0.043jto j0.065jto, are much larger than the gender differences in self-esteem and locus of control, which range from toj0.008jtoj0.026j. The gender differences in the importance of money/work and of people/family are also much more stable across surveys, despite the differences across surveys in the questions underlying the composite.26Ultimately, these gender differences will have substan-tial explanatory power toward the gender pay gap. Finally, note that the correlation between the four composite variables is relatively small. If one wanted to construct a grand composite of the four noncognitive measures, the resulting Cronbach’s alpha would be very low around 0.25.27
IV. Decomposition of Gender Wage Differentials
In this paper, I propose and implement a modification to the Oaxaca-Blinder decomposition that addresses two noninvariance problems of the methodol-ogy; these are also discussed in Oaxaca and Ransom (1994) and Oaxaca and Ransom (1999). The first one is the well-known fact that the portion of the gender wage gap
25. In a previous version of the paper, I indeed found that valuing money was a significant determinant of ‘‘having changed for a better job.’’
26. As explained in the Appendix, the greater relative weight of the‘‘Ability to give children better oppor-tunities,’’which is very important for 70 percent to 90 percent of respondents, explains the large value of people/family very important in the NELS88.
explained by differences between male and female characteristics is not invariant to whether the male or female wage structure is chosen as the reference wage structure. Here, I propose to use as reference wage structure the one under which the advantage of men is equal to the disadvantage of women. The second noninvariance problem occurs in the presence of categorical variables and entails that portions of the gender pay gap attributable to gender differences in specific categorical variables will gen-erally not be invariant to the choice of the omitted category. This problem is easily solved by appealing to a restricted least squares estimator. One attractive feature of this modified decomposition is that it is fully compatible with the usual pooled wage regression that includes a dummy for the disadvantaged group.
Let the following denote the log wage equations estimated separately for samples of males (m) and females (f), and for males and females pooled together (p)
lnwig¼b0g+Xigbg+eig; g¼f;m;p
ð4Þ
where theXiis a 13Kvector of explanatory variables andbisK31 vector of
coef-ficients. Here, I am careful to distinguish the intercept from the other explanatory variables. As shown below, this is important in the presence of categorical variables, including the gender dummies.
Under the usual assumption EðeifÞ ¼EðeimÞ ¼0, the difference between the
means of male and female log wages will be
lnwm2lnwf ¼Xmbˆm2Xfbˆf+ðbˆ0m2bˆ0fÞ:
ð5Þ
In the familiar Oaxaca-Blinder (Oaxaca 1973; Blinder 1973) decomposition, letting
DX¼Xm2Xf andDb¼bˆm2bˆf, this expression can be written as either,
lnwm2lnwf ¼DX ˆbm+XfDb+ðbˆ0m2bˆ0fÞ ¼DX ˆbf+XmDb+ðbˆ0m2bˆ0fÞ
ð6Þ
depending on whether the male or female wage structure is chosen as the reference or nondiscriminatory one, and where the first terms (DX ˆbg) capture differences due to
characteristics while the other terms denote differences to the returns to those char-acteristics.
A first problem with the Oaxaca-Blinder decomposition is that in practice, the choice of the nondiscriminatory wage structure (either male or female) will yield dif-ferent results (Cotton 1988; Oaxaca and Ransom 1994). One proposition is to use the pooled wage structure as the nondiscriminatory one (Neumark 1988; Oaxaca and Ransom 1994):
lnwm2lnwf¼DX ˆbp+½Xmðbˆm2bˆpÞ+ðbˆ0m2bˆ0pÞ2½Xfðbˆf2bˆpÞ+ðbˆ0f2bˆ0pÞ;
ð7Þ
where the second term in brackets is interpreted as the advantage of men and the third term in brackets as the disadvantage of women. An important problem with the Neumark method is that the pooled coefficients capture part of the ‘‘between’’ male and female effects, thus overstating the effects of variables with large gender differences. For example, in Table 2 of Neumark (1988), the effects of schooling (0.088) and union (0.172) in the pooled sample are larger than the same effects in
either the male (0.072 and 0.138) or female (0.062 and 0.134) samples. This occurs because, as shown in Table 1 of Neumark (1988), males have higher schooling and unionization rates than women and thus their coefficients capture part of the advan-tage of males.28In addition, if the advantage of men and the disadvantage of women are not equal, the wage structure of reference can hardly be called nondiscriminatory. A better alternative is to include gender intercept shifts, along with an identifica-tion restricidentifica-tion, in the regression of males and females pooled together29
lnwi¼g0+g0fFi+g0mMi+Xig+yi subject tog0f+g0m¼0
ð8Þ
whereFi is a female dummy andMi¼12Fiis a male dummy.30Then
lnwm¼gˆ0+ ˆg0m+Xmgˆ+ EðyijFi¼0Þ;
lnwf ¼gˆ0+ ˆg0f+Xfgˆ+ EðyijFi¼1Þ;
ð9Þ
The resulting decomposition makes the assumptions on the error terms explicit,
lnwm2lnwf ¼DX ˆg+ðgˆ0m2gˆ0fÞ+ Eðy½ ijFi¼0Þ2EðyijFi¼1Þ:
ð10Þ
The first term is the familiar portion of the pay gap attributable to differences in char-acteristics and its standard error is computed asðDXÞ#SgðDXÞiwhereSg is the
var-iance-covariance matrix of the g. The second termˆ ðgˆ0m2gˆ0fÞ corresponds to the negative of the coefficient of a female dummy in a familiar wage regression on the pooled sample when male if the omitted category and the intercept thus includes the effect of the male dummy (¼gˆ0m2gˆ0f). The last term vanishes,
EðyijFi¼0Þ2EðyijFi¼1Þ
½ ¼Covðyi;FiÞ ¼0:
where the first equality follows from the fact thatFiis a binary variable (as in Angrist and Imbens 1995), and the second one is a property of ordinary least squares. This decomposition is thus compatible with the conventional practice of including a dummy denoting the group of interest in a pooled regression to investigate the impact of belonging to a disadvantaged group (as in Equation 14). To the extent that ˆg0m
is positive and ˆg0f is negative, it is appropriate to say that these expressions are
rep-resenting the ‘‘advantage’’ of men and the ‘‘disadvantage’’ of women.
The decomposition can also be written in terms of the Neumark-Cotton decompo-sition as:
28. A similar problem can be seen in the comparison of black males/white males in Table A2 of Oaxaca and Ransom (1994) with regards to the coefficient for managers and professionals (OC1).
29. Brown and Corcoran (1997) incorporates a single gender dummy in their pooled regressions and pro-poses using the termD¼DXðbˆ
m2bˆfÞas a measure that is invariant to the choice of omitted category. The
lnwm2lnwf ¼DX ˆg+½Xmðbˆm2gˆÞ+ðbˆ0m2gˆ0Þ2½Xfðbˆf2gˆÞ+ðbˆ0f2gˆ0Þ: ð11Þ
If the coefficientsgˆ and ˆg0truly represent a nondiscriminatory wage structure, then the advantage of men will be equal the disadvantage of women. Under this proposed modification to the Oaxaca-Blinder decomposition, it easily can be verified that
ˆ
g0m¼ ½Xmðbˆm2gˆÞ+ðbˆ0m2gˆ0Þ and gˆ0f ¼ ½Xfðbˆf2gˆÞ+ðbˆ0f2gˆ0Þ; ð12Þ
and the standard errors on these two terms are obtained from the estimation of Equa-tion 8. The right-hand side expressions can be used to assign porEqua-tions of the unex-plained gender wage gap attributable to each variable k, that comes either from the advantage of men, Xmkðbˆmk2gˆkÞ, or from the disadvantage of women,
Xfkðbˆfk2gˆkÞ. Empirically, the results from this regression-compatible
decomposi-tion will be in between the female and male based decomposidecomposi-tion, like the Cotton decomposition, but not identical. A comparison of results (reported in Appendix Ta-ble A3) from the five most common decomposition methods using as reference wage structure the male coefficients, the female coefficients, the pooled coefficients (as in Neumark), the Cotton (weighted average of male and female) coefficients, and the regression-compatible coefficients makes this point and shows that the Neumark method gives extreme results.
A second problem (Oaxaca and Ransom 1999) is that the assignment of the explained part of the gender wage gap to specific variables is not invariant to the choice of the left-out category in the case of categorical variables. One solution sug-gested in Gardeazabal and Ugidos (2004), who however prefer to use a derived re-striction, is to include all categories and impose a zero-sum restriction on the estimated coefficients of each categorical variable. This is easily implemented via re-stricted least squares. Letting C denote the set of categorical variables, andCk the number of categories for variablek, Equation 8 is simply estimated subject to the restrictions:
g0m+g0f ¼0 and + Ck
j¼1
gjk¼0; k2C
ð13Þ
The categorical restrictions are also imposed in the estimations of the gender-specific log wage Equation 4.31Under these restrictions, the interceptsb0m;b0f, andg0 will not be contaminated by the effects of any left-out category and it will be possible to assign portions of the explained part of the gender wage gap to specific variables, as is done below.
In summary, the decomposition methodology consists in estimating three separate constrained linear wage regressions: one for each gender and a third regression, es-timated on the pooled sample of men and women, that includes gender intercept shifts along with an identification restriction. In addition to the constraint on the
31. Restrictions need to apply to all categorical variables, including binary variables such as part-time and full-time. These are easily implemented using a constrained linear regression.
gender parameters in the pooled regression, additional constraints for each categor-ical variable are required.32
V. Estimation Results
With the estimation of three wage structures (male, female, and non-discriminatory), the proposed decomposition procedure (like that of Neumark 1988) is more involved than the traditional Oaxaca-Blinder decomposition, yet it is easily performed with modern software. It is also compatible with the regression estimated on the pooled sample where the coefficient of the female dummy is interpreted as a measure of the unexplained gender wage gap, a regression that has long been the simplest way to study wage differentials.
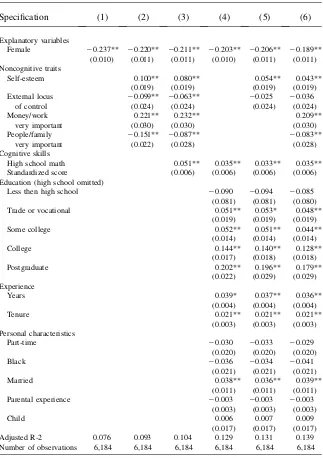
Tables 3a-c report the wage regression results for this standard specification that includes a female dummy, and treat males as the omitted category,
lnwi¼d0+d0f Fi+Xig+yi; ð14Þ
whereFiis a female dummy, andgisK31 vector of coefficients. The coefficients from this standard pooled regression are expected to lie in between the female and male coefficients estimated from the gender-specific samples. Rather than reporting all three sets of coefficients, I simply indicate the main source of discrepancies be-tween the coefficients where applicable.
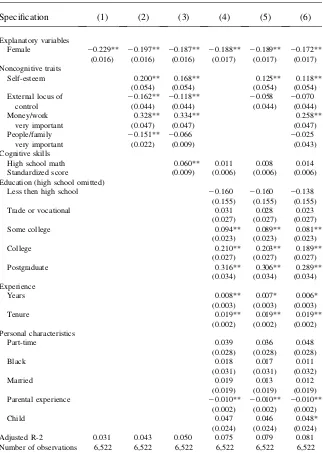
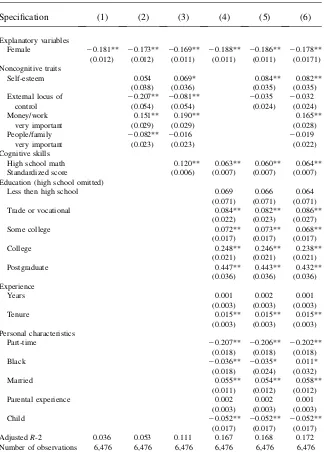
The comparison of Tables 3a (NLS72 in 1979) and 3b (NLS72 in 1986) will reflect within-cohort changes (over time and over the life cycle) in the determinants of wages, while the comparison of Tables 3a and 3c (NELS88 in 2000) will reflect between-co-hort changes (over time and across cobetween-co-horts) in the determinants of wages.33Although much research has focused on changes in the returns to education over time and across cohorts (for example, Card and Lemieux 2001; Fortin 2006), much less is known about changes in the impact of the cognitive and noncognitive factors considered here.
The results begin in Column 1 which includes only the female dummy without any other control variable: It essentially captures the raw female disadvantage. The raw fe-male disadvantage is of20.237 in 1979 and20.229 in 1986 for the NLS72 sample and of20.181 in 2000 for the NELS88 sample. As different explanatory variables are added in Columns 2–6, the magnitude of the female dummy becomes larger (or the neg-ative effect becomes smaller). Because the male-female log wage differentials are ‘‘explained’’ by additional regressors, the female dummy can be thought of as capturing of the part of gender differentials ‘‘unexplained’’ by these regressors. To the extent that a substantial part of the gender wage gap is left unexplained by the usual culprits— educational attainment and labor market experience—the estimated female dummy in this wage equation may suffer from an omitted variable bias. Adding cognitive and noncognitive factors to the regression may help reduce this bias. The cognitive and noncognitive factors are recorded before, at least several years, the wage
32. Software in STATA to implement this ‘‘Regression-Compatible Oaxaca-Blinder’’ decomposition is available on the author’s website.
Table 3a
Impact of Noncognitive Traits on 1979 Log Wage (Age 25)—NLS72
Specification (1) (2) (3) (4) (5) (6)
Explanatory variables
Female 20.237** 20.220** 20.211** 20.203** 20.206** 20.189** (0.010) (0.011) (0.011) (0.010) (0.011) (0.011) Noncognitive traits
High school math 0.051** 0.035** 0.033** 0.035** Standardized score (0.006) (0.006) (0.006) (0.006) Education (high school omitted)
Less then high school 20.090 20.094 20.085 (0.081) (0.081) (0.080) Trade or vocational 0.051** 0.053* 0.048**
(0.019) (0.019) (0.019)
Part-time 20.030 20.033 20.029
(0.020) (0.020) (0.020)
Black 20.036 20.034 20.041
(0.021) (0.021) (0.021)
Married 0.038** 0.036** 0.039**
(0.011) (0.011) (0.011) Parental experience 20.003 20.003 20.003
(0.003) (0.003) (0.003)
Child 0.006 0.007 0.009
(0.017) (0.017) (0.017) Adjusted R-2 0.076 0.093 0.104 0.129 0.131 0.139 Number of observations 6,184 6,184 6,184 6,184 6,184 6,184
Note: Standard errors are in parentheses. Significance at 5 percent level denoted by **; significance at 10 percent level denoted by *.
Table 3b
Impact of Noncognitive Traits on 1986 Log Wage (Age 32)—NLS72
Specification (1) (2) (3) (4) (5) (6)
Explanatory variables
Female 20.229** 20.197** 20.187** 20.188** 20.189** 20.172** (0.016) (0.016) (0.016) (0.017) (0.017) (0.017) Noncognitive traits
High school math 0.060** 0.011 0.008 0.014 Standardized score (0.009) (0.006) (0.006) (0.006) Education (high school omitted)
Less then high school 20.160 20.160 20.138 (0.155) (0.155) (0.155)
Trade or vocational 0.031 0.028 0.023
(0.027) (0.027) (0.027) Parental experience 20.010** 20.010** 20.010**
(0.002) (0.002) (0.002)
Child 0.047 0.046 0.048*
(0.024) (0.024) (0.024) Adjusted R-2 0.031 0.043 0.050 0.075 0.079 0.081 Number of observations 6,522 6,522 6,522 6,522 6,522 6,522
Table 3c
Impact of Noncognitive Traits on 2000 Log Wage (Age 24)—NELS88
Specification (1) (2) (3) (4) (5) (6)
Explanatory variables
Female 20.181** 20.173** 20.169** 20.188** 20.186** 20.178** (0.012) (0.012) (0.011) (0.011) (0.011) (0.0171) Noncognitive traits
High school math 0.120** 0.063** 0.060** 0.064** Standardized score (0.006) (0.007) (0.007) (0.007) Education (high school omitted)
Less then high school 0.069 0.066 0.064
(0.071) (0.071) (0.071) Trade or vocational 0.084** 0.082** 0.086**
(0.022) (0.023) (0.027)
Part-time 20.207** 20.206** 20.202**
(0.018) (0.018) (0.018)
Black 20.036** 20.035* 0.011*
(0.018) (0.024) (0.032) AdjustedR-2 0.036 0.053 0.111 0.167 0.168 0.172 Number of observations 6,476 6,476 6,476 6,476 6,476 6,476
Note: Standard errors are in parentheses. Significance at 5 percent level denoted by **; significance at 10 percent level denoted by *.
realizations and are likely capturing part of an individual fixed effect that may be con-stant over time. It is also of interest to know whether the ‘‘hard’’ as well as the ‘‘soft’’ factors have the anticipated effects on wages, before considering their effect of the gen-der pay gap. I discuss the magnitude of the effects of noncognitive skills to point out that they are not trivial in comparison with educational attainment and cognitive skills, but they do not have a clear interpretation in terms of a marginal effect, like the returns to education for example.
Column 2 adds the four noncognitive factors together. As sole explanatory varia-bles, they are all generally statistically significant. As found elsewhere, the self-esteem variable is positively linked to log wages, with an effect ranging from 0.05 to 0.2, while the external locus of control has a negative effect ranging from20.1 to 20.2. In the gender-specific regressions (not shown), the point estimates cover a somewhat larger range, but the male and female coefficients for self-esteem and external locus of control are not statistically different.
The other two noncognitive factors—importance of money/work and people/fam-ily—also have very significant effects. In the NLS72, these effects are larger in mag-nitude than the first two factors, in particular the importance of money/work, which ranges from 0.2 to 0.3. The importance of people/family has an effect which ranges from20.8 to20.15 in these simple regressions. In the NELS88, the more important noncognitive factor in this first regression is external locus of control. In the gender-specific regressions (not shown), the point estimates again cover a somewhat wider range and the male and female coefficients are not statistically different, with the ex-ception, in 1986, of the female coefficient on the importance of money, which is sta-tistically and economically larger (0.6 versus 0.15) than the male coefficient.
Column 3 includes the cognitive measure along with the four noncognitive factors. This absorbs some part of the explanatory power of the noncognitive factors, reflecting the correlation between these factors and cognitive skills. The changes however are generally not statistically significant, but the importance of people/family is rendered insignificant in the 1986 and 2000 sample. This is consistent with the casual observation that people and math skills are sometimes orthogonal. The impact of math skills on wages, ranging from 0.05 to 0.12, is comparable to the impact of one or two years of postsecondary education and is more precisely estimated. The gender-specific regres-sions reveal that the impact of math skill on female wages is statistically larger (0.17 vs. 0.08 in 2000) than the impact of this skill on male wages for workers in their mid-twen-ties. It is also interesting to note the impact of math skills on wages has almost double across the two cohorts of workers in their mid-twenties (Tables 3a and 3c), perhaps an implication of the increased used of technology in the workplace. On the other hand, the impact of math skills on the wages of workers in their early thirties is not significant, possibly absorbed by the postgraduate degree dummy.
well-known stylized facts, show significantly larger returns to college and postgraduate education for females than for males.
In the NLS72 (Tables 3a and 3b), the impact of actual work experience for these young workers is smaller then usually estimated; indeed in 2000, it is not significant. With ten-ure also capturing a significant part of the on-the-job training and relatively little age var-iation across the high school cohort, this is not too surprising. In the NELS88 (Table 3c), there is actually no experience premium among these 24 year olds.34To help benchmark the impact of noncognitive factors, let’s note that the impact of tenure (measured in years) on log wages is about 0.02 in both high school cohorts. Finally, let’s note that there are no significant differences in the returns to tenure between males and females.
Columns 5 and 6 bring back the noncognitive factors in two steps. First, in Col-umn 5 only self-esteem and external locus of control are included, then all four fac-tors are included in Column 6. The coefficients of the noncognitive facfac-tors change very little from Columns 5 to 6, reflecting the fact that these factors are not highly correlated. But the comparison of the two specifications shows that the importance of money/work has the greatest effect on the unexplained part of the gender gap, as cap-tured by the gender dummy, which I turned to next.
In summary, the wage regressions in Column 6 include the traditional human capital variables, educational attainment, and labor market experience, a measure of cognitive skills, four noncognitive factors, and some personal characteristics as controls. In this specification, the most significant noncognitive factor that is positively correlated with wages is the importance of money/work. With this more complete specification, the coefficients of the importance of money/work from the gender-specific regressions no longer show a statistically significant difference between men and women. In 1986 and 2000, self-esteem is the second most significant noncognitive factor that is also positively correlated with wages. The coefficient of the two other noncognitive fac-tors—external locus and the importance of people/family—are of the expected sign, that is negative, but they are not significant with the exception of the importance of peo-ple/family in 1979. These results are consistent with the model presented in Section II, which argues that the wage rate will be positively correlated with preferences toward money/work and negatively correlated with preferences toward people/family. In the latter case, the results are however only significant in the earlier period. I now turn to the implications of these findings for the gender pay gap.
Tables 4a-c present the results of the regression-compatible Oaxaca decomposition performed by estimating Equations 8 and 9 subject to Restrictions 13. The decom-positions are compatible with the simple wage regression of Equation 14 in the sense the sum of the advantage of men and disadvantage of women in the row A3 of Table 4 (expressed in log points) corresponds exactly to the coefficients (times 100) of the female dummy displayed in the first row of Table 3. That is,d0f ¼2ðg0m2g0fÞ, we
also haved0¼g0+g0m. This unexplained part of the gender pay gap, sometimes at-tributed to discrimination, does not show much decline across cohorts, going from 18.9 log points in 1979 to 17.8 log points in 2000 among workers in their mid-twen-ties, or within cohort, going from 18.9 to 17.3 log points from 1979 to 1986, as
34. The exclusion of workers with missing data on math score may be at play. These include a number of men with trade and vocational degrees, in analyses where these were included a small positive experience premium of 0.007 is found.
workers move from their mid-twenties to early thirties. It is important to note how-ever, that this unexplained part is somewhat large in comparison with other studies, because controls for occupational gender segregation, which may be affected by the noncognitive factors, have been left out.35
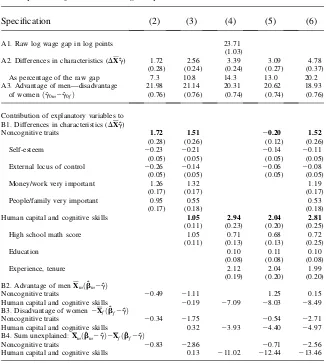
Table 4a
Decomposition of the Gender Wage Gap 1979 2NLS72
Specification (2) (3) (4) (5) (6)
A1. Raw log wage gap in log points 23.71 (1.03) A2. Differences in characteristics (DX ˆg)
As percentage of the raw gap
1.72 2.56 3.39 3.09 4.78 B1. Differences in characteristics (DX ˆg)
Noncognitive traits 1.72 1.51 20.20 1.52
(0.28) (0.26) (0.12) (0.26)
Self-esteem 20.23 20.21 20.14 20.11
(0.05) (0.05) (0.05) (0.05) External locus of control 20.26 20.14 20.06 20.08
(0.05) (0.05) (0.05) (0.05)
Money/work very important 1.26 1.32 1.19
(0.17) (0.17) (0.17)
People/family very important 0.95 0.55 0.53
(0.17) (0.18) (0.18)
Human capital and cognitive skills 1.05 2.94 2.04 2.81
(0.11) (0.23) (0.20) (0.25) High school math score 1.05 0.71 0.68 0.72
(0.11) (0.13) (0.13) (0.25)
Noncognitive traits 20.49 21.11 1.25 0.15 Human capital and cognitive skills 20.19 27.09 28.03 28.49 B3. Disadvantage of women2Xfðbˆf2gˆÞ
Noncognitive traits 20.34 21.75 20.54 22.71 Human capital and cognitive skills 0.32 23.93 24.40 24.97 B4. Sum unexplained:Xmðbˆm2gˆÞ2Xfðbˆf2gˆÞ
Noncognitive traits 20.83 22.86 20.71 22.56 Human capital and cognitive skills 0.13 211.02 212.44 213.46
Note: Standard errors are in parentheses. The bold face numbers sum up the corresponding differences in characteristics. The decompositions are compatible with the regression in Table 3a, with each column cor-responding to specification from that table. However, the actual regressions used in the computations follow the specifications of Equations 9, 10, and 13, and are thus impervious to the left-out category problem.
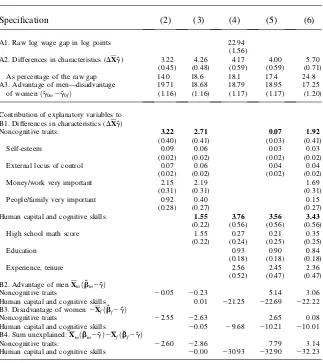
The part of gender pay accounted for by gender differences in all included char-acteristics is reported in Row A2 of Tables 4a-c. Among workers in their early thir-ties in 1986 (Table 4b), more men than women have a postgraduate degree and there is close to one year gender gap in labor market experience so that the human capital variables explain as much as 3.8 log points of the gender pay gap. For workers in their mid-twenties, the explanatory power of human capital variables is as high as
Table 4b
Decomposition of the Gender Wage Gap 1986—NLS72
Specification (2) (3) (4) (5) (6)
A1. Raw log wage gap in log points 22.94 (1.56) A2. Differences in characteristics (DX ˆg)
As percentage of the raw gap
3.22 4.26 4.17 4.00 5.70 B1. Differences in characteristics (DX ˆg)
Noncognitive traits: 3.22 2.71 0.07 1.92
(0.40) (0.41) (0.03) (0.41)
Self-esteem 0.09 0.06 0.03 0.03
(0.02) (0.02) (0.02) (0.02) External locus of control 0.07 0.06 0.04 0.04
(0.02) (0.02) (0.02) (0.02)
Money/work very important 2.15 2.19 1.69
(0.31) (0.31) (0.31)
People/family very important 0.92 0.40 0.15
(0.28) (0.27) (0.27)
Human capital and cognitive skills 1.55 3.76 3.56 3.43
(0.22) (0.56) (0.56) (0.56) High school math score 1.55 0.27 0.21 0.35
(0.22) (0.24) (0.25) (0.25)
Noncognitive traits 20.05 20.23 5.14 3.06 Human capital and cognitive skills 0.01 221.25 222.69 222.22 B3. Disadvantage of women2Xfðbˆf2gˆÞ
Noncognitive traits 22.55 22.63 2.65 0.08 Human capital and cognitive skills 20.05 29.68 210.21 210.01 B4. Sum unexplained:Xmðbˆm2gˆÞ2Xfðbˆf2gˆÞ
Noncognitive traits: 22.60 22.86 7.79 3.14 Human capital and cognitive skills 20.00 230.93 232.90 232.23
Note: Standard errors are in parentheses. The bold face numbers sum up the corresponding differences in characteristics. The decompositions are compatible with the regression in Table 3b, with each column cor-responding to specification from that table. However, the actual regressions used in the computations follow the specifications of Equations 9, 10, and 13, and are thus impervious to the left-out category problem.
2.9 log points in 1979 (Table 4b) and -2.2 log points in 2000 (Table 4c). Because in 2000 the educational attainment of women in their mid-twenties is higher than men’s, educational attainment has negative explanatory power.
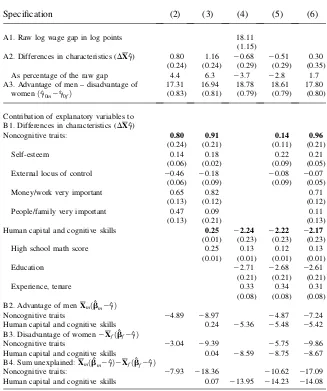
Table 4c
Decomposition of the Gender Wage Gap 2000—NELS88
Specification (2) (3) (4) (5) (6)
A1. Raw log wage gap in log points 18.11 (1.15) A2. Differences in characteristics (DX ˆg)
As percentage of the raw gap
0.80 1.16 20.68 20.51 0.30 (0.24) (0.24) (0.29) (0.29) (0.35)
4.4 6.3 23.7 22.8 1.7 A3. Advantage of men – disadvantage of
womenðgˆ0m2gˆ0fÞ
17.31 16.94 18.78 18.61 17.80 (0.83) (0.81) (0.79) (0.79) (0.80)
Contribution of explanatory variables to B1. Differences in characteristics (DX ˆg)
Noncognitive traits: 0.80 0.91 0.14 0.96
(0.24) (0.21) (0.11) (0.21)
Self-esteem 0.14 0.18 0.22 0.21
(0.06) (0.02) (0.09) (0.05) External locus of control 20.46 20.18 20.08 20.07
(0.06) (0.09) (0.09) (0.05)
Money/work very important 0.65 0.82 0.71
(0.13) (0.12) (0.12)
People/family very important 0.47 0.09 0.11
(0.13) (0.21) (0.13)
Human capital and cognitive skills 0.25 22.24 22.22 22.17
(0.01) (0.23) (0.23) (0.23) High school math score 0.25 0.13 0.12 0.13
(0.01) (0.01) (0.01) (0.01)
Education 22.71 22.68 22.61
(0.21) (0.21) (0.21)
Experience, tenure 0.33 0.34 0.31
(0.08) (0.08) (0.08) B2. Advantage of menXmðbˆm2gˆÞ
Noncognitive traits 24.89 28.97 24.87 27.24 Human capital and cognitive skills 0.24 25.36 25.48 25.42 B3. Disadvantage of women2Xfðbˆf2gˆÞ
Noncognitive traits 23.04 29.39 25.75 29.86 Human capital and cognitive skills 0.04 28.59 28.75 28.67 B4. Sum unexplained:Xmðbˆm2gˆÞ2Xfðbˆf2gˆÞ
Noncognitive traits: 27.93 218.36 210.62 217.09 Human capital and cognitive skills 0.07 213.95 214.23 214.08
Against this backdrop of human capital and cognitive factors accounting for a rel-atively low and declining share of the gender pay gap, the noncognitive factors figure relatively well. These factors account for 32 percent in 1979 and 34 percent in 1986 of the explained gender pay gap in the full specification in the NLS72, and for 320 percent in 2000 in the NELS88. Among workers in their early thirties (1986 NLS72 sample), the noncognitive factors account for 1.9 log points in the full specification (Column 6, Table 4b) and for 3.2 log points by themselves (Column 1). The larger share is accounted for by the importance of money/work with 1.7 log points in Col-umn 6 and 2.2 log points in ColCol-umn 1. Among workers in their mid-twenties, the noncognitive factors account for 1.5 log points in 1979 and close to 1 log points in 2000 in the full specification. Underlying the reduced explanatory power of the importance of money/work in 2000 is a decline in the gender gap in this noncognitive factor, shown in Table 2. In 2000, young women have become more comparable to young men not only in terms of educational attainment, but also in terms of valuing success at work and money. From 1979 to 2000, the gender wage gap among workers in their mid-twenties has declined by a 5.6 log points (from 23.7 to 18.1 log points). While human capital and cognitive factors account for most of the change, 5.0 (¼2.8– (-2.2)) log points, the noncognitive factors contribute an additional 0.6 (¼1.5–0.9) log points, thus accounting for all the change of the pay gap.
VI. Conclusion
In this paper, I use two high school-cohort longitudinal surveys, the NLS72 and the NELS88, to study the impact of four noncognitive factors on wages, and on the gender pay gap in 1979, 1986 (NLS72), and 2000 (NELS88). The four noncognitive factors include two commonly used measures, the Rosenberg self-esteem and the Rotter locus of control scales, and two other factors closely linked to gender roles in the traditional household division of labor. They are the importance of money/work and the importance of people/family. The comparison of the evolu-tion of the gender gap and its determinants between 1979 and 2000 compares work-ers in their mid-twenties across cohorts. The 1979 and 1986 comparison considwork-ers a within-cohort evolution of the gender pay gap among workers in their mid-twenties and early thirties.
The noncognitive factors are thought to account for wage differentials through the workers’ demands for wages, effort and responsibility, and altruistic rewards on the job, which interact with the employers’ offers of job combinations of wages, effort and responsibility, and altruistic rewards in the context of a hedonic wage function. Like for hours of work, there is a quantity constraint on the amount of effort and re-sponsibility that an individual can allocate between market and nonmarket activities. Gender differences in levels of effort and responsibility allocated to market activities and in desired levels of altruistic rewards from market and nonmarket activities may arise from traditional gender roles, which are learned early in life.
I do indeed find more important gender differences in the importance of money/ work and the importance of people/family than in the other two, more commonly used, noncognitive measures. For example, considering the components underlying the importance money/work, men tend to be more ambitious and value money more: