The Behavioral Dynamics
of Youth Smoking
Donna B. Gilleskie
Koleman S. Strumpf
A B S T R A C T
Individual smoking behavior persists over time, but is this repeated behavior attributed to past use or individual heterogeneity? Using longitudinal data on teens from all 50 United States from 1988 to 1992, we find a significant causal role for endogenous past cigarette consumption even after controlling extensively for observed and unobserved heterogeneity. We also find measur-able evidence of different sensitivities to cigarette price depending on past use. These two findings suggest that a cigarette price increase will have a larger aggregate effect in the long run than in the short run as more individ-uals accumulate in the price-sensitive nonsmoking group.
I. Introduction
Smoking is one of the primary public health concerns in the United States. Many of the deleterious effects of smoking are associated with long-term use. This suggests that efforts to alter smoking behavior, whether to prevent initiation, encourage cessation, or reduce relapse, would benefit from an understanding of smok-ing dynamics—the dependence of current smoksmok-ing choices on past smoksmok-ing behav-ior. It is well known that individual smoking behavior is quite persistent. Individuals who smoked in the past are several times more likely to smoke today relative to pre-vious nonsmokers. For example, using data from the National Education Longitudinal Study, 75 percent of youth aged 14 to 18 who smoked in the past continue to smoke
Donna B. Gilleskie and Koleman S. Strumpf are associate professors of economics at the University of North Carolina at Chapel Hill. Dan Benjamin, David Blau, Bill Evans, Michael Grossman, Thomas Mroz, Rosalie Liccardo Pacula, Jeanne Ringel, and seminar participants at the 2000 ASSA/AEA Annual Meetings, the Triangle Applied Microeconomics Conference, the UNC-CH Health Economics Workshop, Brown University, the Federal Trade Commission, and the Kenan-Flagler Business School provided valu-able comments on the paper. The authors thank the Department of Education for access to the restricted use National Education Longitudinal Survey (NELS) data. Researchers interested in replicating this work should contact the authors for information about obtaining restricted use NELS data. Financial support from the National Institutes for Health (grant #1RO1HD42256-01) is gratefully acknowledged.
[Submitted March 2003; accepted January 2005]
ISSN 022-166X E-ISSN 1548-8004 © 2005 by the Board of Regents of the University of Wisconsin System
at the survey date; only 10 percent of nonsmokers in this group begin smoking. Previous smoking intensity also seems to matter: 31 percent of light smokers quit smoking while fewer than 13 percent of heavy smokers quit. There is also movement toward higher levels of smoking in the future among those who were moderate or heavy smokers in the past.1
In this paper we seek to measure the significance of previous smoking behavior as a causal contributor to smoking persistence. We refer to this possibility as state dependence. For example, previous smoking consumption might alter the current util-ity of different smoking alternatives, it might reflect different sensitivities to price, or it might impact health that influences the expected value of future smoking alterna-tives. What we call state dependence is often referred to as addiction.2However, it is also possible that smoking persistence stems largely from individual heterogeneity. Individual differences, both observed and unobserved, may lead some to be prone to smoke and others to abstain. For example, health-conscious individuals might never smoke while present-oriented individuals always smoke. These two explanations for persistent behavior are laid out and formalized in Heckman (1981) and are now stan-dard terminology in the economics literature. Our goal is to determine the importance of state dependence for smoking behavior after extensively controlling for individual heterogeneity.
Understanding the explanations for smoking persistence has important implications for public policy. Government taxes continue to be the main policy tool used to lower smoking rates, and the average state plus federal tax rate has doubled between 1998 and 2003. The effectiveness of these tax increases in reducing smoking rates over the long run depends crucially on the source of smoking persistence. Suppose one’s smoking history does alter current choices, and that smokers are less price sensitive than nonsmokers (a point we document later). Taxes are quite powerful in this case: By discouraging some individuals from smoking today, they will increase the pro-portion of relatively more price-sensitive nonsmokers in the future. This composi-tional change produces a multiplier effect as future taxes become more effective at reducing aggregate smoking rates. Alternatively, suppose smoking persistence is largely due to individual heterogeneity. In this case, taxes are not very powerful. Individual factors, rather than prices, are the primary determinant of current and long-run smoking decisions.
We disentangle the roles of previous smoking behavior and individual hetero-geneity (that is, observed and unobserved individual characteristics) in smoking decisions using detailed panel data on U.S. teenagers. The National Education Longitudinal Survey (NELS) follows a representative sample of eighth graders in two-year waves beginning in 1988 and is described in detail in Section II. There are three reasons why we focus on teenagers and use the NELS data. First, teens are the
Gilleskie and Strumpf 823
1. In addition, smoking is initiated at an early age. Almost 42 percent of current or former adult smokers start younger than age 16 and 75 percent start younger than age 19 (Gruber 2001). Although individuals younger than age 18 consume only 2 percent of the total amount of cigarettes smoked in a year in the United States, such teen smoking has long-term dynamic implications because youth smoking appears to persist into adulthood (U.S. DHHS 1994).
focus of many policy discussions. NELS is rather unique because it tracks a wider population than other youth surveys. It includes teens from every state, which allows us to utilize price variation in all 50 states, and follows school dropouts. Second, a majority of smokers first try cigarettes when they are teenagers and youth smoking often persists into adulthood. While many other surveys have limited information about smoking initiation, which can occur years prior to the first interview and is often only known from retrospective self-reports, we accurately observe when smok-ing begins in our data. This allows us to avoid potentially serious sample selection problems or the need to estimate a simplified reduced-form initial condition equation representing previous smoking behavior. Third, studying teens provides insights into the state dependence of smoking decisions. We take advantage of the multiple obser-vations per person to account for individual heterogeneity and to determine the extent to which previous smoking behavior causally influences current choices. Finding a significant role for past smoking behavior among teens would suggest that smoking, even the first short-duration experience, can rapidly modify behavior.
We describe our empirical methods in Section III. We jointly estimate a set of equations that capture smoking participation and conditional demand. The empiri-cal model allows previous smokers and nonsmokers to have different tastes for smoking and different price sensitivities. Tastes are distinguished by observed char-acteristics—which include time-varying information on individual demographics, parents, schools, and the community—as well as by unobserved (to the econome-trician) individual heterogeneity that is treated in a general semiparametric fashion. Thus the model allows changes or persistence in behavior to be driven by individ-ual heterogeneity as well as by previous smoking choices. We use the discrete fac-tor random effects methodology introduced by Heckman and Singer (1984) and extended by Mroz (1999). This method allows correlation in unobservables across multiple equations without imposing a distributional form and has been used in a wide variety of empirical applications including health (Goldman 1995; Cutler 1995), welfare participation (Hoynes 1996), child care (Blau and Hagy 1998; Hu 1999), disability insurance (Kreider and Riphahn 2000), and program evaluation (Angeles et al. 1998).
Our estimates are presented in Section IV. The results depend crucially on two modeling features: whether individual smoking history is treated as exogenous or endogenous and whether unobserved individual heterogeneity is omitted or included. We find that previous smoking behavior has a causal effect, even after allowing for extensive individual differences. For example, after controlling for both observed and unobserved heterogeneity, smoking lightly in eighth grade (as opposed to not smok-ing) doubles the probability of choosing to smoke two years later, and smoking par-ticipation rates are one-fifth higher four years later. The strong role of previous use is impressive given that the teens in our sample have been smoking for no more than a few years. Alternatively, if we do not control for the unobserved heterogeneity asso-ciated with persistent behavior, this effect is biased upward and overstates the role of previous smoking behavior. For example, smoking lightly in eighth grade quadruples participation rates two years later and more than doubles them four years later. We also find that previous nonsmokers are more price sensitive than previous smokers with participation price elasticities of −0.48 and −0.16, respectively. Our preferred results suggest that prices serve both to reduce consumption of smokers and also to The Journal of Human Resources
reduce the number of new smokers. Alternatively when previous behavior is pre-sumed exogenous, prices only affect consumption among smokers. Our modeling extensions allow us to simulate the long-run effects of policy changes as the popula-tion composipopula-tion of smokers and nonsmokers is altered. In total, a dollar increase in cigarette prices reduces age 18 smoking participation predictions by a third more when unobserved individual heterogeneity and behavior modification are taken into account than when they are ignored.
Our paper contributes to the large economics literature on cigarette consumption that is reviewed in Chaloupka and Warner (2001). To place our methods and results in context, we briefly mention here some of the work upon which our paper builds. We focus on papers that use individual-level panel data, as opposed to aggregate time series or repeated cross-sections, since multiple observations on individuals allow a researcher to disentangle state dependence from individual heterogeneity. We first dis-cuss efforts in the relevant literature to incorporate previous smoking behavior and then the addition of future consumption and prices.
To account for the endogeneity of past smoking behavior, Chaloupka (1991) instru-ments lagged consumption using several lags of prices and taxes in a two-stage approach. The recently developed estimation strategies that we employ lead to signif-icant efficiency improvements over the instrumental variable approach and its poten-tial weak instrument critique.3 Other research that explicitly considers previous smoking behavior focuses only on the decisions to start or stop smoking.4DeCicca et al. (2002) also use NELS data to determine the immediate effects of prices, nontax policies, and schooling on the single transition from nonsmoking to smoking among teens. Tauras and Chaloupka (2001) estimate smoking cessation hazards, while Douglas (1998) separately estimates smoking initiation and quitting decisions. We unify the approaches in these papers by jointly modeling all decisions (that is, initia-tion, continuainitia-tion, cessainitia-tion, and relapse) and by considering the general impact of previous consumption, both participation and intensity, on current smoking decisions. This allows us to more broadly understand the role of previous smoking behavior, since we study participation of both former nonsmokers and former smokers. Continuing to follow all individuals, even those changing their behavior, permits us to simulate dynamic responses to policy changes. Labeaga (1999) has a focus similar to our work. He separately estimates dynamic participation and conditional intensity equations and accounts for unobserved heterogeneity. We disaggregate his results which rely on household, rather than individual, data and explain expenditures on all tobacco-related products, rather than consumption of cigarettes.
In addition to dependence on previous smoking decisions, theoretical models of smoking behavior suggest that cigarette consumption today also depends on future consumption and future cigarette prices. The rational addiction model (Becker and Murphy 1988) implies that individuals respond to future events. Empirical tests of such rational behavior have found that leads of consumption and leads of price are
statisti-Gilleskie and Strumpf 825
3. Our panel data also provide recent and relatively accurate reports of behavior as opposed to the retro-spective data that Chaloupka employs. In addition, while he includes no controls for (unobserved) state-level heterogeneity, we show that this omission imparts a significant negative bias on price effects.
cally significant predictors of current smoking behavior.5We do not include these future variables in our specifications. The empirical rational addiction model assumes these variables are known with perfect foresight. We contend that current behavior is a function of the entire distribution of future values for all consumption options and prices, not just those that are observed. These distributions are a function of currently available information, potentially including all lags of behavior and prices. Our empir-ical strategy controls for all of these lags. However, we cannot test whether future vari-ables matter in a nonstructural framework. Our empirical model does not explicitly estimate the underlying preference parameters or how individual expectations are formed, and so it is mute about whether there is forward-looking behavior.6Hence, one may interpret our model as myopic in the accepted rational addiction framework. We believe that a true test of both the addictive nature of smoking behavior and the rational aspect of behavior requires solution of the individual’s forward-looking optimization problem and estimation of the primitives of the model. We do not intend to estimate these structural parameters here, and reserve that for future work.
Our work contributes to the smoking demand literature in two ways. First, we pro-vide empirical epro-vidence of state dependence—the statistically significant effect of endogenous previous smoking consumption on current smoking decisions—within a unified framework that accounts for unobserved heterogeneity and allows for all pos-sible transitions in behavior. Second, our work refines long-run simulations of smok-ing behavior because our predictions reflect the changsmok-ing composition of smokers and nonsmokers, and the subsequent differences in price sensitivities portrayed by these different groups. This approach improves upon long-run predictions that ignore the role of previous behavior, presume it is exogenous, or loosely proxy for it using instruments. Failing to model previous smoking choices precludes measuring the compositional changes in the population over time and hence significantly underesti-mates the long-run price response.7
II. Description of the Data
Despite a great interest in the United States in understanding youth smoking behavior, few nationally representative data sets are available that chronicle the behavior of the same children over multiple periods of time. The National Education Longitudinal Study of 1988 (NELS) is one exception. NELS, a continuing study sponsored by the U.S. Department of Education’s National Center for Education Statistics, began in 1988 with the specific purpose of collecting informa-tion on educainforma-tional, vocainforma-tional, and personal development of a nainforma-tionally representa-The Journal of Human Resources
826
5. Becker et al. (1994), an important paper that uses aggregate data, is among the first tests of the rational addiction model. Chaloupka (1991) is the first to use microlevel data to test this model.
6. Because we do not estimate policy-invariant structural parameters, we only simulate policies that exist within the data.
tive sample of eighth graders as they transition from middle school into high school, through high school, and into postsecondary institutions and the work force. Approximately 24,500 eighth graders in more than 1,000 public and private schools in all 50 states participated in the first wave of the study. In addition to the student questionnaires, supplementary questionnaires were administered to the students’ par-ents, teachers, and school principals, and provide a wealth of information on the early social and academic environment of the students. Through special agreement with the U.S. Department of Education, we obtained access to restricted-use NELS data that include geographic information. These data, supplemented with state-level price and tax data (Tobacco Institute 1997) and measures of inflation, allow us to determine the appropriate real cigarette price each individual faces in every year.
The first followup, administered in the spring of 1990, includes responses from approximately 17,500 of the students from the 1988 base year interview, while the second followup, administered in the spring of 1992, includes approximately 16,500 students from the original cohort.8One of the many unique features of the NELS data is that youth who leave high school prior to graduation continue to be interviewed throughout the longitudinal study and are asked the same questions pertaining to smoking behavior. It is therefore possible to examine the smoking behavior of all youth, including those not represented in other national school-based surveys such as Monitoring the Future. The NELS data contain information on the student’s back-ground, upbringing, early family environment, early school environment, and other behaviors. It provides many variables that have been found to be significant risk fac-tors for smoking such as school performance, religious affiliation, family structure and living arrangement, and parental education. Since parents are surveyed in the base year and second followup, it is possible to obtain time-varying information on family background and socioeconomic characteristics that the student would not be as informed about. In the first and second followup, school principals and teachers con-tinue to be surveyed, making it possible to control for important school environmen-tal characteristics as well.
We model the behavior of youths who are observed in each year (1988, 1990, and 1992) of the survey; we do not model attrition from the full sample. We keep only those youth who were on grade during the sample period or who were per-manent dropouts (12,954 youth). We are forced to drop 2,237 kids for whom smok-ing behavior is unobserved. Because prices differ by state, another 270 are dropped if we cannot identify the state in which they live or go to school, and 196 are dropped if they do not reside in the same state in all three waves.9After deleting 18 individuals for whom other important variables are missing, our sample consists of three years of observations on 4,755 males and 5,478 females (30,699 person-year observations).
Gilleskie and Strumpf 827
8. A third followup was administered in 1994 but does not contain information on smoking behavior. A fourth followup was administered in the spring of 2000 but the restricted use file is unavailable as of sum-mer 2004.
Information on smoking behavior is collected in each wave of the survey. In each year, youths are asked, “How many cigarettes do you currently smoke in a day?” Responses are limited to the following categories: do not smoke, smoke less than one cigarette a day, smoke one to five cigarettes, smoke about a half pack (6–10), smoke more than half a pack but less than two packs (11–39), and smoke two packs or more (40+). Table 1 reveals that 4.6 percent of youths reported smoking in the eighth grade (1988), while 22.7 percent reported smoking four years later. The dramatic increase in smoking rates is not surprising given that smoking initiation typically occurs during the late teens. We also form indicators of the quantity smoked conditional on being a smoker.10Table 1 indicates that smokers appear to be smoking larger quantities over time.
Table 1 also illustrates the pattern of smoking behavior over time by conditioning current smoking choices on past smoking consumption.11The probability of quitting if one was a moderate (6–10 cigarettes/day) or heavy (11+ cigarettes/day) smoker decreases dramatically as these youth age. Smokers who continue to smoke also tend to migrate to higher levels of smoking over time. For example, one-half of previous heavy smokers who continue to smoke continue smoking heavily in 1990 while almost three-fourths of them continue to smoke heavily in 1992. Additionally, the proportion of nonsmoking youth who remain nonsmokers is fairly constant after 1988, and the proportion of light smokers (1–5 cigarettes/day) who quit smoking is not declining.
The rich set of variables used to explain variations in individual smoking behavior are summarized in Table 2. These include both stationary and time-varying variables describing characteristics of the student, his family, and his school. In general (although not shown in the table), adolescent smokers are older white youth with lower test scores and socioeconomic status than nonsmokers. They are more likely to have older siblings, to have siblings who dropped out of school, to have one parent absent from the home, and to report no religion. Additionally, our data contain sig-nificant variation in youth smoking rates and cigarette prices across states and within states over time. Smoking rates by state vary by over 10 percentage points in 1988 and by as much as 17 percentage points by 1992. There is about a one dollar range in real cigarette prices per pack over the 1988-1992 period, with prices averaging $1.41.12
III. Empirical Model
The theoretical model of Becker and Murphy (1988) characterizes the framework on which most empirical analyses of smoking are based. Recognizing the The Journal of Human Resources
828
10. Because the response “smoke less than one cigarette a day” is available only in 1990, we group this out-come with “smoke one to five cigarettes.” Due to the small number of responses in the 40+category, our top category is defined as “smoke more than half a pack.”
11. Because very few children younger than age 14 smoke, because most individuals are age 14 or older in eighth grade, and because our data do not indicate first age smoking if initiation occurred before eighth grade, we assume that no teens in our sample smoked prior to eighth grade.
Gilleskie and Strumpf
829
Table 1
Dynamic Smoking Transitions of the Sample
Cigarette Use in t(conditional on smoking)
Smoke any Smoke 1–5 cigarettes Smoke 6–10 cigarettes Smoke 11+ cigarettes
t= 1988
Cigarette use in 1986
0 cigarettes/day 4.60 66.45 17.20 16.35
t= 1990
Cigarette use in 1988
0 cigarettes/day 13.37 69.12 17.09 13.79
1–5 cigarettes/day 67.73 44.81 32.55 22.64
6–10 cigarettes/day 80.25 13.85 43.08 43.08
11+ cigarettes/day 68.83 18.87 30.19 50.94
Unconditional on prior use 15.98 62.14 20.55 17.31
t= 1992
cigarette use in 1990
0 cigarettes/day 12.48 64.59 19.20 16.22
1–5 cigarettes/day 67.81 51.52 30.48 18.00
6–10 cigarettes/day 90.77 13.11 47.21 39.67
11+ cigarettes/day 90.11 8.63 17.65 73.73
Unconditional on prior use 22.69 47.80 26.06 26.14
The Journal of Human Resources
830
Table 2
Descriptive Statistics of the Sample
Standard Standard Standard
Variable Mean Deviation Variable Mean Deviation Variable Mean Deviation
Student characteristics Household characteristics School characteristics
Female* 0.54 0.50 Guardian born before 1940* 0.10 0.30 Public school 0.82 0.39 Guardian born 1940–55* 0.79 0.41 (Private omitted)
Black* 0.09 0.28 Guardian’s age missing* 0.03 0.17
Hispanic* 0.12 0.32 (Born after 1955 omitted) Suburban school 0.40 0.49
Other/non-white* 0.08 0.28 Rural school 0.31 0.46
(White omitted) Parents education* 14.20 2.48 (Urban omitted)
Parents education missing* 0.01 0.08
Baptist* 0.07 0.25 Prop Black in school 0.10 0.18
No religion* 0.09 0.29 Family socioeconomic status*−0.06 0.77 Prop Hispanic in school 0.09 0.19
Other/non-Catholic* 0.54 0.50 Racial composition missing 0.04 0.19
Religion missing* 0.02 0.14 Live with mom and dad 0.69 0.46
(Catholic omitted) Live with mom only 0.15 0.35 Prop on free lunch 0.19 0.21
Family composition missing 0.07 0.26 Free lunch info missing 0.06 0.23 Number of older siblings* 1.50 1.90 (Other composition omitted)
Older siblings missing* 0.11 0.32 Prop with single parent 0.22 0.16
Income <10K 0.09 0.29 Single parent info missing 0.10 0.30 Sibling drop out* 0.10 0.31 Income 10K–25K 0.24 0.43
Sibling drop out missing* 0.03 0.18 Income 25K–50K 0.40 0.49 Percent who drop out 4.78 7.79 Income missing 0.11 0.31 Drop out info missing 0.08 0.27
Previous smoker 0.10 0.30 (Income > 50K omitted) Previous intensity 0.20 0.14
6–10 cigs
Gilleskie and Strumpf
831
Prices (inflation adjusted) Age as of January 186.55 34.14
(months)
Age missing 0.02 0.14 Cigarette price (cents/pack) 141.47 20.05 Cigarette tax (per pack) 21.51 9.08 Standardized test score 52.1 9.79
Test score missing 0.08 0.29 Dropout indicator 0.05 0.22
potential dynamics of smoking behavior, they relax the additive separability assump-tion common in demand analyses. In their raassump-tional addiassump-tion model they suggest that current period utility of smoking alternatives is influenced by previous smoking behavior, implying that the first-order demand equation contains the lagged smoking decision. Individuals are also forward-looking and consider the influence of today’s smoking choice on future smoking behavior. Hence, the current period demand equa-tion, derived from maximization of discounted lifetime utility subject to per-period budget constraints, contains expected future smoking consumption. Let Ctrepresent smoking consumption in period t. Then (presuming a quadratic utility function), the linear demand equation for individual iat time tis
(1) Cit= α0+ α1Pit+ α2Cit−1+ α3C*it+1+ α4Pit−1+ α5P*it+1+ α6Xit+ εit
where Ptis the period tprice of cigarettes, Xtdenotes contemporaneous exogenous characteristics, the α-terms are nonlinear combinations of underlying structural pref-erence parameters, and “*” indicates an expected future value.
The empirical formulation above suggests that lags and leads of consumption influ-ence current behavior. Observations on the same individual over time would allow estimation of the impact of past smoking decisions on current smoking behavior. Because longitudinal data are often unavailable, in the empirical literature lagged and lead prices serve as proxies for lagged and lead behavior in Equation 1.13In this con-text, a statistically significant effect of lagged prices on current consumption is often taken as evidence of state dependence.14Alternatively, we investigate the dependence of current smoking decisions on endogenous past smoking behavior by using obser-vations on the same individuals over time and allowing for correlation through per-manent individual unobservables.
While future consumption influences the value of current smoking alternatives in Equation 1, it is the optimal expectedvalue based on currently available information rather than the actual expostvalue that matters. Optimal future consumption depends on the distribution of future unobserved preferences. Similarly, while expectations of future cigarette prices are important to today’s smoking decision, future prices are not known with perfect foresight, (especially in our biannual data). Rather, they are fore-casted as a function of current information. Gilleskie and Strumpf (2000) incorporate these concerns about expectations and provide an approximation to the individual’s dynamic optimal demand to which we now turn. While the empirical specification is based on forward-looking decision making, it resembles a myopic model since the expectations process is not estimated.
Our specification of current period cigarette consumption is
(2) Cit= γ0+ γ1Pst+ γ2Cit−1+γ3Cit−1Pst+γ4Xit+ σs+ σt+ εit The Journal of Human Resources
832
13. See DeCicca et al. (1997) and Labeaga and Jones (2003) for exceptions. Retrospective data provides a different route for analysis, as in Chaloupka (1991), but also presents different issues of data reliability (Kenkel et al. 2003).
where we include an interaction of previous smoking status with current prices (in individual i’s state of residence s) to allow for different price elasticities among for-mer smokers and nonsmokers, and we exclude future consumption and future prices. The specification also allows for state and time fixed-effects (σsand σt, respectively). We further decompose the error term εitinto two components to reflect permanent individual unobservables and serially uncorrelated errors. That is,
(3) εit= ρµ +uit
where µ (an unobserved factor) is the permanent unobservable individual hetero-geneity and ρ(the factor loading) measures its effect. Analogously, one could con-sider an individual fixed effect, σi= ρµwhere σivaries by individual. Instead, as discussed in more detail below, we consider µto be a random effect estimated by a discrete distribution of mass points. The error uitis an idiosyncratic, i.i.d. component. The model is dynamic because of the testable assumption that smoking behavior and price sensitivity today depend on the smoking state occupied in the previous period. To recap, the model has two important implications that are the focus of our empiri-cal work: previous smoking history influences current smoking decisions and ciga-rette price sensitivity may be different for individuals with different histories of smoking.
One additional adaptation is needed given the smoking outcome available in our data. Our data contain a polychotomous outcome categorizing individuals as nonsmokers, light smokers, moderate smokers, or heavy smokers in each period. For reasons we dis-cuss below, current smoking behavior is modeled in two parts: (i) no smoking versus smoking, and (ii) the quantity of cigarettes smoked conditional on smoking. Undoubtedly there is a correlation between the error terms, which reflect unobserved individual differences, associated with these smoking behaviors. For example, individu-als who heavily discount the future may be more likely to smoke and, conditional on smoking, to smoke more. We allow such permanent individual heterogeneity (µ) to influence both equations. Assuming that the idiosyncratic components of the error terms (ut) are independently Extreme Value distributed, the smoking and conditional smoking intensity probabilities (logit and multinomial logit, respectively) are:
( ) ( )
where j = 1, . . . , J indicates increasing levels of smoking intensity. This two-equation specification is preferred over a single ordered logit model because it allows for different sensitivities to prices (and other variables) by smoking outcome. More formally, we can reject the ordered logit assumption of common coefficients across
outcomes using a likelihood ratio test. A discussion of alternative model specifica-tions is presented in Subsection IVA.15
The dynamic equations of our empirical model are estimated jointly and are linked by dependence on the common individual unobservables (µ). We follow Heckman and Singer (1984) and Mroz (1999) and treat the unobservables as random effects that are integrated out of the model. That is, we assume a discrete distribution of µand estimate the points of support of the distribution (µ1, . . . , µMwhere µm∈[0,1]), the probability weights on each point of support (θ1, . . . , θMwhere m=1im=1
M
! ), and the
factor loadings in each equation (ρ1, ρ21, . . . , ρ2J), with the appropriate normaliza-tions. This procedure addresses the joint endogeneity of outcomes arising from common unobserved factors, but imposes no distributional assumption such as joint normality on the unobserved factors. Mroz shows there are strong econometric advan-tages to using this approach rather than parametric random effects techniques. Also, estimation of the random effects as described above improves efficiency over a model of individual fixed effects that would introduce thousands of additional parameters to be estimated. Moreover, individual fixed effects models yield biased parameter esti-mates unless there are several observations per individual unit (Hsiao 1986; Nickell 1981). The system of equations is estimated using full information maximum likeli-hood techniques.
Several features of our model and data provide statistical identification in our jointly estimated system of smoking equations, both participation and conditional intensity. Because the system allows for dependence on previous smoking behavior and is esti-mated using a panel of individual observations, lags of the endogenous variables enter as explanatory variables. This feature provides a major source of identification. Since we are modeling (estimating) this endogenous previous behavior, previous exogenous covariates such as cigarette prices serve as implicit instrumental variables for the lagged endogenous variables. In fact, all exogenous variables from the previous peri-ods help identify the system since they directly influence past, but not current, behav-ior. The key is to have sufficient sources of variation in each period. While we use several exogenous time-varying variables, prices alone achieve identification. Put dif-ferently, the behavior of two identical individuals (in terms of both their time-invariant and time-varying individual characteristics) who live in different states is identified by the entire observed historyof cigarette prices/taxes within each state.16
The behaviors are further identified from the rich set of covariates, many of which vary over time. We exclude specific individual and school variables in particular equa-tions to more precisely estimate the separate behaviors. Notice that these are overi-dentifying restrictions, since the earlier dynamic argument is sufficient for identification. In the conditional smoking intensity equation, age within the cohort and population density around the school is omitted. Using likelihood ratio tests to com-pare the empirical specification of our model to ones that include these variables, we The Journal of Human Resources
834
15. We also explore the endogeneity of an important and self-selected group: individuals who drop out of school. We include an equation explaining the probability of leaving school between observed waves in the data and estimate it jointly with the smoking decisions that include the endogenous dropout status as an explanatory variable. Details on our approach can be found in Gilleskie and Strumpf (2000).
cannot reject the null hypotheses that the coefficients on the variables are zero. Cigarette availability is the basis of our argument for excluding these variables. That is, older teens within a cohort are more likely to have access to cigarettes through ille-gal purchases; they are less likely to be prohibited from buying because they look older. But, conditional on purchase, age is unlikely to influence the number of cigarettes smoked. Similarly, population density is likely related to the number of nearby stores selling cigarettes and hence to cigarette access, but should have little effect on smok-ing intensity. The parameter estimates below are consistent with these interpretations.
IV. Estimation Results
A. Comparative Results
Before discussing the results from our preferred model that explicitly captures the dynamic influences of one’s smoking history, we discuss estimates obtained from typ-ical specifications found in the literature. We then make several additions to the sim-ple model, some of which have been included in the relevant literature, which help motivate our full model. In each case we estimate a logit model of smoking partici-pation and a multinomial logit model of conditional smoking intensity. We use the estimates from each specification to generate behavioral responses to price changes. In the interest of brevity we omit the parameter estimates and summarize the result-ing behavioral changes in Table 3 when cigarette prices are increased by $0.25 in all years of the sample.17We follow the literature and present price elasticities and indi-cate their statistical significance based on bootstrapped standard errors.
The top left panel of Table 3 displays results from a typical model estimated in the literature that includes few covariates, no observations on dropouts, and no state fixed effects (which we refer to as Model 1). The first column shows there are large reduc-tions in smoking participation following the price increase with an overall price elas-ticity of −0.87. The remaining three columns of the panel show that, conditional on smoking, the price increase noticeably increases light smoking and reduces moderate and heavy smoking intensities. Also, the participation price elasticity falls over time. The reduced price sensitivity of NELS youth as they grow older could stem from behavioral differences related to the aging process, some national trend in smoking behavior, or differences in the composition of smokers.
We take advantage of the details in NELS and add to Model 1 additional individ-ual, parental, and school characteristics and include dropouts in the sample (Model 2). At this point, however, we do not include variables measuring one’s smoking history. These additions slightly reduce the participation response (the elasticity is −0.78) and increase the shift to light consumption among smokers. These results indicate that using a richer set of observable exogenous variables provides better estimates of the price effect by purging it of some omitted variable bias. This issue is a particularly important problem for the older literature that was often based on sparse sets of covariates, aggregated individual observations, or retrospective data that may not include time-varying information on exogenous characteristics.
Gilleskie and Strumpf 835
The Journal of Human Resources
836
Table 3
Measures of Price Elasticity from Preliminary Models
Conditional on Smoking
Price vs. Smoke Smoke Smoke Smoke
Price +$0.25 Description any 1–5 cigarettes 6–10 cigarettes 11+ cigarettes
Model 1 Sparse set of covariates & dropouts not included
Overall −0.87** 0.43** −1.05** −0.26
By year
1988 −1.21** 0.70** −2.10** −0.65
1990 −0.94** 0.36* −0.89 −0.48
1992 −0.44** 0.42* −0.92** 0.00
Model 2 Model 1 with more covariates & dropouts
Overall −0.78** 0.72** −0.91** −0.21
By year
1988 −1.02** 0.64* −1.95** −0.28
1990 −0.86** 0.61** −0.96* −0.30
Gilleskie and Strumpf
837
Model 3 Model 2 with state fixed effects
Overall −0.04 1.12* −0.95 −0.92
By year
1988 −0.61 0.68 −1.73* −0.66
1990 0.02 0.91 −1.03 −1.05
1992 0.47 1.37 −0.73 −0.89
Model 4 Model 3 with previous behavior & interaction with price
Overall −0.02 1.02 −0.95 −1.21
By year
1988 −0.69 0.79 −1.74* −1.12
1990 −0.02 1.02* −1.09 −1.42
1992 0.65 1.07 −0.70 −1.08
Previous nonsmokers −0.05 0.78* −1.28 −1.23
Previous smokers 0.41** 1.46 −0.37 −1.19
Note: Bootstrapped standard errors (N= 1,000 replications) are calculated.
Adding state fixed effects to the specification dramatically changes the results (Model 3). Prices now have a much smaller and statistically insignificant influence on smoking participation (the elasticity is −0.04) while there is a larger but generally insignificant response on conditional smoking behavior. This suggests that there are state-specific factors that influence both individual smoking behavior and cigarette price variation. This is consistent, for example, with an antismoking sentiment that boosts prices by increasing state cigarette taxes and independently reduces smoking rates. Failure to model such state-specific differences incorrectly attributes the nega-tive effect of antismoking sentiment to prices. The more neganega-tive price elasticity in Model 2 relative to Model 3 is evidence of a spurious negative correlation between prices and smoking propensity.
Finally, we investigate the role of previous smoking behavior by including exogenous indicators of previous use and previous intensity (Model 4).18While the overall behav-ioral change remains roughly the same as Model 3, Model 4 allows us to explore how previous smoking status influences price sensitivity. This model suggests that a price increase has a slightly negative, but statistically insignificant, influence on previous non-smokers’ participation, but significantly increasesprevious smokers’ participation. It must be emphasized, however, that these price sensitivities may be biased since the endogeneity of previous use is not modeled. The estimates could reflect an overestimate of smoking persistence, since there is no control for permanent unobserved heterogene-ity. For example, the price sensitivity of previous nonsmokers will be underestimated if the empirical model overstates their likelihood of continuing to abstain.
Our preliminary results are roughly consistent with previous studies of teen smok-ing behavior.19DeCicca et al. (2002), who also use NELS data, find that prices and taxes have a statistically insignificant and sometimes positive effect on smoking initi-ation during high school. They also find that the price elasticity of smoking partici-pation becomes less negative as the cohort ages. In contrast, Gruber (2001) finds prices have a statistically significant negative effect on smoking participation and that this effect is more marked for older teens. (Gilleskie and Strumpf 2000 help reconcile these differences.)
We examined the sensitivity of our results to a variety of changes in specification and data construction (and these results are available upon request). First, we used state taxes in place of cigarette prices to control for the simultaneity of prices and aggregate demand for cigarettes. The simulated behavioral changes are virtually identical for smoking participation and conditional smoking intensity, though there is a slightly greater reduction in heavy smoking under taxes than prices. Second, we checked whether the results are sensitive to the exact timing of prices and taxes since NELS individuals are surveyed on different dates. We considered several monthly The Journal of Human Resources
838
18. In order to investigate price sensitivity variation over time we include interactions of price with previ-ous use and year indicators. In unreported specifications, we interact price with the continuprevi-ous age variable and found similar price sensitivities suggesting that elasticities differ by year but not by age within a partic-ular year or grade.
19. Overall, the Model 4 estimates give a price elasticity of total consumption of −0.51. The predicted total number of cigarettes consumed for any set of prices is [p(smoke)Σip(i⎪smoke) ×(number of cigarettes in
dates for taxes (which are available on a day-by-day basis) and several interpolated monthly dates and averages for prices (which are surveyed once a year). Shifting these dates did not alter the results significantly. Third, we estimated the smoking participation and intensity equations separately by year and by previous smoking sta-tus. The price sensitivities were similar, and thus we report results from the model with fewer estimated parameters. Fourth, we investigated whether price has a non-linear effect on smoking decisions. It is not possible to reject a null hypothesis that price squared, and its interactions with previous behavior indicators, should be excluded.
Before proceeding with our preferred method of modeling the endogeneity of pre-vious smoking behavior, we explored the importance of this endogeneity. A standard approach is to instrument for the endogenous regressor and to perform a Hausman test. We focus on the smoking participation logits of Model 4 and use a two-stage pro-cedure to form predicted previous smoking behavior.20 Using the specification in Model 4 with a fitted value for previous smoking participation, the null of smoking exogeneity can be rejected at the 99 percent confidence level. These results suggest that smoking endogeneity is important; after instrumenting, previous behavior plays a smaller role in smoking decisions. This approach, however, results in a serious effi-ciency loss: standard errors on the smoking history covariates increase by a factor of five. Intuitively, the two-stage approach ignores the substantial variation in previous smoking behavior that is not captured by the instruments. Similarly, we re-estimated Model 4 with individual fixed effects. While the estimates are comparable, the stan-dard errors increase by a factor of two.
Because the standard approaches give imprecise estimates, we now turn to results from our preferred empirical approach that allows for state dependence and for-mally models the unobserved heterogeneity that influences smoking decisions over time.
B. Results from the Preferred Model
Having motivated the importance of including both observed and unobserved indi-vidual heterogeneity, allowing for unobserved state differences, and modeling previ-ous behavior, we now examine results from a model that incorporates all of these concerns (Model 5). We begin by discussing the effect of previous behavior on smok-ing decisions when permanent individual unobserved heterogeneity is modeled. Because subgroups have different price sensitivities, we continue to interact price with the smoking history variables and year indicators. We then discuss differences in the immediate and long-run effects of previous smoking behavior using this preferred model.
If the smoking history variables reflect part of the permanent unobservable differ-ences among youth, then the estimated coefficients on these behavioral variables and their price interactions are biased in Model 4 where previous behavior is assumed to be exogenous. Model 5 controls for these unobserved differences, and the parameter
Gilleskie and Strumpf 839
estimates for all variables are listed in Table 4.21There are two main differences rel-ative to the preliminary models. First, the effect of previous behavior on current smok-ing decisions is mitigated. For example, Model 4 suggests a 38 percentage point (4.75 times) increase in the predicted probability of smoking if an individual smoked 6-10 cigarettes in the previous period relative to not smoking, while Model 5 has only an eight percentage point (0.87 times) increase. These substantial differences can be attributed to upwardly biased estimates in Model 4. While unobserved differences may drive certain individuals to smoke or not smoke in every period, Model 4 incor-rectly incorporates this effect into the coefficient on previous behavior. When this endogeneity of previous smoking behavior is modeled, smoking history has a smaller, but still statistically significant, effect on current behavior. Hence, previous behavior matters and persistence cannot be fully explained by unobserved heterogeneity.
The second major change under endogenous previous behavior is an increase in the estimated price sensitivity. The top panel of Table 5 indicates a statistically sig-nificant participation price elasticity of −0.41 compared to essentially no sensitivity measured in Model 4. Elasticities by year also become more negative (the price elas-ticity in 1992 is not statistically different from zero).22 The conditional smoking intensity price elasticities also change, with noticeably more negative values for moderate and heavy smoking relative to the model with no heterogeneity. Modeling the heterogeneity allows us to control for intense unobserved tastes and therefore better measure price sensitivity. That is, some individuals will smoke or not smoke regardless of the price. Model 4 does not control for such heterogeneity, and so it estimates that all individuals are relatively price insensitive. This difference is par-ticularly noticeable in the participation price elasticity of previous nonsmokers, which is −0.47 (and statistically significant) in Model 5 and only −0.05 (and statisti-cally insignificant) in Model 4.
We can now predict the behavior of individuals over time. Two routes are possible: we can use the observed history of individuals each period to simulate behavior or we can update behavior each period using simulated outcomes from the predictions. The former provides an estimate of the immediateresponse to price changes (as in Table 3 and the top panel of Table 5), since previous behavior is not updated to reflect changes in smoking decisions under the new prices. The latter provides the long-termresponse and appropriately accounts for changes in past behavior resulting from price changes over time. This calculation requires simulating behavior of the sample in 1988 and updating their smoking histories using the simulated behavior. Subsequently, behavior The Journal of Human Resources
840
21. Results are reported from a model with two factors (µ) representing unobserved heterogeneity and three points of support on each factor; four points of supports on either factor did not provide significant improve-ment in the likelihood function. Because the estimated factor loadings (ρ) are negative, individuals with unobserved characteristics at the right of each distribution are less likely to smoke. The estimated points of support are (0.00, 0.38, and 1.00) with estimated weights of (0.11, 0.51, and 0.36) for one factor (factor a) and (0.00, 0.06, and 1.00) with estimated weights of (0.42, 0.47, and 0.11) for the second factor (factor b). Note that the asymmetric distribution exhibited by the second factor and the large negative factor loadings on this factor (displayed in Table 4) help explain why some individuals never smoke.
Gilleskie and Strumpf
841
Table 4
Parameter Estimates from Model 5
Smoke Any Smoke 6–10 Cigarettes Smoke 11+ Cigarettes
Cigarette pricet −0.008 (0.007) −0.031 (0.015)** −0.029 (0.017)*
Cigarette pricet×year 1990 0.005 (0.005) 0.009 (0.012) 0.000 (0.014)
Cigarette pricet×year 1992 0.010 (0.005)* 0.014 (0.012) 0.009 (0.013)
Cigarette pricet×previous smoker 0.005 (0.004) −0.005 (0.006) −0.011 (0.007) Cigarette pricet×previous use 6–10 cigarette 0.020 (0.010)** 0.024 (0.011)** 0.023 (0.012)* Cigarette pricet×previous use 11+ cigarette 0.014 (0.011) 0.014 (0.015) 0.021 (0.014)
Cigarette pricet×dropout −0.009 (0.006) −0.016 (0.009)* −0.031 (0.009)**
Cigarette pricet×female −0.001 (0.002) 0.004 (0.005) 0.009 (0.005)
Previous smoker 0.671 (0.701) 1.478 (0.929) 2.224 (1.081)**
Previous intensity 6–10 cigarettes −2.304 (1.490) −2.519 (1.663) −1.894 (1.802) Previous intensity 11+ cigarettes −1.670 (1.626) −1.792 (2.253) −1.415 (2.146)
Dropout indicator 0.871 (0.988) 3.072 (1.424)** 5.273 (1.468)**
Female 0.182 (0.354) −0.916 (0.701) −1.959 (0.809)**
Black −2.000 (0.148)** −1.758 (0.314)** −1.880 (0.360)**
Hispanic −0.498 (0.112)** −1.430 (0.206)** −1.481 (0.238)**
Other/nonwhite −0.735 (0.118)** −0.277 (0.214) −0.657 (0.263)**
Standardized test score 0.019 (0.030) −0.078 (0.053) −0.018 (0.058)
The Journal of Human Resources
842
Table 4 (continued)
Smoke Any Smoke 6–10 Cigarettes Smoke 11+ Cigarettes
Test score squared −0.001 (0.000)** 0.000 (0.001) 0.000 (0.001)
Test score missing −0.670 (0.760) −2.164 (1.288)* −0.576 (1.408)
Baptist −0.060 (0.126) −0.190 (0.204) −0.054 (0.242)
No religion 0.479 (0.111)** 0.323 (0.163)** 0.643 (0.191)**
Other/non-Catholic 0.067 (0.070) 0.071 (0.117) 0.410 (0.137)**
Religion missing −0.089 (0.212) 0.546 (0.338) 0.902 (0.376)**
Number of older siblings 0.032 (0.019)* 0.020 (0.029) 0.030 (0.033)
Older siblings missing 0.282 (0.095)** 0.028 (0.148) 0.169 (0.165)
Sibling drop out 0.526 (0.105)** 0.354 (0.147)** 0.061 (0.177)
Sibling drop out missing 1.538 (0.182)** 0.948 (0.244)** 0.652 (0.278)**
Live with mom and dad −0.413 (0.074)** −0.397 (0.120)** −0.359 (0.136)**
Live with mom only −0.091 (0.093) −0.174 (0.150) −0.264 (0.172)
Family composition missing −0.337 (0.102)** −0.088 (0.166) 0.042 (0.182)
Family socioeconomic status 0.142 (0.075)* −0.218 (0.117)* 0.002 (0.133)
Parents education −0.029 (0.022) −0.004 (0.035) −0.091 (0.039)**
Parents education missing −0.594 (0.475) −0.379 (0.778) −1.694 (0.927)*
Parent’s work −0.361 (0.173)** −0.339 (0.243) −0.309 (0.280)
Parent’s work missing −0.494 (0.393) 0.195 (0.553) −0.315 (0.712)
Guardian born before 1940 −0.247 (0.143)* 0.393 (0.218)* 0.125 (0.255)
Guardian born 1940–55 −0.213 (0.106)** 0.187 (0.160) 0.166 (0.182)
Gilleskie and Strumpf
843
Public school −0.150 (0.097) 0.126 (0.163) 0.000 (0.183)
Prop on free lunch 0.034 (0.179) 0.199 (0.315) −0.223 (0.383)
Free lunch info missing −0.068 (0.128) 0.167 (0.247) 0.317 (0.273)
Prop Hispanic in school −0.475 (0.227)** 0.055 (0.441) −0.898 (0.612)
Prop Black in school −0.222 (0.231) −0.652 (0.456) 0.054 (0.519)
Racial composition missing −0.078 (0.161) 0.194 (0.296) 0.278 (0.341)
Prop with single parent 0.102 (0.200) 0.219 (0.381) −0.025 (0.441)
Single parent info missing −0.030 (0.098) 0.118 (0.185) −0.183 (0.223)
Percent who drop out −0.013 (0.004)** 0.014 (0.008)* 0.006 (0.011)
Drop out info missing 0.033 (0.141) 0.092 (0.266) −0.141 (0.323)
Age as of January (months) 0.009 (0.004)** — (–) — (–)
Age missing 1.581 (0.792)** — (–) — (–)
Suburban school −0.023 (0.081) — (–) — (–)
Rural school −0.245 (0.092)** — (–) — (–)
Year 1990 0.980 (0.710) −0.577 (1.487) 0.287 (1.729)
Year 1992 0.347 (0.753) −0.658 (1.517) −0.206 (1.745)
Constant −0.003 (1.402) 5.675 (2.443)** 5.195 (2.718)*
ρa(unobserved het. factor a) −1.164 (0.430)** −1.141 (0.424)** −2.695 (0.651)**
ρb(unobserved het. factor b) −51.431 (655.8) −28.068 (358.1) −21.773 (278.0)
The Journal of Human Resources
844
Table 5
Measures of Price Elasticity from Model 5—Preferred model
Conditional on Smoking
Price vs. Smoke Smoke Smoke Smoke
Price +$0.25 any 1–5 cigarettes 6–10 cigarettes 11+ cigarettes
Calculations using observed previous behavior →immediate response
Overall −0.41* 0.89 −1.42** −1.84**
By year
1988 −0.92** 0.55 −2.14** −1.74**
1990 −0.40 0.82 −1.58* −2.06**
1992 0.10 1.02 −1.17 −1.70**
Previous nonsmokers −0.47* 0.62 −1.76** −1.88**
Previous smokers 0.42 1.38 −0.83 −1.77**
Calculations using updated behavior from dynamic simulations →long-run response
Overall −0.46* 0.87 −1.56* −1.96**
By year
1988 −0.92** 0.55 −2.14** −1.74**
1990 −0.44 0.76 −1.66* −2.12**
1992 −0.02 1.01 −1.37 −1.88*
Previous nonsmokers −0.48* 0.70 −1.68** −1.96**
Previous smokers −0.16 1.17 −1.34 −1.95**
Note: Our preferred model includes individual unobserved heterogeneity, endogenous controls for smoking history, and state fixed effects. Bootstrapped standard errors are calculated.
in 1990 is simulated using simulated 1988 behavior and histories are updated. Finally, we simulate behavior for 1992 using the updated histories.23This updating procedure leads to different predictions because previous behavior influences current decisions as well as current price sensitivity. These changes now reflect long-run responses as opposed to immediateresponses to price changes.
The bottom panel of Table 5 describes the changes in behavior and elasticities when we use the updating procedure. Relative to not updating (top panel of Table 5), the participation elasticity is slightly more negative (−0.46 versus −0.41) as is this price elasticity in 1990 and 1992.24The greatest changes are among previous smokers who now have a much smaller and negative, but still insignificant, price sensitivity (−0.16 versus 0.42). This difference has an intuitive explanation. The updating calculation allows endogenous previous smoking behavior to reflect past price changes, while the earlier simulation simply used the observed previous smoking history. A price increase in the initial periods, when price sensitivity is higher, is particularly effective at deterring smoking. Some individuals who first took up smoking at this time will no longer do so. This in turn makes them less likely to smoke in later periods. Thus, the effect of the updating calculation is reflected most notably in the behavior of previous smokers, individuals who smoked in earlier periods in the data. Previous nonsmokers continue not to smoke under higher prices. We also observe larger negative price sen-sitivities in the conditional level of smoking. In particular, using the updating proce-dure we observe more movement away from heavy and moderate smoking levels when prices increase. Overall, the total price elasticity in our preferred model is −1.11 compared to −0.51 in Model 4 (see Footnote 19).
Despite the role of unobserved heterogeneity in explaining smoking patterns, these simulations demonstrate that price changes can modify behavior and influence subse-quent smoking decisions of youth. Prices have a dynamic effect as they prevent smok-ing today which in turn makes teens more price sensitive and less likely to smoke in future periods. We suspect that long-run price sensitivities will be even larger when horizons of longer than four years are considered.
C. Policy Simulations
It is important to see whether our refined estimates imply economically meaningful effects, both in terms of responses to policy changes as well as the role of state dependence. We show the importance of modeling unobserved individual hetero-geneity and accounting for the behavior modification associated with previous price changes by simulating the smoking participation predictions of Models 3, 4, and 5. Although we do not estimate the policy-invariant parameters of the individual’s opti-mization problem, the policies that we simulate exist within the available data. That is, we simulate price increases that fall within the price variation in the data and we simulate forced previous behavior where all smoking choices are observed in the data. Table 6 displays the proportion of individuals who are predicted to smoke at the unchanged original prices in the data and under various permanent price increases.
Gilleskie and Strumpf 845
23. Additional details on the updating procedure are available from the authors.
The Journal of Human Resources
846
Table 6
Smoking Participation Predictions under Alternative Permanent Price Increases
Smoking Participation Rates Smoking Participation Rates
Price Model 3 Model 4 Model 5 Price Model 3 Model 4 Model 5
Overall Year 1988 (8th graders)
Original price 14.42 14.42 14.40 Original price 4.60 4.60 4.56
Price +1 cent 14.35 14.44 14.38 Price +1 cent 4.58 4.58 4.53
Price +25 cents 14.73 14.85 13.73 Price +25 cents 4.05 3.98 3.78
Price +100 cents 15.92 16.14 11.93 Price +100 cents 2.74 2.55 2.10
Previous nonsmokers Year 1990 (10th graders & dropouts)
Original price 13.24 9.96 13.40 Original price 15.98 15.98 15.86
Price +1 cent 13.25 9.97 13.37 Price +1 cent 15.98 15.98 15.81
Price +25 cents 13.48 10.08 12.74 Price +25 cents 16.01 16.04 14.74
Price +100 cents 14.45 10.81 10.97 Price +100 cents 16.14 16.11 11.59
Previous smokers Year 1992 (12th graders & dropouts)
Original price 30.47 74.98 28.04 Original price 22.69 22.69 22.79
Price +1 cent 30.52 75.18 28.01 Price +1 cent 22.75 22.77 22.78
Price +25 cents 31.75 79.54 27.31 Price +25 cents 24.14 24.52 22.68
Price +100 cents 35.83 88.55 24.94 Price +100 cents 28.86 29.76 22.09
Note: Model 3 includes state fixed effects and no controls for previous behavior. Model 4 is identical to Model 3 but includes (exogenous) controls for previous behavior.
The overall smoking participation rates are larger in Models 3 and 4 than in Model 5 for each price change simulation. Table 6 also demonstrates the degree of prediction inaccuracy of population subgroups when previous behavior is not modeled. There are marked differences across the three models for previous smokers and nonsmok-ers. Model 3 simply relies on observed covariates other than previous behavior to explain differences between these groups. Model 4, on the other hand, overstates pre-vious smokers’ smoking propensities since the coefficient on prepre-vious behavior (assumed exogenous in this model) is strongly correlated with unobserved hetero-geneity and is therefore biased. Separated by year, we see that the probability of smoking is overestimated in Models 3 and 4 by as much as seven percentage points following a $1/pack increase.25
We next illustrate the magnitude and importance of state dependence in cigarette sumption. Consider the effect of a one-time cigarette tax (or price) increase. This is a con-venient, if unlikely, policy to consider since any change in smoking behavior in future years is the result of modified behavior in the year of the tax increase.26Using our pre-ferred specification, we simulated a $1 increase in real prices in 1988, with prices held at their original 1990 and 1992 real levels. Relative to behavior at original prices, there is a 2.46 percentage point drop in smoking participation rates in 1988. This in turn results in a 0.67 percentage point (four percent of base) decrease in smoking rates in 1990 and a 0.25 percentage point (one percent of base) decrease in 1992. The decrease in future par-ticipation rates is observed among both nonsmokers and smokers. Subsequent movement away from moderate and heavy levels of smoking among smokers also continues after the one-time 1988 tax increase. Despite low smoking rates among eighth graders (and hence, few individuals for whom the simulated price increase will alter smoking behav-ior), the participation changes are large relative to their baseline levels. These results con-firm that price changes have important dynamic implications.
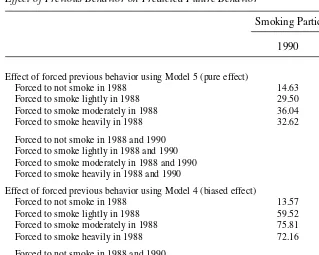
Table 7 shows our final experiment that measures the pure effect of previous behav-ior (state dependence) on smoking decisions. As we have argued above, the parame-ters on the smoking history variables in Model 5 more precisely measure the influence of past smoking behavior because there are controls for observed and unobserved het-erogeneity that influence the smoking decisions over time. The estimates from Model 4 can only provide the combined effect of both past behavior and unobserved prefer-ences. To measure these effects, we perform identical simulations and use the updat-ing procedure to generate smokupdat-ing histories for both Models 4 and 5. The simulations force particular types of smoking behavior in order to demonstrate the role of state dependence. We first force all individuals in the sample to be nonsmokers in 1988. We then update their history and simulate behavior in 1990 and 1992. Similarly, we allow no one to smoke in 1988 and 1990 and predict behavior in 1992. These experiments are akin to a perfectly enforcedminimum age purchase restriction (that is, age 16 and
Gilleskie and Strumpf 847
The Journal of Human Resources 848
age 18 respectively). Compared to observed participation, the top panel of Table 7 shows that this enforcement could reduce smoking rates in 1992 by five percentage points (17.76 compared to an observed rate of 22.69).
This procedure is repeated forcing all individuals to be either light, moderate, or heavy smokers in 1988 and simulating their behavior in 1990 and 1992. From Model 5, Table 7 shows the pure effect of smoking lightly in 1988 as opposed to not smok-ing in 1988 is to increase participation rates by almost 15 percentage points (29.50–14.63) in 1990 and by 4.6 percentage points in 1992 (26.94 –22.34). That is, individuals who smoke in 1988 are two times more likely to smoke in 1990 and 20 percent more likely to smoke in 1992. The smaller difference in 1992 than 1990 reflects the fact that some individuals, who were forced to smoke in 1988 and who otherwise would not have, will choose not to smoke in 1990 decreasing their proba-bility of smoking in 1992. The second simulation shows that light smoking in 1988
and1990 increases the probability of smoking participation in 1992 by 17.5 percent-age points. The table also reports the simulated participation behavior when individ-uals are forced to be moderate or heavy smokers in the early periods.27
27. We simulate smaller probabilities of future smoking among those forced to smoke heavily than those forced to be moderate smokers. Interestingly, we see the same behavior in the observed data displayed in Table 1, and this is also reflected in the estimated coefficients on lagged behavior in Table 4.
Table 7
Effect of Previous Behavior on Predicted Future Behavior
Smoking Participation (%)
1990 1992
Effect of forced previous behavior using Model 5 (pure effect)
Forced to not smoke in 1988 14.63 22.34 Forced to smoke lightly in 1988 29.50 26.94 Forced to smoke moderately in 1988 36.04 30.61 Forced to smoke heavily in 1988 32.62 28.71 Forced to not smoke in 1988 and 1990 17.76 Forced to smoke lightly in 1988 and 1990 35.26 Forced to smoke moderately in 1988 and 1990 48.13 Forced to smoke heavily in 1988 and 1990 42.62 Effect of forced previous behavior using Model 4 (biased effect)
We report the same simulations using Model 4 to illustrate the biased estimated effect of previous behavior. When true state dependence is combined with unob-served heterogeneity, the simulated participation rates are larger and incorrect. The bottom panel of Table 7 shows that individuals who smoked lightly in 1988 as opposed to not smoking in 1988 are 4.4 times more likely to smoke in 1990 and 2.2 times more likely to smoke in 1992. Smoking lightly in 1988 and 1990 makes one 4.6 times more likely to smoke in 1992. The results from both models provide clear evidence that smoking behavior persists. More importantly, when we purge the esti-mated effects of unobserved heterogeneity, there is still a sizable effect of previous behavior. The Model 5 estimates allow us to measure the impact of previous smok-ing behavior exclusive of permanent unobserved tastes.
V. Conclusion
This paper highlights the importance of explicitly taking into consid-eration endogenous smoking history and unobserved individual heterogeneity when explaining smoking behavior, measuring price sensitivity, or predicting future smok-ing responses to price changes. By controllsmok-ing for a wide range of observed and unob-served individual differences, we are able to show that behavior modification plays an important role in smoking persistence. Such state dependence, however, is overstated when the endogeneity of previous behavior is not considered. The paper also demon-strates that price increases can influence future behavior by reducing the current num-ber of smokers; such increases produce a population with a larger proportion of more price sensitive nonsmokers. We show that ignoring smoking dynamics can give mis-leading estimates of the aggregate effect of various cigarette price increases. This bias is likely to be more severe over longer time horizons than the four years considered here if price increases continue to expand the number of nonsmokers.
This dynamic framework can address questions of interest to policymakers. For example, the model can forecast the immediate response of youth smoking to ciga-rette tax increases as well as predict how youth will be affected in the long run. We also show how tax changes can influence current smokers and nonsmokers differently. The procedures we use can be extended to longer panels or an older population to obtain better estimates of long-run effects of tax increases and to determine the impor-tance of dynamics among adults (that is, are adult smokers less price sensitive than adult nonsmokers?). With a more complete understanding of lifetime smoking dynamics, we will be able to forecast how overall population smoking rates will vary in the short and long run in response to various price changes. Investigating these extensions will help inform the current debate regarding the impact of future cigarette taxes and other smoking policies.
The Journal of Human Resources
850
Table A1
Parameter Estimates from Model 1
Smoke Any Smoke 6–10 Cigarettes Smoke 11+ Cigarettes
Cigarette pricet −0.012 (0.005)** −0.028 (0.011) −0.011 (0.011)
Cigarette pricet×year 1990 0.003 (0.005) 0.018 (0.012) 0.005 (0.012)
Cigarette pricet×year 1992 0.008 (0.005)* 0.019 (0.012) 0.008 (0.012)
Cigarette pricet×previous smoker — (−) — (−) — (−)
Cigarette pricet×previous use 6-10 cigarettes — (−) — (−) — (−)
Cigarette pricet×previous use 11+ cigarettes — (−) — (−) — (−)
Cigarette pricet×dropout — (−) — (−) — (−)
Cigarette pricet×female — (−) — (−) — (−)
Previous smoker — (−) — (−) — (−)
Previous intensity 6–10 cigarettes — (−) — (−) — (−)
Previous intensity 11+ cigarettes — (−) — (−) — (−)
Dropout indicator — (−) — (−) — (−)
Female 0.044 (0.046) −0.210 (0.088)** −0.549 (0.099)**
Black −1.594 (0.128)** −1.243 (0.325)** −1.210 (0.355)**
Hispanic −0.410 (0.077)** −1.062 (0.192)** −1.421 (0.233)**
Other/nonwhite −0.740 (0.100)** −0.073 (0.184) −0.680 (0.255)**
Standardized test score — (−) — (−) — (−)
Test score squared — (−) — (−) — (−)
Test score missing — (−) — (−) — (−)
Baptist — (−) — (−) — (−)
No religion — (−) — (−) — (−)
Gilleskie and Strumpf
851
Religion missing — (−) — (−) — (−)
Number of older siblings — (−) — (−) — (−)
Older siblings missing — (−) — (−) — (−)
Sibling drop out — (−) — (−) — (−)
Sibling drop out missing — (−) — (−) — (−)
Live with mom and dad — (−) — (−) — (−)
Live with mom only — (−) — (−) — (−)
Family composition missing — (−) — (−) — (−)
Family socioeconomic status — (−) — (−) — (−)
Parents education — (−) — (−) — (−)
Parents education missing — (−) — (−) — (−)
Parent’s work — (−) — (−) — (−)
Parent’s work missing — (−) — (−) — (−)
Guardian born before 1940 — (−) — (−) — (−)
Guardian born 1940–55 — (−) — (−) — (−)
Guardian’s age missing — (−) — (−) — (−)
Public school — (−) — (−) — (−)
Prop on free lunch — (−) — (−) — (−)
Free lunch info missing — (−) — (−) — (−)
Prop Hispanic in school — (−) — (−) — (−)
Prop Black in school — (−) — (−) — (−)
Racial composition missing — (−) — (−) — (−)
Prop with single parent — (−) — (−) — (−)