Full Terms & Conditions of access and use can be found at
http://www.tandfonline.com/action/journalInformation?journalCode=cbie20
Download by: [Universitas Maritim Raja Ali Haji] Date: 17 January 2016, At: 23:58
Bulletin of Indonesian Economic Studies
ISSN: 0007-4918 (Print) 1472-7234 (Online) Journal homepage: http://www.tandfonline.com/loi/cbie20
What can Indonesia learn from China's industrial
energy saving programs?
Michael T. Rock
To cite this article: Michael T. Rock (2012) What can Indonesia learn from China's industrial energy saving programs?, Bulletin of Indonesian Economic Studies, 48:1, 33-55, DOI: 10.1080/00074918.2012.654483
To link to this article: http://dx.doi.org/10.1080/00074918.2012.654483
Published online: 14 Mar 2012.
Submit your article to this journal
Article views: 293
View related articles
ISSN 0007-4918 print/ISSN 1472-7234 online/12/010033-23 © 2012 Indonesia Project ANU http://dx.doi.org/10.1080/00074918.2012.654483
‘Indonesia in Comparative Perspective’ Series
WHAT CAN INDONESIA LEARN FROM
CHINA’S INDUSTRIAL ENERGY SAVING PROGRAMS?
Michael T. Rock*
Resources for the Future, Washington DC, and Bryn Mawr College, Bryn Mawr PA
Even though Indonesia’s CO2 emissions are dominated by deforestation while China’s are dominated by industry, Indonesia has much to learn from China’s in-dustrial energy saving programs. To begin with, it is only a matter of time before Indonesia’s emissions from fossil fuels overtake those from deforestation. Given the long technological lock-in effects of energy systems and industries, Indonesia needs to think now about how it will tackle this problem. There are other reasons for believing that Indonesia might learn something from China – the CO2 intensities of GDP, of industry and of cement production have been rising in Indonesia, while they are falling in China. China’s better intensity performance is due to policies that Indonesia would do well to follow – adopting a technological catch-up industrial development strategy; raising energy prices to scarcity values; liberalising domestic markets and opening the economy to trade and investment; and mounting a mas-sive energy saving program.
Keywords: energy policy, industrial policy, environment, technology
INTRODUCTION
Comparing China and India has become something of a growth industry. Com -paring China and Indonesia is anything but.1 That said, an interesting essay in
this journal (Hofman, Zhao and Ishihara 2007) compares development strategies and outcomes in these two countries. They ind broad similarities in reformist development strategies, a common reliance on growth for political legitimacy, and remarkably similar development outcomes (high growth; rapid declines in the incidence of poverty; solid total factor productivity growth; low inlation; and
* [email protected]. I wish to thank Michael Toman of the Development Research Group at the World Bank for his guidance and support for my China work. Financial sup-port from the Knowledge for Change Program at the World Bank is gratefully acknowl-edged. The views and indings presented here should not be attributed to the World Bank, its management or its member countries. I also wish to thank Resources for the Future for supporting my China work via the Gilbert F. White Fellowship. Finally, I would like to thank Chris Manning and Budy P. Resosudarmo for comments on earlier drafts.
1 An amazon.com search for ‘China and India’ turned up 15 books, while a library search of journal articles on ‘China and India’ generated 224 references. Comparable searches for ‘China and Indonesia’ found three books and 15 journal articles (searches conducted on 4 May 2011).
substantial shifts in the structure of production following reform).2 Given these
indings, both countries might be well served by more detailed and less macro comparisons. That is what is attempted in this paper.
But the focus of comparison here is in what many will think an odd place – energy use and carbon dioxide (CO2) emissions. On its face such a comparison appears foolhardy. Energy use in industry dominates CO2 emissions in China, while deforestation and land cover change dominate CO2 emissions in Indonesia (Fisher-Vanden et al. 2004; Resosudarmo et al. 2011). Given this monumental dif -ference, some may conclude that Indonesia has little to learn from China. But, as Resosudarmo et al. argue (2011: 148), it is only a matter of time before CO2 emissions from fossil fuels overtake those from deforestation. Given the potential for technological lock-in associated with investments in the energy sector and in industry, it behoves Indonesia to begin thinking now about how it might save energy and reduce CO2 emissions in industry.
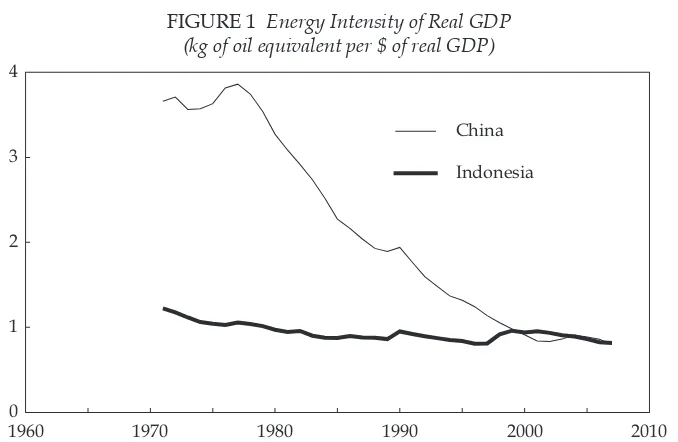
There is one other reason to consider what Indonesia can learn from China. China has been much more successful than Indonesia in reducing the CO2 inten -sity of GDP and of industry, despite the fact that its energy mix is more depend -ent on coal – an energy source with a very high CO2 emissions factor.3 China has
experienced a rather remarkable decline in the energy intensity of its GDP, while Indonesia has not (igure 1). At the start of China’s program of economic reform in
2 Of course they also ind important differences, including Indonesia’s low and stable in-come inequality and China’s rapidly rising inequality (Hofman, Zhao and Ishihara 2007: 174).
3 China depends on coal for about 80% of its energy, Indonesia for about 40% (World Bank, World Development Indicators, <http://data.worldbank.org/data-catalog/world-development-indicators>).
FIGURE 1 Energy Intensity of Real GDP (kg of oil equivalent per $ of real GDP)
1960 1970 1980 1990 2000 2010
0 1 2 3 4
China
Indonesia
Source: World Bank, World Development Indicators, <http://data.worldbank.org/data-catalog/world-development-indicators>.
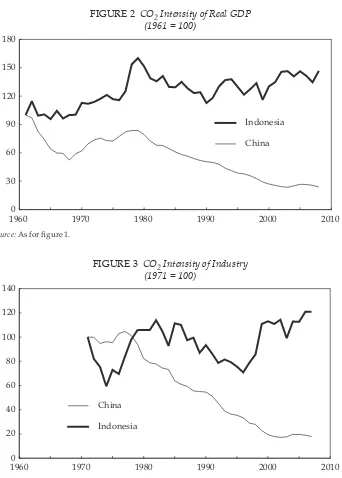
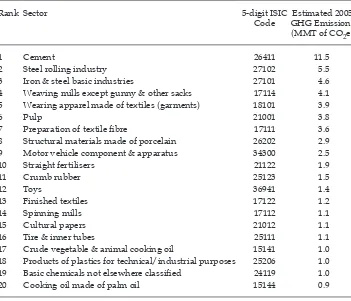
1978, energy use per dollar of real GDP was nearly four times as high in China as in Indonesia, yet by 1999 there was virtually no difference in the energy intensity of GDP in China and Indonesia. Even more surprisingly, the CO2 intensity of GDP has been falling in China, though it has been rising in Indonesia (igure 2). While one might suspect that the rise in the CO2 intensity of GDP in Indonesia is simply a consequence of deforestation, igure 3 suggests that at least part of it is due to a
FIGURE 2 CO2 Intensity of Real GDP (1961 = 100)
1960 1970 1980 1990 2000 2010
0 30 60 90 120 150 180
China Indonesia
Source: As for igure 1.
FIGURE 3 CO2 Intensity of Industry (1971 = 100)
1960 1970 1980 1990 2000 2010
0 20 40 60 80 100 120 140
China Indonesia
Sources: World Bank, World Development Indicators (see igure 1); IEA (International Energy Agency), online data services, available at <http://data.iea.org/ieastore/statslisting.asp>.
rise in the CO2 intensity of industry.4 Here again, the Chinese experience is quite
different from that of Indonesia.
What accounts for these differences? There appear to be at least three answers to this question. To begin with, China started its reform period with unusually high energy and CO2 intensities. This, no doubt, was a consequence of the heavy industry and energy ineficiency focus of its socialist development strategy. From this perspective, it may not be particularly surprising that China experi -enced rapid declines in energy and CO2 intensities following the onset of market-oriented reforms. Second, as will be demonstrated, better performance in China appears also to be a consequence of a more open trade5 and investment regime;6
a more complete market liberalisation program;7 energy prices that are closer to
their scarcity values;8 and a concerted effort by the government of China to reduce
the energy intensity of GDP. Finally, China has a better technological catch-up performance.9 Better catch-up policies mattered because they enabled industrial
enterprises in a wide range of sectors to upgrade their technological capabilities substantially so they could more easily beneit from the environmental technique effects associated with liberalisation (particularly the rise in energy prices), priva -tisation and the opening of the economy to trade and investment. This successful policy package suggests that Indonesia may have much to learn from China.
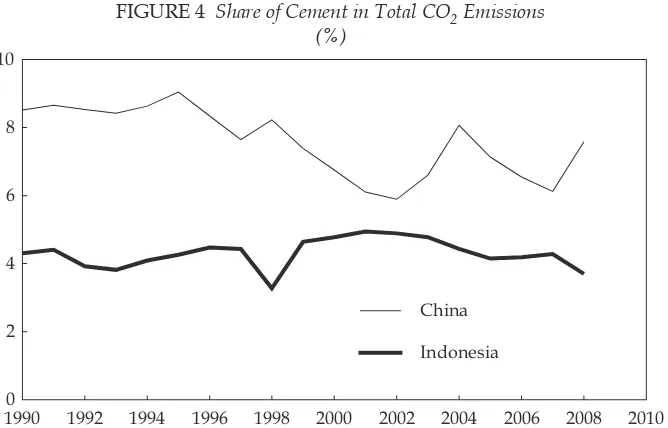
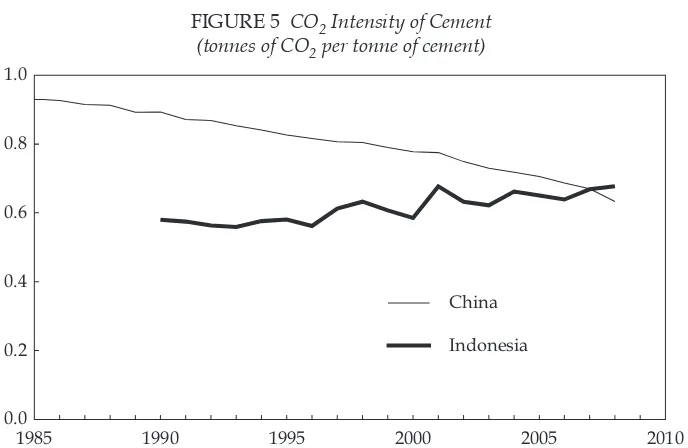
What follows demonstrates how this policy package contributed in China to rapid declines in the energy and CO2 intensity of production in one energy-intensive industry – cement. There are three reasons to focus on cement. First, it is one of the largest industrial emitters of CO2 in both countries (see table 1 for Indonesia and Wang, Wang and Zhang 2005 for China). Figure 4 shows that cement accounts for an average of roughly 5% of CO2 emissions in Indonesia and 6% in China over the last two decades. Second, the CO2 intensity of cement is falling in China but appears10 to be rising in Indonesia
4 The CO2 intensity of GDP includes CO2 emissions from land cover change, while the CO2 intensity of industry and of cement does not.
5 Following Lipsey and Sjöholm (2011), I regressed country trade shares in 2005 on coun-try land area and population, and compared predicted values with actual values. China’s actual trade share is nearly 45% higher than expected, while Indonesia’s is only 9% higher than expected.
6 Lipsey and Sjöholm (2011) argue that the stock of inward foreign direct investment (FDI) in Indonesia is much lower (only 59%) than might be expected for a country with its char-acteristics, while China’s stock of inward FDI is roughly what can be expected.
7 Price controls, non-tariff barriers (NTBs) and import licensing and quotas have virtually disappeared from China (Branstetter and Lardy 2008), while NTBs and price controls have become more common in Indonesia (Basri and Hill 2008).
8 Petrol and electricity prices in particular are well below their scarcity values in Indonesia (Basri and Hill 2008).
9 See the discussion of technological catch-up policies in China below. Lipsey and Sjöholm (2011) argue that Indonesia has weak technological capabilities, while Hill (1995) argues that Indonesia does not have a technology policy.
10 I say ‘appears’ simply because there are no reliable estimates of CO2 emissions from cement in Indonesia. Constructing estimates by relying on very limited energy use data from the central statistics agency (BPS) does not seem to help either – it suggests that the
CO2 intensity of cement was virtually zero in 2004! The estimate in igure 5 is based on the following calculations. The International Energy Agency (IEA) online data services at <http://data.iea.org/ieastore/statslisting.asp> report CO2 emissions from fuel burning for the non-metallic minerals sector in Indonesia. An IEA report (IEA 2007: 139) argues that 70–80% of CO2 emissions in this sector are from cement. The German aid agency GTZ suggests that CO2 emissions from the non-metallic minerals sector on Java in 2005 were overwhelmingly (more than 90%) dominated by cement (GTZ 2009: 49). To err on the side of under-estimation, I assumed that cement accounted for 50% of the CO2 emissions from the non-metallic minerals sector. Since IEA data do not take account of CO2 emissions from the calcination of limestone in kilns – the process that produces clinker, the molten marble-sized chunks that are cooled and ground to produce cement (Plunkett, Morgan and Pomeroy 1997: 77) – I assumed 0.5 tonnes of CO2 per tonne of clinker from calcination of limestone and a clinker-to-cement ratio of 80%. This ratio is well below the average for the three cement enterprises operating on Java in 2005 (90%) and what Holcim and Indo-cement achieved on Java in 2003 (95.8%) (GTZ 2009: 49).
TABLE 1 Greenhouse Gas Emissions (GHG) from Manufacturing in Indonesiaa
Rank Sector 5-digit ISIC
Code GHG Emissions Estimated 2005 (MMT of CO2e)
1 Cement 26411 11.5
2 Steel rolling industry 27102 5.5
3 Iron & steel basic industries 27101 4.6
4 Weaving mills except gunny & other sacks 17114 4.1
5 Wearing apparel made of textiles (garments) 18101 3.9
6 Pulp 21001 3.8
7 Preparation of textile ibre 17111 3.6
8 Structural materials made of porcelain 26202 2.9
9 Motor vehicle component & apparatus 34300 2.5
10 Straight fertilisers 21122 1.9
11 Crumb rubber 25123 1.5
12 Toys 36941 1.4
13 Finished textiles 17122 1.2
14 Spinning mills 17112 1.1
15 Cultural papers 21012 1.1
16 Tire & inner tubes 25111 1.1
17 Crude vegetable & animal cooking oil 15141 1.0
18 Products of plastics for technical/industrial purposes 25206 1.0
19 Basic chemicals not elsewhere classiied 24119 1.0
20 Cooking oil made of palm oil 15144 0.9
a ISIC = International Standard Industrial Classiication; MMT = million metric tons (million tonnes);
CO2e= carbon dioxide equivalent.
Source: Ministry of Finance and National Council on Climate Change (2009: 19), citing BPS (2005) and AIRD (2009): ‘Estimates are based on surveyed energy use among medium and large irms (BPS 2005) and Ministry of Industry natural gas estimates for major users (AIRD 2009)’.
(figure 5). Given that Indonesia’s large-scale cement industry uses state-of-the-art OECD production technologies and is dominated by OECD cement multinationals,11 the latter finding, by itself, is surprising. Finally, opportu
-nities to save energy and reduce CO2 emissions in particular industries are inextricably linked to the underlying technological regimes in those indus -tries. While the focus is on cement, similar stories can be told for China about iron and steel (Rock, Kejun and He 2011); aluminium (Rock and Wang 2011); and pulp and paper (Rock and Song 2011). Said another way, there appears to be a successful pattern of policies and institutions affecting energy use and CO2 emissions across a number of industries in China.
A TALE OF TWO INDUSTRIES
The development paths of China’s and Indonesia’s cement industries could not be more different. The story of China’s cement industry following the onset of economic reform is one of technological modernisation (Rock and Cui 2011) that facilitated rapid growth in the industry,12 and equally rapid declines in the energy
11 Of the four biggest cement producers in Indonesia in 2006, Cemex owned 24.9% of Gresik; Lafarge (Cementia) owned 88% of Andalas Indonesia; Holcim owned 77% of Ci-binong; and Heidelberg Cement owned 65% of Indocement (Timuryono 2007). The latter share declined to 51% following Heidelberg’s sale of some of Indocement’s shares in 2009 (HeidelbergCement 2011: 170). Efforts to privatise Indonesian cement producers began soon after the Asian inancial crisis of 1997–98 (Bird 2004: 100; Prasetiantono 2004: 148), and An-dalas Indonesia, Cibinong and Indocement continue to have majority foreign ownership. 12 Cement production in China rose from 146 million tonnes in 1985 to 1.86 billion tonnes in 2010 (Rock and Cui 2011: 62)
FIGURE 4 Share of Cement in Total CO2 Emissions (%)
1990 1992 1994 1996 1998 2000 2002 2004 2006 2008 2010 0
2 4 6 8 10
China
Indonesia
Sources: World Bank (2011); IEA (International Energy Agency), Online data services, available at <http://data.iea.org/ieastore/statslisting.asp>; author’s calculations.
and CO2 intensity of cement production. The story of Indonesia’s cement indus -try, especially after the New Order came to power, also revolves around rapid growth,13 but there the primary concern has been in curbing quasi-monopoly
power (Plunkett, Morgan and Pomeroy 1997). On the eve of China’s economic reforms, its cement industry was tiny, energy intensive, technologically back -ward, and conducted in small-scale, geographically dispersed enterprises. In New Order Indonesia, a domestic cement industry was fostered by import substi -tution policies and subsequently led by a small number of relatively large state-owned and private sector irms producing cement with modern rotary kilns. While China used an array of industrial and technology policies to restructure its cement industry completely, Indonesia struggled to ind a successful regulatory strategy that limited the market power of the country’s protected cement irms. While China enticed its cement enterprises to upgrade technologically, there is no evidence that Indonesia was concerned with the technological capabilities of its cement producers. While China encouraged (by increasing energy prices) and forced (through mandatory energy savings programs) its cement enterprises to save substantial amounts of energy (and CO2) emissions, Indonesia talked about the need to do so, but did little. What follows describes the trajectory of each country’s cement industry and the policies and institutions that inluenced those trajectories.
13 Cement production in Indonesia rose from 5 million tonnes in 1980 to 22 million tonnes in 1994 (Plunkett, Morgan and Pomeroy 1997: 79) and 42 million tonnes in 2010 (US Ge-ological Survey, ‘Minerals Information’ website, accessed 1 November 2011 at <http:// minerals.usgs.gov/minerals/pubs/commodity/cement/>).
FIGURE 5 CO2 Intensity of Cement (tonnes of CO2 per tonne of cement)
1985 1990 1995 2000 2005 2010
0.0 0.2
0.4 0.6 0.8 1.0
China
Indonesia
Sources: Cement production data for Indonesia: US Geological Survey, ‘Minerals Information’ website, accessed 1 November 2011 at <http://minerals.usgs.gov/minerals/pubs/commodity/cement/>; energy use data for Indonesia: see footnote 10. All data for China are from Rock and Cui (2011).
The history of cement in Indonesia
The history of Indonesia’s cement industry is intimately bound up with the broader evolution of Indonesia’s economic and industrial development. In the early part of the 20th century, the Dutch imposed tariffs on Japanese imports, spawning a small
boom in import substitution – including the building of Indonesia’s irst mod -ern cement plant, the NV Nederlandsch-Indische Portland Cement Maatschappij in Padang, with Dutch capital (Robison 1986: 9). Two other cement companies emerged between independence and the collapse of the Soekarno government in the mid-1960s.14 After Soeharto’s New Order government replaced the Soekarno
regime, industrial policies were quite bifurcated until the mid-1980s, when Indo -nesia inally began to deregulate its economy and open it to trade and investment. In consumer goods, New Order industrial policy focused on attracting foreign direct investment (Hill 1986), but in industries that were resource based, skill based (autos) and capital intensive (iron and steel), policy was quite interven -tionist. Because of this, state control of banks and the banking system, includ -ing the administrative allocation of highly subsidised credit, lasted into the 1980s (MacIntyre 1993). State-owned industries in cement,15 petrochemicals and steel
were hallmarks of the ‘industrial deepening’ policies of the 1970s and of the high-technology policies that followed (McKendrick 1992; Auty 1990). State allocation of lucrative import and commodity distribution licences, including in cement, was an essential part of the New Order’s relationship with the Sino-Indonesian business community (World Bank 1989; Robison 1986: 302).16 Extensive regula
-tion of both domestic and foreign investment lasted into the 1990s (World Bank 1989: 70).
When it came to competition, the New Order government preferred monopo -listic structures, particularly in resource-based industries. A state company held a monopoly on oil and gas development and distribution and a state logistics com -pany controlled the distribution of basic commodities (Bresnan 1993: 125–9, 164– 93). One well-known Soeharto ‘crony’ capitalist held a monopoly on lour milling and trade in cloves (Elson 2001: 252). Another controlled much of the logging and plywood industry (Barr 1998). In cement, Indonesia had a three-irm concentra -tion ratio of 92% in 1995; one irm, PT Indocement, owned by a Soeharto crony, controlled 40% of capacity (Plunkett, Morgan and Pomeroy 1997: 82). The cement industry was also heavily protected from foreign competition.17
Given this policy thrust, it is not surprising that the cement industry, which was considered strategic by the New Order government, was heavily regulated (Maarif 2001: 17–21; Plunkett, Morgan and Pomeroy 1997). For much of the New Order period, access to the industry was restricted by a ‘Negative List for Invest -ment’. The government routinely controlled the price of cement in every regional
14 PT Semen Gresik was built by the government in Gresik in East Java in 1957. In 1960, PT Semen Tonasa was established in South Sulawesi. (I wish to thank an anonymous reviewer for this information.)
15 By 1974, state-owned enterprises controlled 75% of cement production (Robison 1986: 144).
16 Plunkett, Morgan and Pomeroy (1997) describe the regulation of the cement industry from 1974.
17 The effective rate of protection for cement was 138% in 1987 (Maarif 2001: 17).
market.18 It divided the market by allocating cement deliveries by each producer
to each regional market and by appointing local distributors and retailers. It also allocated the right to import cement (Plunkett, Morgan and Pomeroy 1997: 87). Many of these actions took place or were reinforced in monthly meetings between the Indonesian Cement Association and government regulators. While the osten -sible reason for regulation was to ensure the availability of ample amounts of cement at reasonable prices in each regional market, in fact the government acted as an enforcer for the industry association’s cement cartel.
As Indonesia began the long and arduous process of deregulating industry and opening it to trade and investment in the late 1980s, the cement industry too was progressively deregulated (Plunkett, Morgan and Pomeroy 1997: 88; Maarif 2001: 17–20). In 1987, rules governing the export and import of cement were simpliied. In 1990, all restrictions on imports were removed. In 1993 restrictions on entry were eliminated. By 1995, the effective rate of protection for cement had dropped to –12%. Price controls were lifted in 1997 (though they were later re-instated; see Basri and Hill 2008: 1,402). Following the East Asian inancial crisis in 1997–98, OECD cement multinationals bought controlling shares in Indonesian cement companies at ire-sale prices (see footnote 11).
Despite these moves towards deregulation, the industry remains highly con -centrated. By the early 2000s, the four big producers controlled by OECD cement multinationals accounted for nearly 94% of the domestic market, while seven companies controlled 100% of production (Prasetiantono 2004: 147). This in part relects the fact that the Indonesian market is small by large developed and devel -oping country (China and India) standards, despite the rapid rise in cement pro -duction in the two decades before the Asian inancial crisis. It also relects the importance of economies of scale in the cement industry. However, there is seri -ous concern that this deregulated industry continues to act as a cartel that limits competition, divides up the market and controls prices.19
To make matters worse, there is little evidence that the Indonesian government assisted irms in upgrading their technological capabilities in the 1980s and 1990s. By the mid-1990s, Indonesia lagged behind its East Asian neighbours on most technology indicators. Its spending on research and development (R&D) was very low (0.2% of GDP); it had very few patent applications (12 between 1981 and 1990); very few scientists and engineers were engaged in R&D (183 per million of the population); enrolments in tertiary education were low (10% of the relevant age group in 1991); and few young adults had science or engineering degrees (0.4% of 22–23-year-olds) (Hill 1995: 92). Indonesia’s restrictive policies inhibited the inlow of new technology, and private irms under-invested in training and R&D (Hill 1995: 103–7).
Things have not improved much. R&D spending as a share of GDP was even lower in 2005 than it was in the 1990s (only 0.05% of GDP); meanwhile US majority-owned manufacturing afiliates operating in Indonesia were spending only 0.06% of employee compensation, or $80 per employee, on R&D in 2004
18 This began in 1974, when the government set a ceiling price on bagged cement (Plun-kett, Morgan and Pomeroy 1997: 86).
19 ‘KPPU [the Business Competition Supervisory Commission] alleges cartel in cement industry’, Jakarta Post, 25/1/2010.
(Lipsey and Sjöholm 2011).20 The comparable igures for US irms operating in
China were 14.9% of employee compensation and $1,492 per employee. In addi -tion, Indonesia is falling behind in the attraction of inward foreign direct invest -ment. Because of this, it is not particularly surprising that total factor productivity growth has been low in Indonesia, although it has tended to be higher during periods of economic liberalisation (Thee 2006: 342). Nor is it surprising that total factor productivity growth in cement has been uneven.21
Given this coniguration, how have Indonesia and its cement industry responded to growing pressures to save energy and reduce CO2 emissions? There is substantial evidence to suggest that both the government and the industry are very aware of the pressing need to save energy in cement production, and of the options and costs associated with doing so. The Indonesian government’s climate change sectoral roadmap (Republic of Indonesia 2009: 59) and an inter -nal Ministry of Finance report (Ministry of Finance and Natio-nal Council on Cli -mate Change 2009) identify cement as the most energy-intensive manufacturing industry and (as table 1 conirms) the one with the highest level of energy and CO2 emissions; and the roadmap identiies the abatement reduction potential in cement (Republic of Indonesia 2009: 62–4). Both PT Indocement (Hoidalen 2004) and the Indonesian Cement Association (Timuryono 2007) have participated in seminars in Indonesia that identify the opportunities for saving energy and CO2 in Indonesia’s cement industry.
Both the government and the cement industry are also keenly aware of the industry’s heavy reliance on coal as the primary source of energy. In 2005 over 8 million of the industry’s almost 12 million tonnes of CO2 emissions came from coal (Ministry of Finance and National Council on Climate Change 2009: 20, ig -ure 2.3). More recently, the government has developed an abatement cost curve for the cement sector through 2030 that identiies three win–win cost-effective interventions: shifting to blended cements;22 using alternative fuels; and recover
-ing heat to co-generate electricity (Dewan Nasional Perubahan Iklim 2010: 34). But so far, there is little evidence to suggest that all this activity has generated concrete programs in either government or the private sector to save energy in cement. Nor is there much evidence, so far, of actual energy and CO2 savings.23
Indonesia’s experience stands in marked contrast to that of China.
20 Lipsey and Sjöholm (2011) provide comparative data to illustrate how Indonesia has lagged behind neighbouring countries, including China, on various technological indica-tors.
21 Total factor productivity growth in Indonesia’s non-metallic minerals industry, which is dominated by cement, varied from 10.3% per year between 1976 and 1980 to a low of –4.1% per year between 1981 and 1983 (Vial 2006: 367).
22 About 50% of CO2 emissions in cement production come from clinker making (Galitsky and Price 2007), so reducing clinker content by blending in other materials can signiicantly reduce the CO2 intensity of cement production.
23 That said, GTZ (2009: 49) shows that blended cement accounted for 10% of cement pro-duced in three cement enterprises operating on Java in 2005, while roughly 4% of cement production at Holcim and Indocement in 2005 was blended. While this level of blended ce-ment will save on energy use and CO2 emissions from calcination, it is negligible compared
The history of cement in China
On the eve of its economic reforms, China’s cement industry was tiny; its activi -ties were small in scale, geographically dispersed, very energy intensive and tech -nologically backward (Rock and Cui 2011). This coniguration was a consequence of three distinct but inter-related polices adopted between 1961 and 1966: admin -istrative decentralisation of central planning (Wu 2005: 44; Lardy 1978: 137–44); an ‘agriculture irst’ development strategy (Prybyla 1970: 366–7); and government support for the ‘ive small producer goods industries’, including cement, that served agriculture (Whiting 2001: 50; Wong 1979: 10–12). Administrative decen -tralisation was China’s answer to the problems caused by a Soviet-style plan -ning framework that was unsuitable for Chinese conditions. The ‘agriculture irst’ development strategy was aimed at increasing grain output, while the ‘ive small industries serving agriculture’ program was intended to increase the supply of modern inputs to agriculture. This development strategy lasted until 1978.
Between 1961 and 1978 this combination of policies fostered the emergence of a small-scale technological regime in cement, using antiquated vertical shaft kiln technology.24 China started building small-scale cement plants in 1958; by 1965, it
had 200 of them, accounting for 30% of cement production. The number of small-scale plants rose to 1,800 in 1971 and 2,800 in 1975. By 1975, 80% of China’s more than 2,100 counties had at least one small-scale cement plant, and small-scale cement plants accounted for 61% of production. Market liberalisation of the rural economy after 1979 strengthened this technological regime. By 2002, 3,657 small-scale cement irms (Ligthart 2003) accounted for 72% of production (Cui 2009).
But by the early 1990s, as the returns to China’s decentralised and small-scale industrial development strategy began to slow, the government altered direction to foster the development of a socialist market economy (Yusef, Nabeshima and Perkins 2006: 70). Initial changes focused on deregulating the industrial economy and opening it to private enterprise. In 2003 the central government began a mas -sive restructuring program that included efforts to foster a set of ‘national cham -pions’ in a wide range of key industries, including cement.
At the same time, the government decided to revitalise state-owned enterprises by privatising a very large number of township and village enterprises (TVEs) and adopting an industrial development strategy based on ‘grasping the large, letting go of the small’ (Sutherland 2003: 10). This strategy was based on an assumption that the government could use large state-owned industries to create East Asian style conglomerates that could compete with OECD multinationals. Following the targeting of 57 state-owned industrial groups for promotion, including sev -eral in cement (Sutherland 2003: 46), the core enterprise in each group was (1) granted greater control over state assets in the group; (2) encouraged to develop an internal inance company to mobilise capital; and (3) permitted to annex state research institutes to enhance the group’s R&D capabilities.
The aims of the ‘grasping the large’ restructuring program in cement were to close small vertical shaft kiln cement plants; to shift to larger production lines
with the level achieved in China. There 40% of cement is blended, saving nearly 600 million tonnes of CO2 in 2010 (see igure 6 below).
24 Detailed descriptions of this technology are provided in Sigurdson (1977: 152–66) and Perkins (1977: 177–93).
using state-of-the-art rotary kilns; to create a small number of very large irms that could compete with the OECD cement conglomerates (Ligthart 2003); and to develop an export-oriented indigenous engineering and capital goods and ser -vices industry in cement (Rock and Cui 2011). To achieve these goals, the govern -ment adopted a set of speciic quantitative restructuring objectives. By 2010 China expected to have reduced the number of cement irms by 40%. When combined with new investment, large rotary kilns were expected to account for 70% of out -put by 2010, and by the same year the government aimed to increase the share of output by the top 10 irms to 35% (roughly 350 million tonnes) (Price and Galit -sky 2007). This restructuring program has achieved substantial progress. Large new rotary kilns increased their share of cement production from 9.6% in 2000 to 34.2% in 2005 (Kang 2007). By 2010, the share of ‘large’ rotary kiln-based plants in cement production had exceeded the target, reaching 80% (Rock and Cui 2011). By 2005, the top 10 irms in the industry had increased their share of production from 4% in 2000 to 13.7% (still some way from the 35% target for 2010), while the top 25 publicly listed companies in 2005 accounted for 25% of production (Kang 2007).
Two other aspects of China’s industrial and technology policies affected the cement industry. As part of the 15th ive-year plan (2001–05), China decided that it
needed to shift emphasis from capital accumulation to technical change (Gu et al. 2009: 372). The government set out to increase technological spillovers from FDI and to become an innovation economy. With respect to the latter, it reformed its national innovation system by radically increasing R&D expenditures as a share of GDP,25 funding a number of new science and technology (S&T) programs,26
and converting a large number of government research institutes into market-driven non-government S&T enterprises.27
As a result, there has been a signiicant shift in the use of S&T resources, away from government research institutes and towards enterprises (Guan, Yam and Mok 2005: 340). New rules governing S&T spin-off enterprises have spawned a signiicant number of very successful non-state S&T enterprises such as Lenovo and Stone in information technology (Lu 2003) and Sinoma International in cement (Rock and Cui 2011). And the absorption of engineers from government research institutes by large modern shareholding enterprises such as Capital Steel and Baosteel has facilitated productivity growth within these enterprises and the export of iron and steel making capital equipment and know-how (Brandt, Raw -ski and Sutton 2008: 603; Rock, Kejun and He 2011).
The government also experimented with a range of policies to increase techno -logical spillover from FDI. In the early 1980s, during the early stages of the open -ing of the economy, it supported a ‘make it ourselves’ approach to technological upgrading. When that strategy failed, as it did in cement (Rock and Cui 2011), the
25 R&D expenditures as a share of GDP rose from 0.6% in 1994 to 1.4% in 2006 (Hu and Jefferson 2008: 288).
26 These include the 863 Program and the 973 Program, which focus on basic research and frontier technologies; the Torch Program, which supports high-tech industries; and the Spark Program, which is aimed at developing S&T to revitalise the rural economy (Hu and Jefferson 2008: 294).
27 Some government research institutes closed, others merged, while still others were ab-sorbed by enterprises (Hu and Jefferson 2008: 293).
government used its market power from the mid-1980s to the mid-1990s to trade access to its market for technology transfer. That strategy bogged down in the mid-1990s, leading the government to encourage domestic enterprises to make investments in research and development. And it linked the import of foreign technologies and complete (or ‘turnkey’) manufacturing plants with the training of domestic engineers.
There is substantial evidence that these strategies worked. A study of large and medium cement enterprises in China between 2001 and 2004, undertaken using a capital, labour, energy and materials (KLEM) framework, shows that enterprise investments in R&D have a signiicant impact on a cement enterprise’s energy intensity – that is, an increase in R&D expenditures as a share of an enterprise’s sales reduces the energy intensity of its production (Fisher-Vanden et al. 2011). A recent case study shows that investments in technological capabilities enabled a large Chinese cement industry research and design enterprise to capture a signii -cant share of the domestic and international markets for new cement plants (Rock and Cui 2011).
Finally, the government has been pushing industrial enterprises to save energy (Price, Wang and Yun 2008). Beginning in the early 1980s, it did so simply by building energy eficiency into its command economy, establishing energy inten -sity standards for a large number of industrial sub-sectors and enterprises, and limiting the supply of energy to enterprises based on those standards (Sinton, Levine and Wang 1998: 818–25). This ‘energy quota’ management system was reinforced by signiicant investments in energy conservation; by the creation of a large number of energy conservation centres that provided energy eficiency services to enterprises; and by the development of a credible energy statistics collection and reporting system that enabled the government to track enterprise and industry performance relative to established standards. This package of poli -cies and institutions helped reduce the energy intensity of GDP by 5.2% per year between 1980 and 2002 (Zhou, Levine and Price 2010: 1), while the energy inten -sity of cement fell by 17% between 1985 and 2002 (Rock and Cui 2011).
As the economy shifted increasingly from plan to market, and government re-organisation emphasised regulatory rather than planning functions in the early 2000s (Naughton 2003), this set of policies and institutions became less useful and they simply withered away. At the same time, the energy intensity of GDP rose by 3.8% per year between 2002 and 2005 (Zhou, Levine and Price 2010: 1). Startled by this setback in 2005, the government developed a new set of policies to reduce energy intensity.28 It eliminated energy subsidies to industrial enterprises
and removed export rebates for energy-intensive products, including cement. It set a new target of improving the energy intensity of GDP by 20% between 2006 and 2010. To achieve this goal, the government redoubled efforts to close enter -prises that used backward technologies, including vertical shaft cement kilns. In 2006, it created a program for improving energy eficiency in the country’s top 1,000 industrial enterprises, including those producing cement (Price, Wang and Yun 2008). It revitalised the country’s energy conservation centres and rebuilt the statistical system for tracking performance at enterprises and in local govern -ments. It linked the new energy intensity standards system to the cadre personnel
28 This paragraph draws on Zhou, Levine and Price (2010).
evaluation system. Available evidence suggests that the government met its over -all energy intensity improvement goal for 2010 (Zhou, Levine and Price 2010).
How has this set of policies and institutions – which emphasise technological upgrading; openness to trade, investment and new ideas; and energy eficiency – affected energy intensity in China’s cement industry? There are several answers to this question. With respect to technological upgrading, the inding of Fisher-Vanden et al. (2011) that cement enterprise investments in R&D have a statistically signiicant effect on energy eficiency has been illustrated at the enterprise level. A study of technological upgrading in one medium-sized cement enterprise found that its investments in long-run technological learning enabled it to reduce energy intensity by 30% between 1980 and 2009 (Rock and Cui 2011). These investments in technological learning also enabled the irm to maintain a substantial energy eficiency advantage over the rest of the vertical shaft kiln industry. Openness to new ideas from the international community also helped this irm to save energy. Fortunately, this experience is not an isolated one. Since 1979, China’s govern -ment has made numerous invest-ments in technological upgrading and energy saving in vertical shaft cement kilns. As a result, comprehensive energy consump -tion in these kilns declined by nearly 25% between 1985 and 2010 (Rock and Cui 2011: 64). Meanwhile the government was phasing out vertical shaft kiln cement plants and replacing them with large, modern rotary kiln cement plants. Because the import costs of this shift were prohibitive, government funds supported the development of an indigenous technological capability to design, make, install, commission and service a Chinese version of a large modern rotary kiln. The gov -ernment turned to three of its national cement industry design and research insti -tutes to develop these capabilities.29
During the 1980s and early 1990s, one of these institutes attempted to design, manufacture and operate a small rotary kiln (with a capacity of 700 tonnes per day) without any external assistance. But this effort failed. From the mid-1990s, the Ministry of Building Materials imported four turnkey rotary kiln cement pro -duction lines from Europe and Japan. As part of the acquisition, the government required the foreign engineers to teach Chinese cement engineers how to design new cement plants; manufacture cement-making equipment; and install, commis -sion and service new cement production lines. A detailed description of how this happened can be found in Rock and Cui (2011). Sufice it to say that, as a conse -quence of this one experience with openness to trade and investment, the research institutes mastered each of these tasks and formed a public–private cement engi -neering enterprise, Sinoma International, which went on to capture a large share of the Chinese and international markets for new cement plants.
China’s cement enterprises also saved energy in response to increases in its price, particularly the price of coal. The study by Fisher-Vanden et al. (2011) demonstrates that rising energy prices encouraged signiicant energy savings. There is strong evi -dence too to suggest that the government’s mandatory energy saving programs made a difference. During the period of the irst program (1980–2002), energy inten -sity in China’s cement industry fell by 1.7% per year. Between 2006 and 2010, dur -ing the second program, energy intensity fell by 6.3% per year (Rock and Cui 2011).
29 One of these was in Tianjin, one was in Nanjing and the other was in Chengdu.
In sum, the available evidence suggests that investments in technological learning and openness to trade and investment (and new ideas), alongside pres -sures to save energy, helped cement enterprises in China to reduce their energy intensity. But what precisely have cement enterprises done to save energy and how much energy and CO2 have been saved? A large literature suggests that cement enterprises can save energy through (1) shifting to blended cement (to reduce energy-intensive clinker production); (2) improving the fuel eficiency of kilns by retro-itting existing vertical shaft and rotary kilns; (3) replacing verti -cal shaft kilns with larger and more eficient rotary kilns; (4) recovering heat in the production process to generate electricity; and (5) burning alternative (waste) fuels in kilns (Galitsky and Price 2007; Soule, Logan and Stewart 2002; Worrell, Galitsky and Price 2008; Hohne et al. 2008).
These options for saving energy are well understood by the relevant institutions in China.30 The China Energy Group of the Lawrence Berkeley National Laboratory
(LBNL) at the US Department of Energy has developed a benchmarking tool that draws on these ways to save energy in cement in China (Galitsky et al. 2008), and has conducted numerous workshops there on its use. The China Energy Group of LBNL (Worrell, Galitsky and Price 2008) and the international science and technol -ogy enterprise Battelle (Soule, Logan and Stewart2002) have undertaken detailed empirical studies of these opportunities, such as shifting to blended cement and closing vertical shaft kilns, for saving energy in China’s cement industry.
30 They include the Energy Research Institute of China’s National Development and Re-form Commission (Galitsky et al. 2008); Sinoma International, the cement enterprise stud-ied by Rock and Cui (2011) (interviews, December 2011); the China Building Materials Academy (Cui et al. 2004); and the China Cement Association (interviews, December 2011).
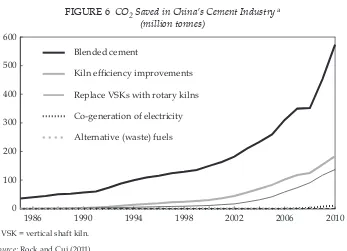
FIGURE 6 CO2 Saved in China’s Cement Industrya
(million tonnes)
1986 1990 1994 1998 2002 2006 2010
0 100 200 300 400 500 600
Blended cement
Kiln efficiency improvements
Replace VSKs with rotary kilns
Co-generation of electricity
Alternative (waste) fuels
a VSK = vertical shaft kiln.
Source: Rock and Cui (2011).
Against the background of this widespread understanding in China about how to save energy in the cement industry, what follows summarises how much CO2 was saved between 1985 and 2010. More details on each of these interventions can be found in Rock and Cui (2011). Figure 6 identiies year-by-year savings in CO2 from the energy saving interventions listed above.
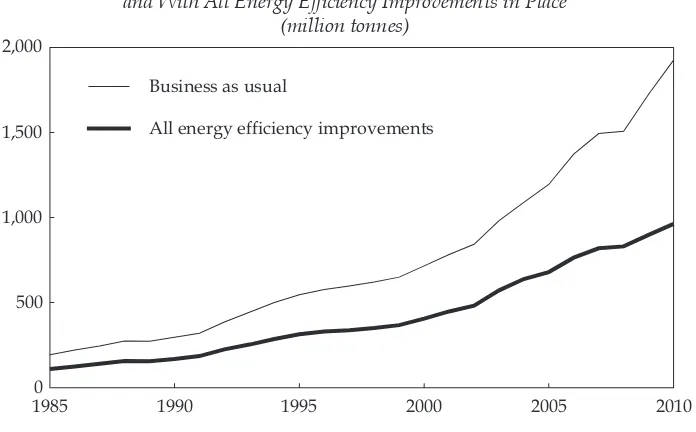
Three aspects of igure 6 are important. First, the largest single source of savings in CO2 is the shift to blended cement – by 2010, 40% of cement produced in China (745 million tonnes) was blended. This shift alone accounts for 574 million tonnes of CO2 saved, or 65% of total CO2 savings. Roughly 20% of total savings achieved between 1985 and 2010 (184 million tonnes) came from eficiency improvements in vertical shaft kilns and rotary kilns, while 15% (137 million tonnes) came from the closing of vertical shaft kilns and the switch to rotary kilns. So far, savings in CO2 from the use of alternative fuels or the co-generation of electricity have been very small. Taken together, CO2 savings made in 2010 came to 905 million tonnes. As a result of these efforts, the CO2 intensity of cement production fell from roughly 0.9 tonnes of CO2 per tonne of cement in 1985 to 0.6 tonnes of CO2 per tonne of cement in 2008 (igure 5). While the scale effect of growth has swamped the tech -nique effect (Copeland and Taylor 2003), it is clear that China has weakened the link between cement production and CO2 emissions (igure 7), resulting in CO2 savings of 962 million tonnes in 2010 over business as usual. This is an enormous sum and is 45 times as large as total CO2 emissions from cement in Indonesia. And as Rock and Cui (2011) argue, China has several remaining and signiicant opportunities to reduce CO2 emissions from cement. If adopted, they, along with a looming peak in demand for cement, might just enable near-term CO2 emissions to peak and then decline.
WHAT CAN INDONESIA LEARN FROM CHINA?
So what can Indonesia learn from China about saving CO2 in its energy-intensive industries? Given the huge differences in technological starting points in these industries, it is tempting to argue that Indonesia can learn little from China. Furthermore, Indonesia may lack the institutional and political framework that would allow it to take advantage of lessons learned from the stronger and more centralised Chinese state. Nevertheless, there are several reasons for considering what Indonesia can learn from China’s experience.
To begin with, differences in state capabilities between China and Indonesia are almost assuredly overdrawn. By one measure of institutional quality – the Political Risk Group’s International Country Risk Guide – the Indonesian bureau -cracy is no worse than the Chinese.31 As Lipsey and Sjöholm (2011: 44) note,
China, Indonesia, Vietnam and the Philippines all share relatively high levels of corruption, so there may not be much difference there either. By yet a third measure – the World Bank’s ‘trading across borders’ variable, reported in its
31 This source rates a country’s bureaucratic quality on a scale from weak (0) to strong (4). Between 1998 and 2010 Indonesia’s average bureaucratic quality score was 2.16, while China’s was 2.0 (<http://www.prsgroup.com/icrg.aspx>).
2009 Doing Business survey – Indonesia and China are closely ranked at 45th
and 44th in terms of documents, time and money required to export and import
(Lipsey and Sjöholm 2011: 56).
Sceptics who have watched Indonesia gain democracy at the expense of effec -tive government (McLeod 2005) probably wonder whether these ratings tell us much. But this comparison is not likely to surprise China experts, who know that administrative decentralisation before and after reform, alongside a balkanisa -tion of policy making, has contributed to a signiicant number of bureaucratic pathologies – blocked leadership, minority veto and control by the organised – that undermine policy making and policy implementation (Lardy 1978; Naughton 1992; Lieberthal and Lampton 1992). As is equally well known, policy making in China is characterised by intense bargaining among ministries and levels of gov -ernment (Lampton 1992: 34, 37). This contributes to a race to the bottom and to the outright stymying of central government objectives (Naughton 1992: 254). Bar -gaining over policies in China has been shown to slow decision making; to make it dificult to know when a decision has been taken; and to distort implementation (Lampton 1992: 57–8).
There are several examples of how bureaucratic bargaining has played out in the reform of China’s cement industry. In some places, local governments have thwarted central oficials by refusing to close small, technologically back -ward cement plants that contribute to local revenues and employment (Rock and Cui 2011). Other local governments have frustrated central oficials’ efforts to create a small number of large national champions in cement, by supporting the development of local champions that compete with the national champions (Rock and Cui 2011). Similar stories can be told about China’s iron and steel industry, where the central government’s efforts to rationalise and restructure FIGURE 7 CO2 Emissions from China’s Cement Industry under ‘Business as Usual’
and With All Energy Eficiency Improvements in Place (million tonnes)
1985 1990 1995 2000 2005 2010
0 500
1,000 1,500 2,000
Business as usual
All energy efficiency improvements
Source: Rock and Cui (2011: 53).
the industry have routinely been obstructed by local governments (Abrami and Zheng 2010).32
Differences between China and Indonesia in the technologies underlying par -ticular industries such as cement, iron and steel, aluminium and pulp and paper may also be less important than they seem. The key distinguishing factors sepa -rating China’s cement industry from Indonesia’s have little to do with technology differences such as China’s early reliance on vertical shaft kilns and Indonesia’s reliance, at least since 1965, on more modern rotary kilns; they have much more to do with fundamental differences in the policies and institutions, particularly technology institutes and R&D institutes, affecting enterprises.
Policies and institutions affecting the cement industry in Indonesia are inward looking; they coddle and protect irms by setting prices and allowing irms to collude and divide up markets. In such an environment, there is little incen -tive for irms to become more eficient, technologically upgrade, save energy or increase exports. All of this may have been exacerbated by Indonesia’s continued provision of energy subsidies and by the behaviour of the OECD cement multi -nationals, which appear to be acting like a cartel, dividing up the Southeast Asian market for cement and driving up prices.
Policies and institutions affecting the broader economy and the cement indus -try in China could not be more different. To begin with, they are outward rather than inward looking (see footnotes 5 and 6). China’s outward-looking policies promote exports, stimulate domestic competition and expose cement enterprises to new technologies and ideas. In addition, at least since the 1990s, China’s indus -trial development strategy has focused on technological catch-up. This requires investments in science, technology and engineering, something at which China excels. It requires reform of public sector technology support institutions to make them more responsive to market demands. By cutting inancial support to these institutions, China has demonstrated that it is serious about this kind of reform.
There is little evidence that Indonesia is moving in this direction. To do so requires raising public sector investment in research and development. This, too, China has done, while Indonesia has not. It requires closing ineficient enterprises or allowing them to close as market conditions change. China allowed and allows this to happen. Technological upgrading involves persuading enterprises and industries to import, adopt, adapt and disseminate state-of-the-art technologies in particular industries. China has done this, while there is little evidence of such efforts in Indonesia. To achieve this, enterprises, research institutes and universi -ties need to be linked in a long-run technological learning program. Much of the Chinese cement industry is state of the art, because China’s major cement enter -prises, cement research and design institutes and technology support institutes have been linked in a technological learning program (Rock and Cui 2011). This strategy has enabled the Chinese cement industry’s peak research and design institutes to capture a large share of the market for new cement plants in China
32 Local government opposition to mergers and acquisitions thwarted attempts to create a small number of large vertically integrated national champions in iron and steel. Central government efforts to negotiate long-term price contracts with foreign iron ore suppli-ers were frustrated by local governments who cut their own deals with these supplisuppli-ers (Abrami and Zheng 2010: 23–5).
and the world. There is little evidence suggesting anything similar in Indonesia’s cement industry. Technological catch-up also requires exposing domestic enter -prises to the rigours of foreign competition. Because of this requirement, policy makers in China unilaterally liberalised its trade and investment regime as much as, if not more than, their Indonesian counterparts did.33
China has also learned that saving energy in energy-intensive industries requires liberalising prices for key inputs such as coal, petrol and electricity, so that irms are forced to learn how to economise on increasingly expensive energy inputs. And the Chinese have learned that energy saving in energy-intensive industries can be expedited by adopting quantitatively measurable and time-bound goals and holding local governments and enterprises accountable for per -formance relative to those goals.34 Sometimes enterprise and local government
performance relative to goals is publicly disclosed. While there is no evidence yet that Indonesia is moving in this direction, China’s energy saving program looks surprisingly similar to Indonesia’s long-standing Program for Pollution Control, Evaluation and Rating (PROPER), launched in 1995 (García, Sterner and Afsah 2007). So here, too, Indonesia can learn from China, perhaps by adapting PROPER to the saving of energy and CO2.
In sum, smaller differences in bureaucratic capabilities and larger differences in policies and institutions provide ample opportunity for Indonesia to structure its emerging industrial energy eficiency program around the core elements of China’s energy saving activities in energy-intensive industries. Four aspects of China’s program in particular are likely to help Indonesia reduce CO2 emissions. First, because opportunities to save energy and reduce CO2 emissions are techno -logically constrained by the characteristics of particular industries, energy saving activities must be industry speciic. Second, it is critical to get energy prices right by removing subsidies to energy, and it is useful to adopt clear, time-bound and measurable goals for improving energy eficiency and holding enterprises and local governments accountable for performance relative to goals. Third, adopt -ing an outward and competitive policy stance that exposes domestic and multi -national irms to the rigours of competition, new technologies and new ideas also matters. Finally, tethering each of these elements to a long-run goal of high-speed technological catch-up in energy-intensive industries is likely to be essential to success.
High-speed technological catch-up requires heavy investments in science and engineering education; substantial increases in public sector research and
33 In 1982, China’s average tariff level for all imports was 56%; in 1992 it was 43%. In 1999 this fell to 15% for all imports and to 8.9% for imports of manufactures (Branstetter and Lardy 2008: 634–5 and 650–1). In addition, as part of its accession to the World Trade Organization, China agreed to eliminate all import quotas, import licences and NTBs, and these obligations have by and large been met (Branstetter and Lardy (2008: 650–1). While Indonesia’s average tariff rate is equally low, NTBs and price controls are widespread, and some local governments have created their own customs agencies (Basri and Hill 2008: 1,402–4).
34 Under China’s energy saving program, provincial governors sign ive-year energy in-tensity reduction contracts with the central government and with large enterprises within their jurisdictions.
development; reform of public sector technology support institutions; and the building of productive linkages between irms, research institutes and univer -sities in particular industries. Indonesia should therefore consider doing these things too, especially since they are likely to have large pay-offs in other areas.
REFERENCES
Abrami, R. and Zheng, Y. (2010) ‘The new face of Chinese industrial policy: making sense of anti-dumping cases in the petrochemical and steel industries’, Harvard Business School Working Paper No. 11-042, Cambridge MA.
AIRD (Agency for Industrial Research and Development, Ministry of Industry) (2009) Mit-igation Approach for Industry Sector, AIRD, Jakarta.
Auty, R.M. (1990) Resource Based Industrialization: Sowing the Oil in Eight Less Developed Countries, Oxford University Press, Oxford.
Barr, C.M. (1998) ‘Bob Hasan, the rise of Apkindo, and the shifting dynamics of control in Indonesia’s timber sector’, Indonesia 65: 1–36.
Basri, M.C. and Hill, H. (2008) ‘Indonesia – trade policy review 2007’, The World Economy 31 (11): 1,393–408.
Bird, Kelly (2004) ‘Recent trends in foreign direct investment’, in Business in Indonesia: New Challenges, Old Problems, eds M. Chatib Basri and Pierre van der Eng, Institute of South-east Asian Studies, Singapore: 93–107.
BPS (Badan Pusat Statistik, Central Statistics Agency) (2005) Statistics of Indonesian Industry 2005: Survey of Large and Medium Business, BPS, Jakarta.
Brandt, L., Rawski, T.G. and Sutton, L. (2008) ‘China’s industrial development’, in China’s Great Economic Transformation, eds L. Brandt and T.G. Rawski, Cambridge University Press, New York NY: 569–632.
Branstetter, L. and Lardy, N. (2008) ‘China’s embrace of globalization’, in China’s Great Economic Transformation, eds L. Brandt and T.G. Rawski, Cambridge University Press, New York NY: 633–82.
Bresnan, J. (1993) Managing Indonesia, Columbia University Press, New York NY.
Copeland, B.R. and Taylor, M.S. (2003) Trade and the Environment: Theory and Evidence, Princeton University Press, Princeton NJ.
Cui, Y. (2009) China’s cement sector today and prospect, Presentation at Cement Sustain-ability Initiative, Beijing, 16–17 November.
Cui, Y., Fu, L., Rong, P., Li, Q., Li, Y., Shen, W., Lie, Q., Li, T., Qin, Z., Ding, K., Cong, P. and Li, H. (2004) ‘Final Report on Cement Sub-sector Survey’, Report to United Nations Industrial Development Organization (UNIDO) for the project ‘Energy Conservation and GHG Emissions Reduction in Chinese TVEs – phase II’, Contract No. 03/032/ML, P.O. No. 16000393, Institute of Technical Information for Building Materials Industry (ITIBMI), Beijing.
Dewan Nasional Perubahan Iklim (National Council on Climate Change) (2010) ‘Indo-nesia’s Greenhouse Abatement Cost Curve’, Jakarta.
Elson, R. (2001) Suharto: A Political Biography, Cambridge University Press, Cambridge. Fisher-Vanden, K., Jefferson, G., Liu, H. and Tao, Quan (2004) ‘What is driving China’s
decline in energy intensity?’, Resource and Energy Economics 26: 77–97.
Fisher-Vanden, K., Hu, Y., Jefferson, G. and Rock, M.T. (2011) Factors inluencing energy intensity in four Chinese industries, Paper prepared for the Environment and Energy Group, Development Research Group, World Bank, Washington DC.
Galitsky, C. and Price, L. (2007) ‘Opportunities for improving energy eficiency, reducing pollution and increasing economic output in Chinese cement kilns‘, Proceedings of the ACEEE (American Council for an Energy-Eficient Economy) Summer Study on Energy Eficiency in Industry, American Council for An Energy Eficient Economy,
Berkeley, CA, available at <http://china.lbl.gov/publications/opportunities-improv-ing-energy-eficiency-reducing-pollution-and-increasing-economic-ou>.
Galitsky, C., Price, L., Zhou, N., Zhou, F., Xiong, H. and Zeng, X. (2008) Guidebook for Using the Tool BEST Cement: Benchmarking and Energy Savings Tool for the Cement Industry, Lawrence Berkeley National Laboratory, Berkeley CA, and Energy Research Institute, Beijing, available at <http://china.lbl.gov/research/industry/best-cement-china>. García, J.H., Sterner, T. and Afsah, S. (2007) ‘Public disclosure of industrial pollution: the
PROPER approach of Indonesia’, Environment and Development 12: 739–56.
GTZ (Deutsche Gesellschaft für Technische Zusammenarbeit, German Technical Coopera-tion) (2009) Greenhouse Gas Emissions Released by the Manufacturing Industries in Java, GTZ on behalf of the Ministry of Economic Cooperation and Development (BMZ), Jakarta. Gu, S., Lundvall, B., Liu, J., Malerba, F. and Serger, S.S. (2009) ‘China’s system and vision
of innovation: an analysis in relation to the Strategic Adjustment and the Medium and Long-Term S&T Development Plan (2006–20)’, Industry and Innovation 16 (4–5): 369–88. Guan, J.C., Yam, R.C.M. and Mok, C.K. (2005) ‘Collaboration between industry and research
institutes/universities on industrial innovation in Beijing, China’, Technology, Analysis, and Strategic Management 17 (3): 339–53.
HeidelbergCement (2011) Annual Report 2010, HeidelbergCement, Heidelberg, available at <http://www.heidelbergcement.com/NR/rdonlyres/0AFACA2F-2EE0-4DB0-8171-3DCAC1491AD6/0/GB_2010_E_Web_Links.pdf>.
Hill, H. (1986) Foreign Investment and Industrialization in Indonesia, Oxford University Press, Oxford.
Hill, H. (1995) ‘Indonesia’s great leap forward: technology development and policy issues’, Bulletin of Indonesian Economic Studies 31 (2): 83–123.
Hofman, B., Zhao, M. and Ishihara, Y. (2007) ‘Asian development strategies: China and Indonesia compared’, Bulletin of Indonesian Economic Studies 43 (2): 171–200.
Hohne, N., Worrell, E., Ellerman, C., Vieweg, M. and Hageman, M. (2008) Sector approach and development: Input for workshop – Where development meets climate – Devel-opment related mitigation options for a global climate change agreement, ECOFYS Group, Utrecht, for the Netherlands Environmental Assessment Agency.
Hoidalen, O. (2004) Presentation to CTI/Industry joint seminar on technology diffusion in ASEAN and small island states of the Paciic region, Hotel Nikko, Jakarta, 4–5 February.
Hu, A.G.Z. and Jefferson, G.H. (2008) ‘Science and technology in China’, in China’s Great Economic Transformation, eds L. Brandt and T.G. Rawski, Cambridge University Press, New York NY: 286–336.
IEA (International Energy Agency) (2007) Tracking Industrial Energy Eficiency and CO2
Emissions, IEA, Paris, available at <www.iea.org/textbase/nppdf/free/2007/track-ing_emissions.pdf>.
Kang, X. (2007) Overview of China’s cement industry, China Cement Association, Beijing. Lampton, D. (1992) ‘A plum for a peach: bargaining, interest and bureaucratic politics in
China, in Bureaucracy, Politics and Decision Making in Post-Mao China, eds K.G. Lieber-thal and D.M. Lampton, University of California Press, Berkeley CA: 33–58.
Lardy, N. (1978) Economic Growth and Distribution in China, Cambridge University Press, New York and London.
Lieberthal K.G. and Lampton, D.M. (eds) (1992) Bureaucracy, Politics and Decision Making in Post-Mao China, University of California Press, Berkeley CA.
Ligthart, A. (2003) The cement industry in China: present structure, restructuring pro-gramme, opportunities, PowerPoint presentation, INTERCEM Workshop, ‘Today’s Challenges, Tomorrow’s Opportunities’, 25 June, London.
Lipsey, R.E. and Sjöholm, F. (2011) ‘Foreign direct investment and growth in East Asia: les-sons for Indonesia’, Bulletin of Indonesian Economic Studies 47 (1): 35–63.
Lu, Q. (2003) China’s Leap into the Information Age, Oxford University Press, Oxford. Maarif, S. (2001) Competition law and policy in Indonesia, Report as Part of ASEAN
Com-petition Law Project, Jakarta, Draft, 28 March, mimeo.
MacIntyre, A. (1993) ‘The politics of inance in Indonesia: command, confusion, and com-petition’, in The Politics of Finance in Developing Countries, eds S. Haggard, C.H. Lee and S. Maxield, Cornell University Press, Ithaca NY: 123–64.
McKendrick, D. (1992) ‘Obstacles to “catch-up”: the case of the Indonesian aircraft indus-try’, Bulletin of Indonesian Economic Studies 28 (1): 39–66.
McLeod, R.H. (2005) The struggle to regain effective government under democracy in Indonesia, Bulletin of Indonesian Economic Studies 41 (3): 367–86.
Ministry of Finance and National Council on Climate Change (2009) Emissions Reduction Opportunities and Policies: Manufacturing Sector, Ministry of Finance and National Coun-cil on Climate Change, Jakarta, available at <http://www.esmap.org/esmap/sites/ esmap.org/iles/Tech Report - Manufacturing Nov 09.pdf>.
Naughton, B. (1992) ‘Hierarchy and the bargaining economy: government and enterprise in the reform process’, in Bureaucracy, Politics and Decision Making in Post-Mao China, eds K.G. Lieberthal and D.M. Lampton, University of California Press, Berkeley CA: 245–82.
Naughton, B. (2003) ’Government reorganization: Liu Mingkang and inancial restructur-ing’, China Leadership Monitor 7, available at <http://www.hoover.org/publications/ china-leadership-monitor/article/7424>.
Perkins, D. (ed.) (1977) Rural Small Scale Industry in the People’s Republic of China, University of California Press, Berkeley CA.
Plunkett, H.J., Morgan, W.E. and Pomeroy, J.L. (1997) ‘Regulation of the Indonesian cement industry’, Bulletin of Indonesian Economic Studies 33 (1): 75–102.
Prasetiantono, T. (2004) ‘Political economy of privatisation of state-owned enterprises in Indonesia’, in Business in Indonesia: New Challenges, Old Problems, eds M. Chatib Basri and Pierre van der Eng, Institute of Southeast Asian Studies, Singapore: 141–57. Price, L., Wang, X. and Yun, J. (2008) ‘China’s top-1000 energy-consuming enterprises
pro-gram: reducing energy consumption of the 1000 largest industrial enterprises in China’, Paper No. LBNL-519E, Lawrence Berkeley National Laboratory, Berkeley CA.
Prybyla, J.S. (1970) The Political Economy of Communist China, International Textbook Co., Scranton PA.
Republic of Indonesia (2009) Indonesia Climate Change Sectoral Roadmap (ICCSR): Synthesis Report, Jakarta.
Resosudarmo, B.P., Jotzo, F., Yusuf, A.A. and Nurdianto, D.A. (2011) ‘Challenges in miti-gating Indonesia’s CO2 emission: the importance of managing fossil fuel combustion’, CCEP Working Paper No. 1108, Centre for Climate Economics and Policy, Crawford School of Economics and Government, Australian National University, Canberra. Robison, R. (1986) Indonesia: The Rise of Capital, Allen and Unwin, Sydney.
Rock, M.T. and Cui, Y. (2011) Evolving landscape and shifting socio-technical regimes: sus-tainability of China’s cement industry, Paper presented at IHDP Conference on Indus-trial Transformation, Urbanization, and Human Security in the Asia Paciic, Taipei, 14–15 January 2011.
Rock, M.T., Kejun, J. and He, C. (2011) Energy and CO2 intensity in China’s iron and steel industry, Paper prepared for the Environment and Energy Group, Development Research Group, World Bank, Washington DC.
Rock, M.T. and Song, Y. (2011) Energy eficiency and CO2 emissions in China’s pulp and paper industry, Paper prepared for the Environment and Energy Group, Development Research Group, World Bank, Washington DC.