In the case of Amazonia, where commercial agriculture expansion is responsible for over two-thirds of deforestation and forest degradation2, the loss of forests and the vital ecosystem services that they provide have widespread implications for the longer-term prosperity and resilience of the region. It is predicted that large-scale deforestation, beyond driving GHG emissions and biodiversity loss, could reduce rainfall by up to 21% in Amazonia by 2050 and affect the basin’s vital role in purifying and regulating water lows on which agricultural and energy production, transportation, as well as health and livelihoods of millions of people depend on.3 Such threats overlap with many different areas of policymaking and private sector activity.
As the global demand for agricultural commodities continues to grow4, private sector companies and inancial investors will play a central role, alongside government, in determining the fate of tropical forests. Private sector actors are already gaining a stronger understanding of the reputational, legislative and operational risks of exposure to deforestation, and the business case for the transition to demonstrably legal and sustainable commodities in their procurement, supply chains and investments. This is relected by the multitude of government- and industry-led5 policies and commitments, such as the New York Declaration on Forests and the Brazil soy moratorium, that seek to decouple agricultural production from deforestation impacts. However, these commitments are fragmented across different jurisdictions and actors, falling far short of the kind of uniied and more systematic approach needed to transition to more sustainable production landscapes.
This brief draws on innovative trade-low modelling and analysis for three key agricultural supply chains in the Amazon region – soy in Brazil, palm oil in Peru and beef in Colombia - alongside multi-stakeholder interviews and group discussions to: (1) explore the role of supply chain transparency modelling tools in transforming agricultural commodity production; and (2) discuss some of the challenges (trade-offs and barriers) and opportunities for implementing more sustainable productive landscapes in the Amazon region.
Decoupling agricultural commodity supply
chains from deforestation in Amazonia
Agricultural commodity supply chains - such as beef, soy and palm oil - are a multi-billion-dollar segment of the global economy, driving development in many tropical forest jurisdictions1. However, the production of these commodities is linked to signiicant social and environmental impacts and risks.
COMMODITY SUPPLY CHAINS
IN AMAZONIA
Key points
• Safeguarding and sustainably managing natural resources in Amazonia is a complex issue that will require marshalling coalitions of public and private actors that have a shared stake in responsible management of the same production landscapes.
• Complex and obscure supply chains mean that key upstream actors who need to be engaged and accountable remain hidden.
• By building effective coalitions of supply chain actors who can work together alongside regional and national governments in producer nations, it becomes possible to lower costs and distribute responsibilities more fairly and appropriately.
• There is an opportunity to advance transparency in the face of improved supply chain modelling instruments and increasingly sensitive markets and
inance institutions demanding better environmental
and social performance of key commodity supply chains.
• Increased transparency and accountability in supply chains can support the transition to more sustainable production systems in Amazonia, but ultimately this requires strong and closely aligned leadership from both the public and private sector.
© a
b
a
d
o
n
ia
• 2 Improving Sustainable Commodity Supply Chains in Amazonia Improving Sustainable Commodity Supply Chains in Amazonia • 3
Increasing supply chain transparency in
production landscapes
Ensuring and measuring progress towards sustainability is linked to the capacity to monitor and track commodity production and supply chain lows. The visualisation of international supply chains presented here provides a snapshot of a novel approach linking speciic jurisdictions in Brazil, Colombia and Peru to a variety of actors along the supply chains. It combines6:
1. Consistent country-wide data on commodity production at the sub-national (e.g. municipal);
2. Per shipment customs data detailing the involvement of all traders;
3. Bilateral trade matrices to describe trade lows of a given commodity covering all companies and production regions within that country.
This approach enhances monitoring capacity by identifying - to the level of municipalities – where traders are sourcing their given commodities from, and allows us to view the connections between different actors and locations across broad regions like the Amazon.
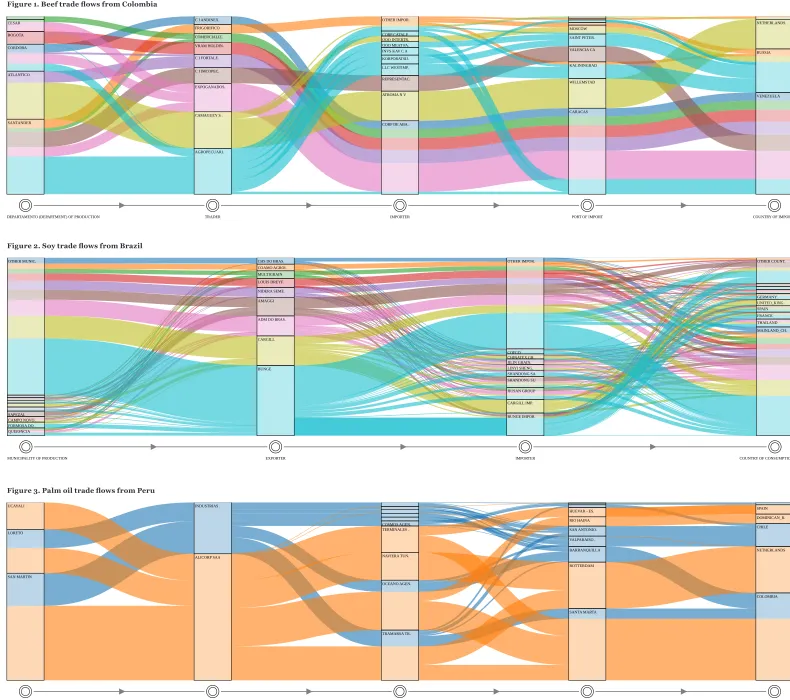
The trade-lows shown in Figures 1-3 illustrate, for the irst time, the connections between individual regions of production (municipalities in the case of Brazil and departments for Peru and Colombia), via speciic named exporters, importers and ports of import to the country of irst consumption (after accounting for re-exports). Different colours illustrate the material lows of soy, beef, and palm oil that were produced in the different regions (also see map in Figure 4.), with each low being comprised – depending on the commodity and region - of hundreds to hundreds of thousands of individual supply chain links.
The central innovation of this approach is to identify, and start to unlock the potential for, a “middle-ground” approach to assessing the sustainability of commodity supply chains7. This middle-ground approach balances detail and scale of supply chain transparency information to prioritize understanding the connections between downstream actors and jurisdictions of production for the entire trade in a given commodity, such as soy or palm oil, rather than zooming in on a speciic supply chain at the expense of understanding the bigger picture.
Innovations in supply chain modelling, coupled with the growing availability of trade and deforestation datasets, have the potential to dramatically improve transparency and accountability across supply chains in the Amazon by making visible the full consortium of actors and beneiciaries in the production of agricultural commodities, essentially demystifying associations between producers and source jurisdictions, and key downstream actors, such as traders and retailers.
Figure 3. Palm oil trade lows from Peru Figure 2. Soy trade lows from Brazil Figure 1. Beef trade lows from Colombia
VENEZUELA RUSSIA NETHERLANDS. OTHER IMPOR. CARACAS WILLEMSTAD KALININGRAD VALENCIA CA SAINT PETER. MOSCOW
CORP DE ABA. ATROMA N V REPRESENTAC. LLC WESTIMP. KORPORATSIJ. INVS KAV C A OOO MEAT FA. OOO INTERTR. CORP CATALP.
AGROPECUARI. CAMAGUEY S . EXPOGANADOS. C I IMCOPEC. C I FORTALE. VRAM HOLDIN. COMERCIALIZ. FRIGORIFICO. C I ANDINEX.
SANTANDER ATLANTICO CORDOBA BOGOTA CESAR
DEPARTAMENTO (DEPARTMENT) OF PRODUCTION TRADER IMPORTER PORT OF IMPORT COUNTRY OF IMPORT
COLOMBIA NETHERLANDS CHILE DOMINICAN_R. SPAIN SANTA MARTA ROTTERDAM BARRANQUILLA VALPARAISO . SAN ANTONIO. RIO HAINA HUEVAR - ES.
TRAMARSA TR. OCEANO AGEN. NAVIERA TUN. TERMINALES . COSMOS AGEN. ALICORP SAA INDUSTRIAS . SAN MARTIN LORETO UCAYALI
DEPARTAMENTO (DEPARTMENT) OF PRODUCTION TRADER SHIPPER PORT OF IMPORT COUNTRY OF IMPORT
MAINLAND_CH. THAILAND FRANCE SPAIN UNITED GERMANY OTHER COUNT. OTHER MUNIC. OTHER IMPOR.
BUNGE IMPOR. CARGILL IMP. JIUSAN GROUP SHANDONG SU. SHANDONG SA. LINYI SHENG. JILIN GRAIN. CHINATEX GR. COFCO BUNGE CARGILL ADM DO BRAS. AMAGGI NIDERA SEME. LOUIS DREYF. MULTIGRAIN COAMO AGROI. CHS DO BRAS.
QUERêNCIA FORMOSA DO . CAMPO NOVO . SAPEZAL
Sources:
Beef: Instituto Colombiano Agropecuario (ICA);
Palm Oil: Plan Nacional de Palma 2000-2010;
Soy: Companhia Nacional de Abastecimento (CONAB), Instituto Brasileño de Geografía y Estadística (IBGE)
Figure 4. Map of key production areas for beef in Colombia, soy in Brazil and palm oil in Peru.
Linking supply chain actors to Amazonia’s
production landscapes
By linking different actors to particular locations through these new approaches to supply chain transparency, it becomes possible to scan levels of risk exposure (e.g. reputational and operational risks related to forest loss) that face different supply chain actors across entire regions, and identify priority places and groups of actors where intervention is most urgently needed. Knowing these priorities can transform our understanding of where, and with whom, efforts to improve the sustainability of production landscapes should be focussed on, and which actors could form coalitions that are capable of making the desired changes possible.
However, models and trade data only show current dynamics and fail to truly understand the incentives and regulatory context of each country which only deeper analysis can offer. Further work is needed on multiple fronts to really unlock the potential of supply chain transparency and drive improvements in accountability for responsible governance of natural resources8.
There are at least four main challenges that need to be overcome to operationalize at scale the kind of supply-chain mapping presented here9: the inancial recourses and capacity required; the mapping of domestic supply chains for commodities that are increasingly consumed locally (e.g. Brazilian beef); the ability to track the potential displacement of deforestation (i.e. leakage) and indirect effects; and the coupling of supply chain mapping data with data on environmental and social impacts in regions of production.
Conclusion
Better transparency is merely a key pre-condition for improved supply chain governance. More sustainable agricultural commodity supply chains will require building a broad coalition of beneiciaries/actors in the same production landscapes; pitching growers, local governments, traders, buyers and investors as having a shared stake and role in the long-term sustainability of Amazonia.
Production systems require innovation, adaptability and resilience in the face of growing resource scarcity and climate change; blanket transparency will be fundamental to identify further risks and prioritise action across the board and build momentum towards sustainable development and environmental goals.
By building effective coalitions of supply chain actors who can work together alongside regional and national governments in producer nations it becomes possible to lower costs and distribute responsibilities more fairly and appropriately. The unprecedented opportunity presented by recent zero deforestation commitments from private and public actors in response to rapidly depleting tropical forests means that this work could not be more urgent.
Authors:
David Sabogal Toby Gardner Simone Bauch Helen Bellield Javier Godar Clement Suavet
Acknowledgements:
This brief was produced by the Global Canopy Programme and the Stockholm Environment Institute as part of the Amazonia Security Agenda.
To ind out more about the project and further publications click here.
This document is an output from a project commissioned through the
Climate and Development Knowledge Network (CDKN). CDKN is a programme funded by the UK Department for International Development
(DFID) and the Netherlands Directorate-General for International
Cooperation (DGIS) for the beneit of developing countries. The views
expressed and information contained in it are not necessarily those of or endorsed by DFID, DGIS or the entities managing the delivery of the
Climate and Development Knowledge Network, which can accept no responsibility or liability for such views, completeness or accuracy of the
• 6 Improving Sustainable Commodity Supply Chains in Amazonia Improving Sustainable Commodity Supply Chains in Amazonia • 7
References & comments
1
SEI, GCP. 2015. Transformative Transparency:
Harnessing the power of data for supply chain
sustainability. Stockholm Enviornment Institute;
Global Canopy Programme. Available at: https://
www.sei-international.org/mediamanager/
documents/Publications/NEW/SEi-GCP-DB-TransformativeTransparency.pdf
2
Geist, H. and E. Lambin. 2002. Proximate Causes and
Underlying Driving Forces of Tropical Deforestation.
Bioscience, 52(2): pp.143–150; Kissinger, G. M.
Herold & V. De Sy. 2002. Drivers of Deforestation
and Forest Degradation: A Synthesis Report for
REDD+ Policymakers. Lexeme Consulting, Vancouver
Canada; Lawson, S., A. Blundell, B. Cabarle, N. Basik,
M. Jenkins, & K. C. Consumer. 2004. Goods and
Deforestation: An Analysis of the Extent and Nature
of Illegality in Forest Conversion for Agriculture and
Timber Plantations. Forest Trends. Available at: http://
www.forest-trends.org/documents/iles/doc_4718.pdf
3
Mardas, N., Bellield, H., Jarvis, A., Navarrete, C.
& Comberti, C. 2013 Amazonia Security Agenda:
Summary of Findings and Initial Recommendations.
Global Canopy Programme and International Center
for Tropical Agriculture http://segamazonia.org/sites/
default/iles/amazonia_security_agenda.pdf
4
By 2050, worldwide demand for agricultural products
is expected to increase by more than 50% . McFarland,
W. S. Whitley and G. Kissinger. 2015. Subsidies to
key commodities driving forest loss: Implications
for private climate inance. Overseas Development
Institute: London, UK. Available at: http://www.odi.
org/sites/odi.org.uk/iles/odi-assets/publications-opinion-iles/9577.pdf).
5
Groupe Danone, Kao Corp., Nestlé S.A., Procter &
Gamble, Reckitt Benckiser Group, and Unilever for
example are leading private sector company efforts
to address deforestation in their supply chains
(Forest500.org).
6
Godar, J., Persson, U.M., Tizado, E.J., Meyfroidt,
P. 2015. Towards more accurate and policy relevant
footprint analyses: Tracing inescale
socio-environmental impacts of production to consumption.
Ecological Economics 112: 25–35.
7
Godar, J., C. Suavet, T.A. Gardner, E. Dawkins, P.
Meyfroidt. 2016. Balancing detail and scale in assessing
transparency to improve the governance of agricultural
commodity supply chains. Environ. Res. Lett. 11,
35015. doi:10.1088/1748-9326/11/3/035015
8
Data can also be expensive to obtain and patchy/
incomplete and decentralised which pose further
limitations. Also, while current model depicts
export markets, a lot of consumption happens
locally, demanding a iner scale of analysis still to be
developed.
9
Godar et al. 2016.
©B
ra
si