IDENTIFYING THE LOCAL SURFACE URBAN HEAT ISLAND THROUGH THE
MORPHOLOGY OF THE LAND SURFACE TEMPERATURE
Jiong Wang a, b, *, Qingming Zhan a, b, Yinghui Xiao a, b
a School of Urban Design, Wuhan University, 8 Donghu South Road, Wuhan 430072, China - [email protected]; b Collaborative Innovation Centre of Geospatial Technology, 129 Luoyu Road, Wuhan 430079, China - [email protected]
Commission WG II/3 - Spatial Analysis and Data Mining
KEY WORDS: land surface temperature, local scale, heat island, morphology
ABSTRACT:
Current characterization of the Land Surface Temperature (LST) at city scale insufficiently supports efficient mitigations and adaptations of the Surface Urban Heat Island (SUHI) at local scale. This research intends to delineate the LST variation at local scale where mitigations and adaptations are more feasible. At the local scale, the research helps to identify the local SUHI (LSUHI) at different levels. The concept complies with the planning and design conventions that urban problems are treated with respect to hierarchies or priorities. Technically, the MODerate-resolution Imaging Spectroradiometer satellite image products are used. The continuous and smooth latent LST is first recovered from the raw images. The Multi-Scale Shape Index (MSSI) is then applied to the latent LST to extract morphological indicators. The local scale variation of the LST is quantified by the indicators such that the LSUHI can be identified morphologically. The results are promising. It can potentially be extended to investigate the temporal dynamics of the LST and LSUHI. This research serves to the application of remote sensing, pattern analysis, urban microclimate study, and urban planning at least at 2 levels: (1) it extends the understanding of the SUHI to the local scale, and (2) the characterization at local scale facilitates problem identification and support mitigations and adaptations more efficiently.
* Corresponding author
1. INTRODUCTION
The global temperature continues rising while cities may possess higher warming rates than natural land covers (Stone et al., 2012a). The phenomenon of higher temperature in urban areas is known as the Urban Heat Island (UHI) (Manley, 1958). The magnitude of the UHI can be up to 12℃ under calm and down to investigate the LST within the UCL, UHI accordingly became the Surface Urban Heat Island (SUHI). Satellite images are often applied in the studies of the LST (Voogt and Oke, 2003). These studies fall into three categories: (1) patterns and causes of the LST (Hale et al., 2008; Rajasekar and Weng, 2009), (2) the relationship between the LST and air temperature (Schwarz et al., 2012), and (3) the energy balance regime of land surface (Anderson et al., 2008; Holzman et al., 2014; Zhan and Kustas, 2001). With the development and sophistication of the LST characterization, most studies were carried out in the first category. Further understanding of the phenomenon at local scale is impeded by limited parameters
(Oke, 1982; Schwarz et al., 2012; Weng, 2009). The investigations are largely influenced by the conventional
“urban-rural” dichotomy at the city scale (Stewart and Oke, 2009; Stewart, 2011). A milestone is the characterization of the city scale SUHI of Houston, Texas, USA by applying the unimodal Gaussian surface to the fitting of the Advanced Very High Resolution Radiometer (AVHRR) image data (Streutker, 2002). An extension of the methodology is employing the non-parametric kernel method to model the LST and SUHI patterns in Indianapolis, Indiana, USA (Rajasekar and Weng, 2009).
1.2 The Mitigation and Adaptation Inefficiency
While researches continue to delineate the pattern of the LST by trying varies models, planning and design professionals can nevertheless benefit enough from such city scale studies. Failure of the applying the research findings to the planning domain is prominent in 2 ways. These are strategic misalignment and the corresponding negative consequences. Firstly, most cities are reported to be without any from of regulation for temperature mitigation in terms of land surface management (Betsill and Rabe, 2009; Wheeler, 2008). Even at the local level, some climate action plans only insufficiently addressed the problem by considering the greenhouse gas emission control (Stone et al., 2012b). Secondly, tragic socio-economic consequences of the urban heat events have only become realized and addressed lately. Over 15,000 people in France were killed during the summer Excessive Heat Event (EHE) in 2003 (Valleron and Boumendil, 2004), Arizona led the deaths due to heat exposure in the United States from 1993 to 2002 (Control and Prevention, 2005), these numbers are expected to increase in the near future (Kalkstein et al., 2009). ISPRS Annals of the Photogrammetry, Remote Sensing and Spatial Information Sciences, Volume III-2, 2016
1.3 This Research
As the major discrepancy lies between the scope of temperature research and the level of mitigations are practically conducted, this research intends to investigate the LST pattern at the local scale. Through the process, more parameters are derived to characterize the LST pattern. The research claims that the LST as one of the geographic phenomenon, the spatial and morphological information should explicitly be included. The research first presents how morphological parameters can be derived through applying the Multi-Scale Shape Index, and the robust of the algorithm. The research then uses the parameters as indicators to identify the Local Surface Urban Heat Island (LSUHI).
Specifically, MODerate-resolution Imaging Spectroradiometer (MODIS) data is used to obtain the latent LST pattern at the beginning. The research then applies the Multi-Scale Shape Index to the latent LST patterns. The deformations are analyzed at their optimal scales. The LSUHIs meet some particular
criteria are finally extracted. The techniques are discussed in the following section.
2. METHODOLOGY
2.1 Study Area and Data
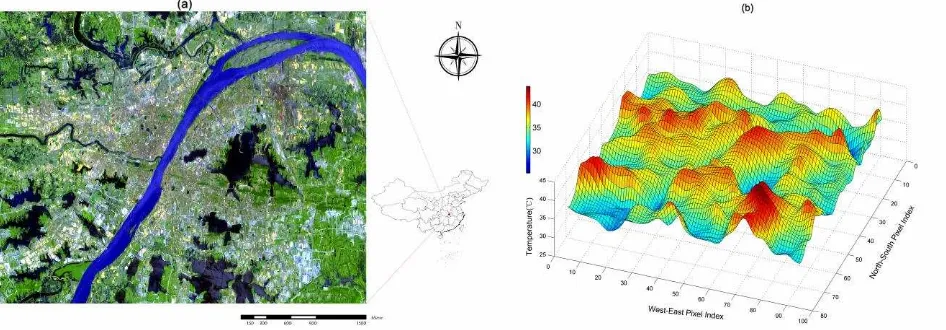
Wuhan, China is selected for case study. The city is located in central China. It is the fifth most populous city of the nation. Wuhan is characterized by its heterogeneity of land cover. The water bodies scatter within and around the urban area highlight the diversity of land composition. The extent of the study area is 45×36km, which covers the entire downtown Wuhan and reaches into the rural surroundings. The upper-left and lower-right coordinates are “30°43 53 N, 114°4 49 E” and
“30°24 0 N, 114°32 34 E”, respectively. This coverage is sufficient to exhibit the land composition of the city (Figure. 1(a)).
Figure 1: Study Area and its latent LST. (a) The study area represented by false colour image. SWIR2, NIR, and Green bands of Landsat ETM+ are combined to highlight the land surface heterogeneity of built environment, vegetation and water bodies. (b) The
latent LST at 1330h, July 27th, 2012 extracted by using Gaussian Process model.
The MODIS/Aqua (MYD11A1) V5 Daily L3 Global 1km Grid product is used to represent the LST pattern at particular time point. The MYD11A1 data is acquired at 0130h and 1330h local time. As the SUHI magnitude peaks at afternoon, the data at 1330h is used. The accuracy of the LST data is better than noises, 2) it recovers the latent LST as a continuous surface by populating the resolution by a factor of 2 where analysis of curvatures and shapes can be applied.
2.2 The Morphological Indicators
The Multi-Scale Shape Index (MSSI) (Bonde et al., 2013) is an extension of Koenderink’s Shape Index (SI) (Koenderink and van Doorn, 1992) that evaluates shapes at the optimal scale. It thus contains 2 steps: 1) scale selection, and 2) the SI evaluation.
Evaluating the SI at a uniform level is unfavourable. The local variations of the latent LST are with different sizes and can be overlapped (as shown in Fig. 1(b)). The SI of each pixel should be calculated at its appropriate scale. The scale selection adopts the scale space (Lindeberg, 1998; Lowe, 1999) by projecting ISPRS Annals of the Photogrammetry, Remote Sensing and Spatial Information Sciences, Volume III-2, 2016
manifest the local feature at that point. As the smoothing shifts the original point, the characteristic scale can be found in terms of the kernel size that produces the maximum normalized distance d travelled by a point in the scale space. Since the distance travelled is along the kernel magnitude, the shifted distance by the kernel on an image surface is simply the difference between the original value and the smoothed value. The normalized distance is thus represented as
2 ( , )
( , ) S f f
D f
d
. (2)
The optimal scale * can be identified by the maxima of d through (D f( , )/ ) 0. Intuitively, the zero derivative means that the local feature at the optimal scale should remain stable as scale changes.
Then the MSSI is the SI evaluated at each point on a surface at the optimal scale. The SI of a point on a surface is a function of the principle curvatures at the point represented as (Koenderink and van Doorn, 1992)
2 2 1
arctan
2 1
SI
, SI [ 1,1], (3)
where 1 and 2 ( 1 2) are the principle curvatures. The principle curvatures can be easily evaluated from a noiseless continuous latent LST surface through eigenvalues of the Hessian matrix. The SI measures how a point varies relative to its surroundings as shown in Figure 2. The deformations are encoded within the interval [-1, 1]. The value indicates the extent of the deformation along principle curvatures. Typical shapes such as cup, rut, saddle, ridge, and cap can be measured along the interval. It thus captures both the geometry and magnitude.
Figure 2: The surface morphology in the range of Shape Index.
Besides, the MSSI alone does not capture the complete information of the latent morphology. Objects with same shape yet different sizes can not be distinguished only by using the MSSI, thus the curvedness is also recommended. The
curvedness is calculated at the optimal scale * based upon the principle curvatures through (Koenderink and van Doorn, 1992)
2 2
1 2
2
curvedness . (4)
Thus the MSSI, curvedness or scale provide a complete profile of the underlying shape.
3. RESULTS
3.1 The Illustration of the MSSI
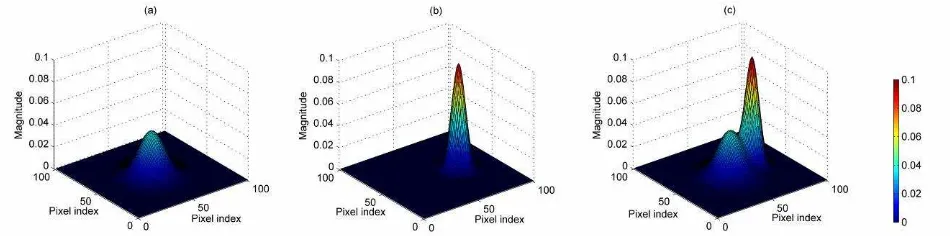
To illustrate how the MSSI operates on smooth and continuous surface data to extract the morphological parameters at multiple scale, the MSSI is first applied to a simple surface containing 2 randomly generated unit Gaussians (Figure 3(c)), the first unit Gaussian is with larger standard deviation (Figure 3(a)) while the second (Figure 3(b)) with smaller one.
Figure 3: Simple surface containing 2 unit Gaussians. The 2 Gaussians are shown in (a) and (b), respectively. The simple surface as the combination is in (c).
For comparison, the SI and the MSSI are both applied to this artificially generated sample surface. Figure 4(a) shows the SI of the surface at uniform scale. Essentially, the pixels from both
unit Gaussians should be with positive SI. However, while the caps of the Gaussians are correctly characterized as positive SI, the overlapped part between them is improperly evaluated as ISPRS Annals of the Photogrammetry, Remote Sensing and Spatial Information Sciences, Volume III-2, 2016
rut, the SIs of these pixels are negative. In contrast, positive MSSIs are assigned to all the pixels from both of the unit Gaussians as in Figure 4(b). Specifically, the pixels at the overlapped part are evaluated with even larger MSSIs, because the pixels are assumed to be from the cap of a very large convex feature. This is intuitive if one took the mixture of Gaussians as one large bump distant away. If the MSSI of each pixel is normalized by its scale * in Equation (2), the recovered SI in Figure 4(c) is comparable with the original SI. The comparison is shown in Figure 4(d). There are 3 evident features worth noting in Figure 4(d). (1) The pixels on the convex Gaussians are evaluated as positive SIs and scatter to
the upper-right part of the graph. Pixels of the overlapped part of the Gaussians are evaluated as cup shaped. (2) The normalized MSSI underestimates the concave shapes produced by the overlapped Gaussians. And (3) the normalized MSSI also underestimates the cap of the Gaussian with larger standard deviation. This is prominent by comparing Figure 4(a) and Figure 4(c). Thus for the mixture of convex Gaussians, the scatter plot spreads divergently towards the upper right of the graph. Essentially, the overall RMSE obtained from the comparison is 0.02, which is considered to be acceptable in this study.
Figure 4: The SI and the MSSI. (a) The SI applied directly on the sample surface at a uniform scale. (b) The MSSI of the surface. (c) The recovered SI from the MSSI by scale normalization. And (d) the SI and scale normalized MSSI comparison.
3.2 The Morphology of the Latent LST
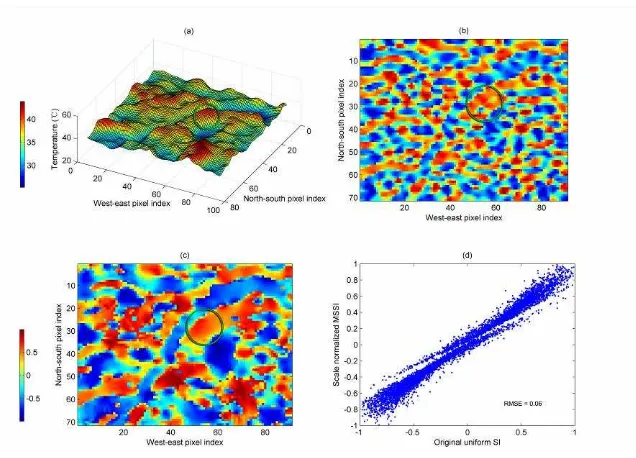
When applied to the study of LST variation, Figure 5 exhibit that the MSSI is capable of capturing the morphological features of the latent LST pattern. The smooth and continuous latent LST pattern is shown in Figure 5(a). The SI of the LST is first obtained and shown in Figure 5(b). While the variation at each pixel location is recorded at a uniform scale, some details are unfavourably captured. A reference place is highlighted in Figure 5(a), which should intuitively be characterized as an large convex shaped feature. Its corresponding SI and MSSI are highlighted in Figure 5(b) and 5(c). Notice how the MSSI characterizes the LST in this area holistically, while the SI
unnecessarily breaks the LST pattern of the area into smaller pieces. Following the manner of Figure 4, the MSSI is recovered by scale normalization. The recovered MSSI is plot against the SI in Figure 5(d). The pattern in the scatter plot is consistent with the one in Figure 4(d). The pixels on convex shaped features are clustered towards the upper right of the graph, while distributed divergently due to the scale of the underlying LST pattern. The pixels on concave shaped features make the scatter plot centrosymmetric. Thus the scatter plot differentiates the convex and concave shapes to some extent. The overall RMSE is 0.06.
Figure 5: The application of the MSSI to the latent LST at 1330h of July 27th, 2012. (a) The latent LST. (b) The SI of the latent LST at uniform scale. (c) The MSSI of the latent LST surface. And (d) the scale normalized MSSI and the original SI comparison.
While the MSSI reveals the morphological characteristics in terms of shape and scale, the curvedness is obtained at the same time through Equation (4). It is necessary to examine how these parameters are related to on another. Figure (6) plots the MSSI, curvedness and scale together. The scale is indicated by the relative size of bubble as the second dimension of the graph. Temperature is also shown by the colour as the forth dimension. At least 4 properties appear to be evident. (1) Pixels with globally high temperature are more likely to be on local convex features. Few pixels with globally high temperature are of concave shapes, these pixels are assumed to be in urban areas,
where the temperature is high yet the surrounding pixels can be even higher. (2) The curvedness is inversely proportional to the scale as large scale features are estimated to be with weak curvedness. (3) The MSSI values are reasonably clustered around ±0.5, meaning that most pixels are located around local cups and caps, and few pixels are local extrema or saddle shaped. (4) Those pixels located along the river with globally lowest temperature (with dark blue colour) are characterized as on local ruts, indicating that the river is properly evaluated as local rut.
Figure 6: The relationships among the MSSI, curvedness, scale, and temperature.
3.3 The LSUHI
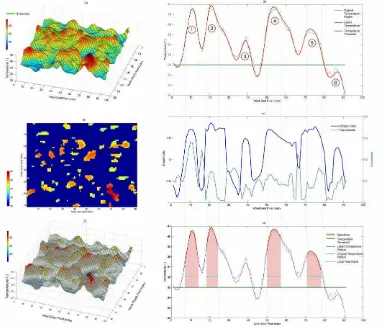
While the MSSI, curvedness, scale and temperature can provide the profile of the latent LST pattern, it is necessary to show how these parameters can be applied to facilitate mitigation and adaptation of the planning domain. A triplet of criteria is formed to select those places potentially with greatest concern. The LST patterns of these places resemble SUHI at local scale, and can be referred as LSUHI. The triplet of criteria contains temperature threshold, the MSSI, and the curvedness/scale. As the curvedness and scale inversely proportional to one another, they can be used interchangeably. Figure 7 gives the results where the triplet is applied to the latent LST at 1330h, July 27th, 2012. The parameters of the criteria in the triplet are set as: temperature threshold>35℃, the MSSI>0.5, curvedness>0.05. It means that only the LSUHI with at least 35℃, and shaped at least as a ridge with
curvedness greater that 0.05 are considered. For illustration, the LSUHI selection is first shown in 1D as in Figure 7(b). A row of latent LST is randomly selected as highlighted in Figure 7(a). There are 6 potential LSUHI along the 1D sample as numbered in Figure 7(b), where the 6th LSUHI is knocked out by the temperature threshold. When the other two criteria in Figure 7(c) are considered, the 3rd LSUHI is eliminated by the curvedness. As it is a ridge shaped LSUHI, it is convex only along one direction producing a relatively weak curvedness. This is evident in Figure 7(a). What worth noting in Figure 7(d) is that only part of the 2nd, 4th, and 5th LSUHIs are selected. The flat parts of the LSUHIs are estimated with larger scale and weaker curvedness, and thus are rejected by the criteria. Figure 7(e) further shows the distribution of the selected LSUHIs in 2D. These selected LSUHIs are superimposed on the original latent LST data in Figure 7(f).
Figure 7: The LSUHIs meet the selection criteria. (a) Location of the column pixels for 1D illustration. (b) The profiles of the 1D LST as well as the temperature threshold. (c) The MSSI and the curvedness of the 1D LST. (d) The selections of LSUHIs in 1D. (e)
The selections in 2D. And (f) Selections superimposed on the original latent LST.
4. DISCUSSION & CONCLUSION
This research extends the conventional investigation of SUHI to the local scale. The research explicitly claims that the spatial features of the LST should be included in the study of LST pattern. The morphological indicators are generated through the application of the MSSI. The accuracy of this
characterization show promising results. When the MSSI, curvedness and scale are applied to the real LST data, the LSUHI can be selected in terms of specific criteria. The triplet of the criteria can be used as a tool to facilitate LST pattern analysis at local scale where planning and design professionals can identify the problems in a more precise manner. The ISPRS Annals of the Photogrammetry, Remote Sensing and Spatial Information Sciences, Volume III-2, 2016
mitigation and adaptation of the temperature problem might also be more feasible at local scale.
ACKNOWLEDGEMENTS
This research is supported by the National Natural Science Fou -ndation of China (51378399, 41331175).
REFERENCES
Anderson, M., Norman, J., Kustas, W., Houborg, R., Starks, P., Agam, N., 2008. A thermal-based remote sensing technique for routine mapping of land-surface carbon, water and energy fluxes from field to regional scales. Remote Sensing of Environment 112, 4227-4241.
Betsill, M., Rabe, B., 2009. Climate change and multilevel governance: The evolving state and local roles. Toward sustainable communities: Transition and transformations in environmental policy, 201-225.
Bonde, U., Badrinarayanan, V., Cipolla, R., 2013. Multi scale shape index for 3d object recognition. Springer.
Control, C.f.D., Prevention, 2005. Heat-Related Mortality--Arizona, 1993-2002, and United States, 1979-2002. MMWR: Morbidity and Mortality Weekly Report 54, 628-630.
Hale, R.C., Gallo, K.P., Loveland, T.R., 2008. Influences of specific land use/land cover conversions on climatological normals of near-surface temperature. Journal of Geophysical Research-Atmospheres 113.
Holzman, M.E., Rivas, R., Piccolo, M.C., 2014. Estimating soil moisture and the relationship with crop yield using surface temperature and vegetation index. International Journal of Applied Earth Observation and Geoinformation 28, 181-192.
Kalkstein, L., Koppe, C., Orlandini, S., Sheridan, S., Smoyer-Tomic, K., 2009. Health impacts of heat: present realties and potential impacts of climate change. Distributional impacts of climate change and disasters. Cheltenham: Edward Elgar, 69-81.
Kalnay, E., Cai, M., 2003. Impact of urbanization and land-use change on climate. Nature 423, 528-531.
Koenderink, J.J., van Doorn, A.J., 1992. Surface shape and curvature scales. Image and vision computing 10, 557-564.
Landsberg, H.E., 1981. The urban climate. Academic press.
Lindeberg, T., 1998. Feature detection with automatic scale selection. International journal of computer vision 30, 79-116.
Lowe, D.G., 1999. Object recognition from local scale-invariant features, Computer vision, 1999. The proceedings of the seventh IEEE international conference on. Ieee, pp. 1150-1157.
Manley, G., 1958. On the frequency of snowfall in metropolitan England. Quarterly Journal of the Royal Meteorological Society 84, 70-72.
Oke, T.R., 1976. The distinction between canopy and boundary
‐layer urban heat islands. Atmosphere 14, 268-277.
Oke, T.R., 1981. Canyon geometry and the nocturnal urban heat island: comparison of scale model and field observations. Journal of Climatology 1, 237-254.
Oke, T.R., 1982. The energetic basis of the urban heat island. Quarterly Journal of the Royal Meteorological Society 108, 1-24.
Rajasekar, U., Weng, Q., 2009. Urban heat island monitoring and analysis using a non-parametric model: A case study of Indianapolis. Isprs Journal of Photogrammetry and Remote Sensing 64, 86-96.
Rasmussen, C.E., 2006. Gaussian processes for machine learning.
Schwarz, N., Schlink, U., Franck, U., Großmann, K., 2012. Relationship of land surface and air temperatures and its implications for quantifying urban heat island indicators—An application for the city of Leipzig (Germany). Ecological Indicators 18, 693-704.
Stewart, I., Oke, T., 2009. Newly developed “thermal climate zones” for defining and measuring urban heat island magnitude
in the canopy layer, Eighth Symposium on Urban Environment, Phoenix, AZ.
Stewart, I.D., 2011. A systematic review and scientific critique of methodology in modern urban heat island literature. INTERNATIONAL JOURNAL OF CLIMATOLOGY 31, 200-217.
Streutker, D.R., 2002. A remote sensing study of the urban heat island of Houston, Texas. International Journal of Remote Sensing 23, 2595-2608.
Valleron, A., Boumendil, A., 2004. [Epidemiology and heat waves: analysis of the 2003 episode in France]. Comptes rendus biologies 327, 1125-1141.
Voogt, J.A., Oke, T.R., 2003. Thermal remote sensing of urban climates. Remote Sensing of Environment 86, 370-384.
Wan, Z., Zhang, Y., Zhang, Q., Li, Z.-L., 2004. Quality assessment and validation of the MODIS global land surface temperature. International Journal of Remote Sensing 25, 261-274.
Weng, Q., 2009. Thermal infrared remote sensing for urban climate and environmental studies: Methods, applications, and trends. Isprs Journal of Photogrammetry and Remote Sensing 64, 335-344.
Wheeler, S.M., 2008. State and municipal climate change plans: the first generation. Journal of the American Planning Association 74, 481-496.
Zhan, X., Kustas, W.P., 2001. A coupled model of land surface CO2 and energy fluxes using remote sensing data. Agricultural and Forest Meteorology 107, 131-152.