IMPRINTING ZEOLITE-MODIFIED GLASSY CARBON
AS A VOLTAMMETRIC SENSOR FOR URIC ACID
Miratul Khasanah*, Muji Harsini, and Alfa Akustia Widati
Chemistry Department, Faculty of Sciences and Technology, Airlangga University Kampus C Unair, Mulyorejo Surabaya, 60115, Indonesia
Received December 6, 2012; Accepted May 10, 2013
ABSTRACT
Development of the uric acid sensor through coating of glassy carbon (GC) electrode with imprinting zeolite (IZ) was carried out. Zeolite was synthesized by mixing TEOS, TBOT, TPAOH, and water followed by hydrothermal process. Zeolite was molded together with uric acid to produce IZ. The deposition potential of IZ and uric acid to the GC surface was -0.6 V during 150 sec with addition of KNO3 0.02 M as supporting electrolyte. The method gives linearity of 0.9834 (concentration 5.6x10⁻⁹M – 2.8x10⁻⁸ M), precision 1.89 – 7.65%, sensitivity 0.33 µA/nM/cm2, limit of detection 5.9x10⁻⁹ M, and accuracy 96.26 ± 0.55% (n = 5).The developed sensor showed a high selectivity toward uric acid. The presence of ascorbic acid, creatine, and creatinine with an equal concentration with uric acid did not interfere on the uric acid analysis.
Keywords: sensor; uric acid; voltammetry; imprinting zeolite; glassy carbon
ABSTRAK
Pengembangan sensor asam urat melalui pelapisan elektroda GC dengan imprinting zeolit (IZ) telah dilakukan. Zeolit (Z) disintesis dengan cara mencampurkan TEOS, TBOT, TPAOH, dan air melalui proses hidrotemal. Pada saat sintesis zeolit ditambahkan asam urat, kemudian asam urat diekstraksi dari struktur zeolit sehingga menghasilkan zeolit yang tercetak molekul asam urat (IZ). Deposisi zeolit dan asam urat pada permukaan elektroda GC dilakukan pada potensial -0,6 V selama 150 detik dengan penambahan KNO3 0,02 M sebagai elektrolit pendukung. Metode yang dikembangkan ini memiliki linieritas sebesar 0,9834 (konsentrasi 5,6x10⁻⁹ M – 2,8x10⁻⁸ M); presisi 1,89 – 7,65%; sensitivitas 0,33 µA/nM/cm2; batas deteksi 5,9x10⁻⁹ M, dan akurasi sebesar 96,26 ± 0,55% (n = 5). Selektivitas sensor yang dikembangkan ini cukup tinggi. Keberadaan asam askorbat, kreatin dan kreatinin dengan konsentrasi sama dengan asam urat tidak mengganggu analisis asam urat.
Kata Kunci: sensor; asam urat; voltammetri; zeolit; glassy carbon
INTRODUCTION
Uric acid is end product of purine metabolism. The high concentration of uric acid in the body is indication of some diseases such as diabetes, high blood pressure, kidney and liver disease, and can increase risk of cardiovascular [1]. To date, spectrophotometry method is used to determine uric acid in the biomedical field. Analysis of uric acid using this method requires a large number of samples (2-3 mL) and produces a low sensitivity and high detection limit (mM).
Voltammetry has been applied to determine concentration and redox properties of many compounds in the body fluids, such as uric acid in the blood serum. Voltammetry methods to detect uric acid by varying electrodes are developed to attempt the lower the limit detection and to increase sensitivity and selectivity. This is because of coexisting of other compounds whose
structure is similar with uric acid in the matrix of sample, that decrease the performance of the analytical method [2-4]. Therefore, a new more sensitive and selective analysis protocol is in demand.
In recent study, we used IZ as alternative material to modify the glassy carbon electrode in attempt to produce a selective sensor for uric acid detection voltammetrically. The IZ was synthesized by mixing of TEOS, TBOT, TPAH and uric acid as printing material employing hydrothermal process [5]. After the synthesis, the trapped uric acid was then extracted leaving uric acid and leave prints in the zeolite framework. The sensor was made by coating the synthesized IZ on the glassy carbon electrode surface at the optimum potential and time.
high sensitivity for uric acid determination. Zeolite has rigid structure, so that in the aqueous media can maintain the shape and size of its pore (selective) [6]. The performance and validity of the sensor for uric acid analysis have been studied in this research.
EXPERIMENTAL SECTION
Materials
Chemicals used in this study were uric acid purchased from Fluka; creatine and creatinine purchased from Sigma-Aldrich; tetraethyl ortho silicate, tetrapropyl ammonium hydroxide, tetrabutyl orthotitanate, 2-propanol, ethanol, sodium acetate, acetic acid, sodium dihydrogen phosphate, sodium hydrogen phosphate and potassium nitrate purchased from Merck. All chemicals were analytical grade (p.a). The stock solution of uric acid 6.0x10⁻³ M was prepared by dissolving 0.1000 g uric acid in about 10 mL sodium hydroxide 50% and diluted with water until 100 mL in a volumetric flask. The solutions of creatine and creatinine were prepared by dissolving the compounds using water in the room temperature. The water used in this research is ultra high pure (UHP) water.
Instrumentation
The instruments used in this study were 797 Computrace Voltammetry (MVA system-1) equipped with a sample container, stirrer, processor units, personal computer, glassy carbon (BAS MF-2012, d = 3 mm), reference electrode Ag/AgCl (KCl 3M) and Pt auxiliary electrodes; FTIR (Shimadzu), N2
adsorption-desorption/BET (Quantachrome NovaWin version 2.1); X-ray diffractometer (XRD), pH meter; and other supporting equipments.
Procedure
Synthesis and characterization of zeolite
Zeolite was synthesized by mixing TEOS into TBOT and stirred for 30 min at room temperature. TPAH was then added dropwise to the mixture, and stirred for 15 h, so that the mixture obtained has a mole ratio of TEOS:TiO2:TPAH:H2O = 1:0.017:0.24:21.2. The mixture
was further heated hydrothermally at 80 °C for 4 days. Non imprinting zeolite (NIZ) was synthesized by adding uric acid to the mixture with a molar ratio of uric acid/Si = 2.98x10⁻⁴. Subsequently, the mixture allowed aging for 3 h [5]. The uric acid was then extracted from the zeolite framework using warm water to produce IZ. The synthesized zeolite (Z), IZ and NIZ were characterized using FTIR, XRD, and N2 adsorption-desorption.
Preparation and performance test of the sensor
The IZ was coated in situ on GC electrode. A number of 20 mL of uric acid solution was inserted into the electrochemical cell, added with 5 mg IZ and coated to the GC electrode at the potential range between +1 V and -1 V (vs. Ag/AgCl). Coating time was varied from 30-180 sec, while the pH of the solution was arranged from pH 4-7. The Z and NIZ were coated on the GC electrode surface at the optimum potential and time. The IZ, GC, zeolite (Z) and GC-NIZ sensors were then applied to analyze uric acid and the peaks of potential and current are observed to determine the sensor performances.
Method validity
A series of uric acid standard solution with concentration of 5.6x10⁻⁹, 1.1x10⁻⁸, 1.7x10⁻⁸, 2.3x10⁻⁸, and 2.8x10⁻⁸ M were analyzed by voltammetry using GC-IZ sensor. The current value of standard solution was used to determine the linearity, limit of detection, sensitivity, and the precision. Accuracy was studied by analyzing of uric acid solution 2.8x10⁻⁸ M. The selectivity of the sensor was studied through the addition of ascorbic acid, creatine, and creatinine (matrices which are always coexist with uric acid in serum sample) on the uric acid analysis. The molar ratios of the uric acid and the each matrix were 1:1, 1:2, 1:3, 1:4, and 1:5, respectively. The current responses of the mixing compounds were compared to the results of the current response of uric acid without the addition of matrix.
RESULT AND DISCUSSION
Synthesis and Characterization of Zeolite
Precursors used to synthesize zeolite were TBOT and TEOS as titanium and silica sources, respectively, whereas TPAH served as a structure directing agent and alkaline condition. The addition of uric acid in the synthesis of IZ and NIZ served as template and a directional pore size of zeolite. Zeolite, NIZ, and IZ were obtained as white powder.
X-ray diffractogram (Fig. 1) showed that diffraction peaks of the synthesized zeolite appear at 2θ of 7.96, 8.85, 23.2, 23.9, and 24.4°. These peaks correspond to the characteristic of zeolite framework [7]. A single reflection 2θ around 24.4° indicated a transformation of monoclinic silicalite into orthorhombic zeolite [8]. Both Z and IZ exhibited a similar peaks and no reflection peaks of uric acid occurred. These data indicated that uric acid which associated to the zeolite (NIZ) has been successfully extracted.
Fig 1. X-ray diffractogram of Z and IZ Fig 2. FTIR spectra of (a) Z, (b) NIZ, and (c) IZ
Fig 3. Stripping voltammogram of uric acid using sensor
of (a) GC, (b) GC-Z, (c) GC-IZ and (d) GC-NIZ
Table 1. The uric acid current measured using GC-IZ,
GC, GC-Z, and GC-NIZ sensor
Sensor Anodic current (nA) RSD (%) (n=3)
GC-IZ 619.90 1.89
GC 3082.00 4.28
GC-Z 489.63 13.44
GC-NIZ 3643.67 10.17
uric acid concentration = 3.0x10⁻⁸ M
of 800, 960, and 1100 cm-1 which is the typical peak of the zeolite [9]. Peak at 800 cm-1 indicates the symmetric stretching of Si-O-Si, at 960 cm-1 indicates the presence of titanium in the zeolite framework, whereas peak at 1100 cm-1 indicates the presence of stretching asymmetric Si-O-Si [10]. The FTIR spectra of NIZ show
both characteristic peaks of zeolite, and characteristic peaks of uric acid at 840, 1650, and 3450 cm-1. Comparing FTIR spectra of NIZ with IZ at the wave number 1650 cm-1 specific for carbonyl group of uric acid, a reduced intensity was observed which indicated that most of the uric acid was successfully extracted from the zeolite framework. Based on the physisorption analysis employing N2 adsorption-desorption methods,
the synthesized zeolite (Z) possessed a pore diameter of 3.836 nm, while IZ has a pore diameter of 2.186 nm.
Coating of GC Electrode with Imprinting Zeolite
In this research, IZ was coated in situ and deposited together with uric acid on the surface of the
GC electrode, and KNO3 0.02 M was added as
supporting electrolyte in the uric acid solution to minimize the non faradic current. The optimum deposition potential of IZ and uric acid on the GC electrode surface was -0.6 V during 150 sec and yield the stripping peak potential of -0.376 V. Deposition potential of uric acid was more negative than its stripping peak potential. This indicates that reduction reaction occurred during the deposition step and oxidation reaction occurred during the stripping step. This feature leads to the conclusion that uric acid analysis technique using GC-IZ sensor in this study belongs to anodic stripping voltammetry.
Performance of the GC-IZ Sensor
N
the analyte can diffuse freely on the GC surface and induce current. This feature generated a slightly higher current of the GC-IZ sensor compare to the GC-Z sensor. The GC-NIZ exhibited the highest current response, due to the existence of uric acid in the NIZ layer on the GC surface (Table 1). Voltammograms resulted from the uric acid analysis using GC, GC-Z, GC-NIZ and GC-Z sensors were shown in Fig. 3.
Method Validity
The standard curve of uric acid was made from uric acid solution of 5.6x10⁻⁹ M – 2.8x10⁻⁸ M, generated regression equation of y = 136.7x - 4728 with a correlation coefficient (r) of 0.9834. The t-test of r showed tcount (6.3846) greater than the ttable (2.920). It
can be concluded a linear relationship between the concentrations of uric acid against the current. The obtained precision (RSD) was 1.89% – 7.65%. This data lead to the conclusion that the developed sensor provide a smaller precision than 2/3xRSDHorwitz (30% to g/L or
10-9 M level) [11-12]. However, this value is statistically acceptable. Sensitivity of the developed method was 0.33 μA/nM/cm2 and it is lower than using sensors of GC and GC-imprinting polymetacrylic acid from the previous study [13]. The resulted detection limit was 5.9x10⁻⁹ M. This value is about 104 times lower than using spectrophotometry method (1.2 x10⁻⁵ M) and smaller than the results obtained from the previous studies [14-20]. With a low detection limit, the analysis of uric acid in a very small amount of serum sample (µL) can be done. The obtained accuracy of 2.8x10⁻⁸ M uric acid was 96.26
± 0.55% (n = 5). The accuracy value is very good and
statistically acceptable (accuracy for 10-9 M
concentration level is 70 – 125%) [11-12]. This superior new sensor offer a new alternative for uric acid analysis voltammetrically.
Selectivity
One of the major problems on the determination of uric acid in the serum sample by the voltammetry method is the presence of other compounds which are usually found together with uric acid in serum sample. In this study, to determine the selectivity of the developed sensor, the interference of ascorbic acid, creatine, and creatinine on determination of the uric acid has been studied. From the Table 2, it can be concluded that the analysis of uric acid voltammetrically using the developed sensor was not
Fig 4. Stripping peak potential (Ep) versus pH of uric
acid solution
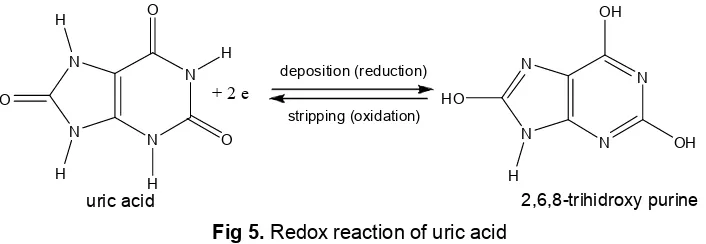
Fig 5. Redox reaction of uric acid
Table 2. Deviation of the uric acid current caused by adding ascorbic acid, creatine, and creatinine
Deviation of the anodic current (%)
Ascorbic acid Creatine Creatinine
[UA]:[matrix]
interfered by ascorbic acid, creatine and creatinine, because according the previous report, the normal concentration of ascorbic acid and creatine/creatinine in the serum sample were one tenth and one fourth of uric acid concentration, respectively [21-23]. Compared to the GC sensor, the selectivity of GC-IZ sensor toward uric acid in the ascorbic acid, creatine, and creatinine matrices with equal concentration to uric acid were 5, 18 and 2 times higher, respectively.
Redox Reaction Mechanism
The reaction mechanism of the redox process occurred in this research was revealed by conducting an experiment which delved the influence of pH toward stripping potential (Ep) of uric acid. The pH vs. Ep curve (Fig. 4) shows relationship between the pH of the solution and the stripping potential with slope of -59.5 mV. This value revealed that the redox reaction of uric acid on the GC-IZ surface involved 2 electrons and two protons (H+). The redox reaction of uric acid on the GC-IZ surface is shown in Fig. 5.
CONCLUSION
The GC-IZ showed good performance as sensor for uric acid analysis voltammetrically. The uric acid analysis method using GC-IZ sensor has a high sensitivity, precision, accuracy, and low detection limit. The limit of detection obtained is low enough for the purpose of uric acid determination in natural samples such as blood serum. Analysis of uric acid using the developed sensor was not interfered by ascorbic acid, creatine, and creatinine with an equal concentration with uric acid. Thus, voltammetry method using the developed sensor is suggested to be used as an alternative method to determine of uric acid in the medical field.
ACKNOWLEDGEMENT
The authors would like to acknowledge to DIKTI for financial support of this research through the Hibah Penelitian Unggulan Perguruan Tinggi LPPM Universitas Airlangga, based on Surat Keputusan Rektor, No: 2613/H3/KR/2012, March 9th, 2012.
REFERENCES
1. Chen, J.-C., Chung, H.-H., Hsu, C.-T., Tsai, D.-M., Kumar, A.S., and Zen, J.-M., 2005, Sens. Actuators, B, 110, 2, 364–369.
2. Khasanah, M., Supriyanto, G., Handajani, U.S., Fitriana, M., and Asmaningrum, W., 2007, Analysis of Uric Acid in Urine and Serum with Voltammetry
Stripping Analysis using Hanging Mercury Drop
Electrode, Proceeding of the ICOWOBAS,
Universitas Airlangga, Surabaya, 6-7th August 2007, 307–311.
3. Khasanah, M., Supriyanto, G., Wafiroh, S., Kuncaka, A., Sugiharto, E., and Mudasir, 2010,
Indo. J. Chem., 10, 3, 295–300.
4. Khasanah, M., Supriyanto, G., Tambunan, F.N., Mudasir, Kuncaka, A., and Sugiharto, E., 2010,
Molecularly Imprinted Polymethacrylic Acid Modified Glassy Carbon as a Voltammetric Sensor of Uric Acid Analysis, Proceeding of the 2nd ICCS,
Universitas Gadjah Mada, Yogyakarta, 14-16th October 2010, 457–460.
5. Eimer, G.A., Díaz, I., Sastre, E., Casuscelli, S.G., Crivello, M.E., Herrero, E.R., and Perez-Pariente, J., 2008, Appl. Catal. A, 343, 1-2, 77–86.
6. Goriushkina, T.B., Kurç, B.A., Sacco, A.Jr., and Dzyadevych, S.V., 2010, Sens. Electron. Microsys. Technol., 1, 36-42.
7. Treacy, M.M.J., Higgins, J.B., and von Balloms, R.,
2001, Collection of Simulated XRD Powder
Patterns for Zeolite, 4th ed., Elsevier, Amsterdam. 8. Mondal, P., and Deka, R.Ch., 2007, Bull. Catal.
Soc. India, 6, 151–159.
9. Fang, Y.M., and Hu, H.Q., 2007, Catal. Commun., 8, 817–820.
10. Drago, R.S., Dias, S.C., McGilvray, J.M., and Mateus, A.L.M.L., 1998, J. Phys. Chem., 102, 9, 1508–1514.
11. Taverniers, I., De Loose, M., and Van Bockstaele, E., 2004, Trends Anal. Chem., 23, 8, 535–552. 12. Workman, J.Jr., and Mark, H., 2006, Spectroscopy,
21, 9, 18–24.
13. Khasanah, M., 2012, Development of Stripping Voltammetric Method for Uric Acid Analysis through Electrode Coating with Molecular Imprinting Polymer, Dissertation, FMIPA UGM, Yogyakarta, 69–70.
14. Zare, H.R., Memarzadeh, F., Ardakani, M.M., Namazian, M., and Golabi, S.M., 2005,
Electrochim. Acta, 50, 16-17, 3495–3502.
15. Lin, X-Q., and Jin, G-P., 2005, Electrochim. Acta, 50, 16-17, 3210–216.
16. Zare, H.R., Rajabzadeh, N., and Ardakani, M.M., 2006, Electroanal. Chem., 589, 1, 60–69.
17. Ren, W., Luo, H.Q., and Li, N.B., 2006, Biosens. Bioelectron.,21, 7, 1086–1092.
18. Lin, X., and Li, Y., 2006, Electrochim. Acta, 51, 26, 5794–5801.
19. Wei, Y., Li, M., Jiao, S., Huang, Q, Wang, G., and Fang, B., 2006, Electrochim. Acta, 52, 3, 766–772. 20. Babaei, A., Zendehdel, M., Khalilzadeh, B., and
21. Chen, P-Y., Vittal, R., Nien, P-C., Liou, G-S., and Ho, K-C., 2010, Talanta, 80, 3, 1145–1151.
22. Lakshmi, D., Prasad, B.B., and Sharma, P.S., 2006,
Talanta, 70, 2, 272–280.
23. Lakshmi, D., Sharma, P.S. and Prasad, B.B., 2007,