Comparative Study of Ni-Zn LHS and Mg-Al LDH
Adsorbents of Navy Blue and Yellow F3G Dye
Idha Yulia Ikhsani
1,2,*, Sri Juari Santosa
2, and Bambang Rusdiarso
2 1Research Center for Deep Sea, Indonesian Institute of Science, Jl. Y. Syaranamual, Guru-guru, Poka, Ambon 97233 2
Department of Chemistry, Faculty of Mathematics and Natural Sciences, Universitas Gadjah Mada Sekip Utara PO BOX BLS 21 Yogyakarta 55281, Indonesia
Received July 15, 2015; Accepted August 11, 2015
ABSTRACT
Adsorption of disperse dyes from wastewater onto Ni-Zn LHS (layered hydroxide salts) and Mg-Al LDH (layered double hydroxides) has been compared in this study. Effects of initial pH solution, contact time and initial dye concentration were investigated. The ability of the adsorbent to be reused was also studied. The results showed that acidic condition was favorable for the adsorption of each dyes onto both adsorbent. The adsorption kinetics was studied using pseudo-first-order, pseudo-second-order and Santosa’s kinetics models. The experimental data fits well with the pseudo-second order kinetic model. The equilibrium adsorption data were analyzed using Langmuir and Freundlich isotherm models. The results showed that adsorption of navy blue onto both adsorbent followed Freundlich isotherm adsorption, while yellow F3G followed Langmuir isotherm adsorption. In the application for the adsorption the wastewater containing dyes, Ni-Zn LHS has a better adsorption capacity of 52.33 mg/g than that of Mg-Al LDH that 30.54 mg/g. Calcination of the adsorbent which has already been used increased the adsorption capacity of Mg-Al LDH to 84.75 mg/g, but decreased the adsorption capacity of the Ni-Zn LHS to 42.65 mg/g.
Keywords:Ni-Zn LHS; Mg-Al LDH; yellow F3G; navy blue
ABSTRAK
Dalam penelitian ini telah dilakukan perbandingan dua material penukar anion, yaitu : Ni-Zn layered hydroxide salts (LHS) dan Mg-Al layered double hydroxides (LDH) untuk mengadsorp zat warna dalam limbah pewarnaan kain anti alat pencitra NIR yang berisi campuran zat warna navy blue dan yellow F3G. Dilakukan beberapa variasi kondisi adsorpsi yaitu pH larutan, waktu kontak dan konsentrasi larutan. Kinetika adsorpsi dipelajari dengan persamaan pseudo orde satu, pseudo orde dua dan kinetika Santosa. Data eksperimen menunjukkan bahwa adsorpsi kedua zat warna pada kedua adsorben mengikuti kinetika pseudo orde dua. Kesetimbangan adsorpsi dianalisis dengan dua model isotermal adsorpsi yaitu Langmuir dan Freundlich. Hasil penelitian menunjukkan bahwa adsorpsi navy blue pada Zn LHS dan Mg-Al LDH mengikuti isotermal adsorpsi Freundlich, sedangkan adsorpsi yellow F3G pada Ni-Zn LHS dan Mg-Al LDH mengikuti isotermal adsorpsi Langmuir. Saat digunakan untuk mengasdorp campuran zat warna dalam limbah, Ni-Zn LHS memiliki kemampuan yang lebih baik dari Mg-Al LDH dibuktikan dengan kapasitas adsorpsi yang lebih tinggi yaitu 52,33 mg/g sedangkan Mg-Al LDH 30,54 mg/g. Proses kalsinasi terhadap adsorben yang telah digunakan, meningkatkan kapasitas adsorpsi Mg-Al LDH menjadi 84,75 mg/g, namun menurunkan kapasitas adsorpsi Ni-Zn LHS menjadi 42,65 mg/g.
Kata Kunci:Ni-Zn LHS; Mg-Al LDH; yellow F3G; navy blue
INTRODUCTION
There are considerable interests in layered materials due to their potential application as adsorbents, composite, catalyst support, and anion exchanger [1-2]. The simplest example of this type of material is graphite that is the alkaline earth transition metal hydroxides. There are also more complex structures, such as layered hydroxide salts
(LHS-M2+(OH)2-x(A
m-)x/m.nH2O) and layered double
hydroxides (LDH - M2+1-xM 3+
x(OH)2(A
m-)x/m.nH2O) [3].
In magnesium–aluminum layered double hydroxide (Mg-Al LDH), some divalent cations in the brucite–Mg(OH)2–like layers are isomorphically
camouflage costume. Development in military has successfully created fabrics that have ability for anti Near Infra-Red (NIR) detection device. Coloration of the fabrics is performed using a mixture of disperse navy blue and yellow F3G dyes.
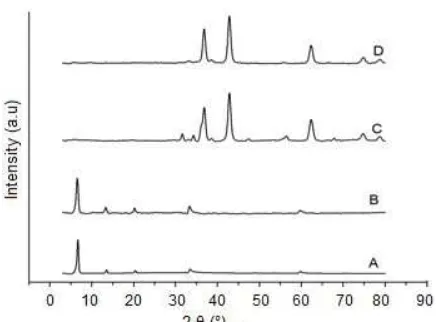
The dyeing process of the fabric produces waste water which can cause serious problems for the environment. Both of navy blue and yellow F3G are carcinogenic and persistent in air, water and soil [4]. In this case, wastewater containing these dyes must be treated prior to their discharge into the receiving water [5]. Adsorption is the best method for the treatment of wastewater from the dyeing process. Both of disperse navy blue and yellow F3G have functional groups which have a high electronegativity (as seen in Fig. 2), so the disperse dyes can be adsorbed onto Ni-Zn LHS and Mg-Al LDH which are able to act as anion exchanger. The objectives of this work were: (1) to characterize the Mg-Al LDH and Ni-Zn LHS by Fourier transform infrared (FT-IR) spectroscopy for chemical functional groups and by X-Ray powder diffraction (XRD) for chemical composition; (2) to study the effect of different parameters on dyes adsorption, such as pH, contact time and dyes concentration; (3) to study the kinetic and thermodynamic of dyes adsorption on both Mg-Al LDH and Ni-Zn LHS; (4) to study the ability of Mg-Al LDH and Ni-Zn LHS as reused adsorbent.
EXPERIMENTAL SECTION
Materials
Disperse yellow F3G and navy blue. Analytical grade of Mg(NO3)2.6H2O; Al(NO3)3.9H2O; NaOH;
CH3COOH; Ni(OCH3COO)2.4H2O and
Zn(OCH3COO)2.4H2O were obtained from Merck Co Inc.
(Germany) and used without further purification.
Instrumentation
Powder X-ray diffraction (PXRD) patterns were recorded in a Shimadzu 6000 instrument, using nickel
Fig 2.Structure of (a) navy blue (b) yellow F3G
filtered CuKα (λ = 1.54050 Å). The FT-IR spectra were
recorded by the KBr pellet technique in a Shimadzu Prestige 21 Fourier Transform instrument. Scanning electron microscopy (SEM) micrograph was obtained using a JEOL type JED-2300. The dyes concentrations were determined using Perkin Elmer 3110 spectrophotometer.
Procedure
Preparations of Ni-Zn LHS, Mg-Al LDH and dyes solution
Ni-Zn LHS with Ni2+/Zn2+ molar ratio of 2 was prepared according to literature by Hara [1]. Ni(OCH3COO)2.4H2O (0.134 mmol) and
Zn(OCH3COO)2.2H2O (0.066 mmol) were dissolved in
deionized water (200 mL). The solution was hydrolyzed by heating in a TeflonTM-linked with pressure bottle at 200 °C for 24 h. The formed precipitation were filtered, washed with deionized water, and dried under vacuum, yielding ca.5 g of Ni-Zn LHS as a light green powder. Mg-Al LDH with Mg2+/Al3+molar ratio of 2 was prepared by co-precipitation at pH 10, following the method described by Santosa [6]. An aqueous solution (500 mL) containing NaOH 0.5 M was added drop wise to a solution 100 mL containing 0,05 mol Mg (NO3)2.6H2O dan 0.025 mol Al(NO3)3.9H2O with
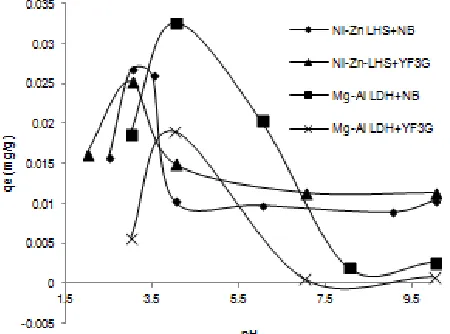
Fig 3. XRD difractogram of (A) Ni-Zn LHS (B) after adsorption (C) after calcination (D) reused
Fig 4. XRD difractogram of (A) Mg-Al LDH (B) after adsorption (C) after calcination (D) reused
and yellow F3G with mass ratio 1:2 for 45 min at temperature 130 °C and pH 5.
Adsorption studies
Wastewater of fabric dyeing for anti NIR detection device, contains a mixture of both disperse navy blue and yellow F3G. Adsorptions study of wastewater was started by adsorption test for each dyes onto each adsorbent in order to obtain optimum conditions such as pH, contact time and initial dyes concentrations. Then, these optimum conditions were applied for the wastewater adsorption.
Effect of pH medium. As it was conducted on the stability test of Ni-Zn LHS and Mg-Al LDH, a series of 10 mL of 10 mg/L dye solutions was prepared and its acidity was adjusted to pH 2, 3, 4, 6, 8, 10 for Ni-Zn LHS for Mg-Al LDH by using either NaOH or CH3COOH
solutions. Into every dye solution, 12.5 mg adsorbent was poured and the stirred for 2 h. After filtering, the concentration of dyes in the solution was determined using Perkin Elmer 3110 spectrophotometer at 602 and 410 for navy blue and yellow F3G respectively.
Kinetic studies. Adsorption experiments were carried out in a batch equilibrium mode. Effects of pH (2-10), contact time (0-360 min), and initial dye concentrations (10-100 mg/L) were investigated. The initial pH was adjusted by adding a few drops of dilute NaOH or CH3COOH. An amount of Mg-Al LDH or Ni-Zn LHS
(12.5 mg) was dispersed in 10 mL of dyes solutions and stirred with agitation speed of 100 rpm. After each contact time the sample were removed and filtered. The dye concentrations were determined using Perkin Elmer 3110 spectrophotometer at 602 nm for navy blue and 410 nm for yellow F3G. The amount of dyes adsorbed was derived from the final and the initial concentration of dyes in liquid phase. The dye adsorbed by adsorbents was calculated by the following equation:
0 t
where qt is the amount of adsorbed dyes at time t (mol/g);Vthe volume of solution (L),C0andCtare the initial and at time t dye concentrations respectively (mol/g) andmis the mass of adsorbent (g).
Adsorption isotherm. A constant volume of dye solutions (10 mL) with varying initial concentration (10-100 mg/L) was mixed with constant amount of Ni-Zn LHS or Mg-Al LDH (12.5 mg). The dispersions were shaken at 30 °C, under agitation speed of 100 rpm. The dispersions were maintained at constant pH 3 for Ni-Zn LHS and pH 4 for Mg-Al LDH over 120 min for both adsorbents. The dye adsorbed,qe(in mol/g) was obtained using the following equation:
o e
whereCoandCe (mol/L) are initial and equilibrium dye concentrations respectively; V (L) is the volume of solution andm(g) is the adsorbent mass.
RESULT AND DISCUSSION
Characterization of Ni-Zn LHS and Mg-Al LDH
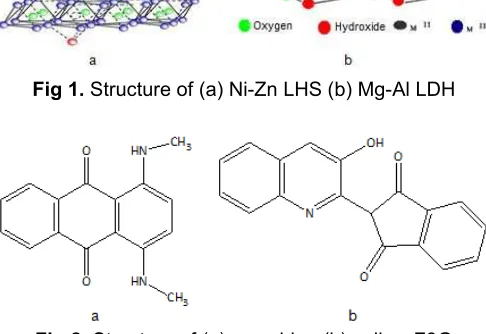
The X-Ray diffraction patterns of the Ni-Zn LHS and Mg-Al LDH are shown in Fig. 3 and 4. XRD pattern of Ni-Zn LHS illustrated the 001, 002, 003, 020 and 040
reflections in the spectra at 2θ 6.6, 13.5, 20.3, 33.4 and
59.8° with basal spacing 13.1, 6.5, 4.3, 2.6 and 1.5 Å. The same results are cited in literature [8]. In Mg-Al
LDH there are three main peaks at 2θ of 10.29, 20.15,
and 34.67° with basal spacing 8.59, 4.4, 2.59 Å. These peaks are characteristic for Mg-Al LDH.
Fig 5. FT-IR spectra of Ni-Zn LHS (below), Ni-Zn LHS after adsorb dyes (middle), mixture of navy blue and yellow F3G on waste water (above)
Fig 6. FT-IR spectra of Mg-Al LDH (below), Mg-Al LDH after adsorb dyes (middle), mixture of navy blue and yellow F3G on waste water (above)
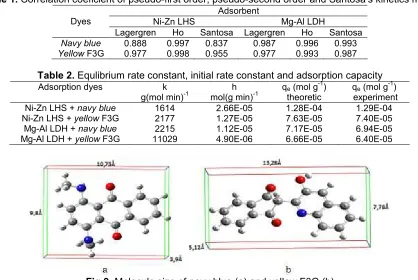
Fig 7.Adsorption of navy blue and yellow F3G on both Ni-Zn LHS and Mg-Al LDH as a function pH
Fig 8.Adsorption of navy blue and yellow F3G on both Ni-Zn LHS and Mg-Al LDH as a function time
hydroxyl groups in both of Ni-Zn LHS and Mg-Al LDH at 3425 and 3479 cm-1, respectively. In Ni-Zn LHS, absorption at 1573 and 1404 cm-1 corresponds to νas
(COO-) and νs (COO
-), respectively. Weak band at 1334 cm-1attributes to the deformation of methyl group δ (CH3). In Mg-Al LDH spectrum, that weak band at
1635 cm-1show the deformation mode of H-O-H in the interlayer Mg-Al LDH [7]. The peak at 1381 corresponds to the presence of nitrate ions.
Adsorption Studies
Effect of pH medium
Experiment regarding the effect of pH study in the removal of dyes was carried out within the range pH from 2 to 10 for Ni-Zn LHS and 3 to 10 for Mg-Al LDH.
Table 1.Correlation coeficient of pseudo-first order, pseudo-second order and Santosa’s kinetics model
Adsorbent
Ni-Zn LHS Mg-Al LDH
Dyes
Lagergren Ho Santosa Lagergren Ho Santosa
Navy blue 0.888 0.997 0.837 0.987 0.996 0.993
YellowF3G 0.977 0.998 0.955 0.977 0.993 0.987
Table 2.Equlibrium rate constant, initial rate constant and adsorption capacity
Adsorption dyes k
Ni-Zn LHS +navy blue 1614 2.66E-05 1.28E-04 1.29E-04
Ni-Zn LHS +yellowF3G 2177 1.27E-05 7.63E-05 7.40E-05
Mg-Al LDH +navy blue 2215 1.12E-05 7.17E-05 6.94E-05
Mg-Al LDH +yellowF3G 11029 4.90E-06 6.66E-05 6.40E-05
Fig 9.Molecule size of navy blue (a) and yellow F3G (b)
excess of hydroxide ion in the solution in order occupy the active sites of the adsorbents [9].
Kinetic studies
Fig. 8 shows that the adsorption amounts of dyes increased with the increase of contact time and became relatively constant at contact times more than 150 and 120 min for yellow F3G and navy blue on Ni-Zn LHS. While for Mg-Al LDH became relatively constant at contact times more than 120 and 90 min for yellow F3G and navy blue. To examine the control mechanism of adsorption process, kinetics models were used to test experimental data from the adsorption of dyes onto Ni-Zn LHS and Mg-Al LDH. The kinetics of adsorption dyes onto Ni-Zn LHS and Mg-Al LDH were analyzed using pseudo-first order [10], pseudo-second order [11] and Santosa’s kinetics model [12] as mathematically expressed in the following equation:
1where k1is an equilibrium rate constant of pseudo-first
order sorption (min-1), qe is the amount of sorbate orbed at equilibrium (mmol g-1);tis the reaction time (min);qtis
the amount of sorbate sorbed at timet(mmol g-1);k2is the equilibrium rate constant of pseudo-second order sorption (g mmol-1 min-1); h is initial rate reaction (mol g-1min-1).CA0(mol/L) is initial concentration;CAe(mol/L) is dyes concentration at equilibrium,ks{(mol/L)
-1
min-1} is the equilibrium rate constant for Santosa’s kinetics model.
Conformity between the predicted values of experimental data and the model was expressed by the correlation coefficient R2. The correlation coefficients for the pseudo-first order, pseudo-second order and Santosa’s kinetics model are shown in Table 1. Based on Table 1, the experimental data best fits with the pseudo-second order kinetics model, the initial adsorption rate (h), equilibrium rate constant (k2), adsorption capacity (qe) experiment and theoretic based on pseudo-second order equilibrium are shown in Table 2. As shown in Table 2, value of experimental adsorption capacity and theoretical one was not so different. The initial adsorption rate for navy blue onto both of adsorbent is higher than for yellow F3G, it means that adsorption navy blue onto both adsorbent was faster than yellow F3G because molecular size of navy blue was smaller than yellow F3G as shown in Fig. 9.
Adsorption isotherm
Adsorbent-dyes Freundlich constant (Kf)
(L/g)
Heterogenity (n) qe(mol/g)
experiment
Ni-Zn LHS – navy blue 0.295 1.232 0.075
Mg-Al LDH – navy blue 0.062 1.211 5.23E-05
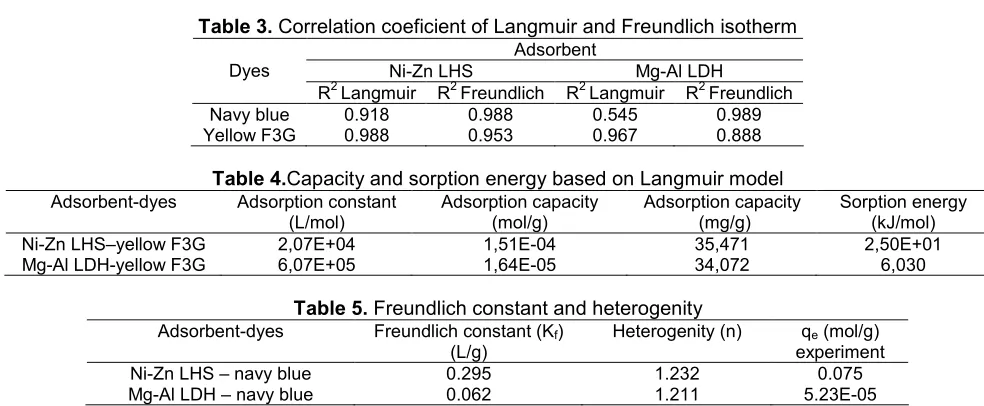
investigated. The data show that it satisfactorily fitted with the Freundlich model (equation 6) for adsorption navy blue and Langmuir model (equation 7) for adsorption Yellow F3G onto both of adsorbents as shown in Table 3. The sorption energy also calculated using Langmuir constant as expressed in equation 8.
1
where Ce is dye concentrations in aqueous solution at equilibrium (mol/L),qeandqmare the adsorption capacity at equilibrium and at concentration m (mol/g), Kf(L/g) and 1/n are Freundlich constant and adsorbent heterogeneity, KL (L/mol) is Langmuir constant. Es (kJ/mol) is sorption energy; 0
s
G (kJ/mol) is Gibbs free energy for adsorption.
As shown in Table 3, the adsorption navy blue onto both adsorbents followed Freundlich model, while for yellow F3G followed Langmuir model (based on correlation coefficient, R2). Table 4 shows Langmuir constant, adsorption capacity and sorption energy of yellow F3G onto both Ni-Zn LHS and Mg-Al LDH based on Langmuir model. As shown in Table 4, sorption energy of yellow F3G onto Ni-Zn LHS (25 kJ mol-1) was smaller than Mg-Al LDH,(6.03 kJ mol-1) while adsorption capacity of Ni-Zn LHS (35.47 mg/g) bigger than Mg-Al LDH (34.07 mg/g). The bigger basal spacing of Ni-Zn LHS (13.19 Å) than Mg-Al LDH (8.59 Å) may be the main reason which can be used to predict why Ni-Zn LHS had bigger adsorption capacity and a smaller sorption energy compared to those in Mg-Al LDH.
Adsorption capacity of both adsorbents for the adsorption of yellow F3G showed better results than another adsorbent, as an example, adsorption of
disperse blue and red onto coconut shell ashes (qe
29.76 and 30.4 mg/g respectively) [13]; adsorption of disperse yellow brown onto modified bentonit with EPI-DMA (polymerpolyepicholorohydrin-dimethylamine), qe
12.36 mg/g [14] and of adsorption disperse red 60 onto
poly(p-phenylene benzobisoxalone), qe 1,046 mg/g
[15].
Adsorption of navy blue onto both adsorbents followed Freundlich adsorption isotherm model, Freundlich constant and heterogeneity as shown in Table 5. In the Freundlich model, Kfis measure of the adsorption capacity (large Kf indicate large overall capacity) [16], whereas the parameter1/nis a measure of the strength of adsorption (larger indicates a larger affinity) [17]. Freundlich constant (Kf) for adsorption navy blue onto Ni-Zn LHS was larger than Mg-Al LDH, indicating that Ni-Zn LHS has higher affinity to navy blue than Mg-Al LDH. This was proved by adsorption capacity (qe) of Ni-Zn LHS (0.075 mol/g) was bigger than Mg-Al LDH (5.23E-05 mol/g).
As shown in Table 5, n value for Ni-Zn LHS was bigger than Mg-Al LDH, indicating that heterogeneity energy of Ni-Zn LHS was larger than Mg-Al LDH. The larger heterogeneity energy of Ni-Zn LHS than Mg-Al LDH may be caused by tetrahedral sites of Zn2+that occupy above and below Ni2+ vacancy on octahedral sheet. It means Ni-Zn LHS had heterogenic surface which was different from Mg-Al LDH that had homogeny surface (only octahedral sites).
Conformation of Sorption Using FT-IR, XRD and SEM EDS
Fig 10.SEM photograh of Ni-Zn LHS before (a) and after (b) adsorption
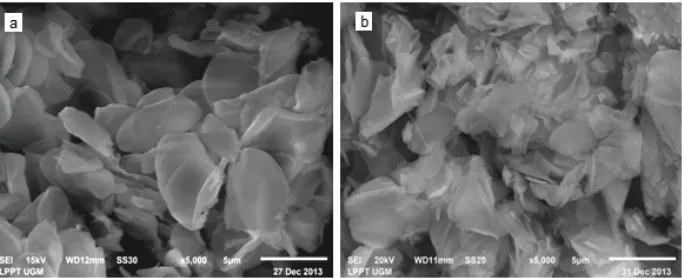
Fig 11.SEM photograh of Mg-Al LDH before (a) and after (b) adsorption
spectrum of Ni-Zn LHS and Mg-Al LDH, after sorption of dyes from the wastewater there were additional small adsorption band at 1543 cm-1 for Ni-Zn LHS and 1573 cm-1 for Mg-Al LDH. This adsorption band was attributed to the stretching vibration of aromatic CH in the structure of dyes.
The XRD pattern of Ni-Zn LHS and Mg-Al LDH showed different phenomenon after adsorption of dyes from wastewater (shown in Fig. 3B and 4B). In Ni-Zn LHS, there was main peak shown in Fig. 3A which becomes slightly broader, their intensities were smaller
and their 2θ shifted from 6.69, 13.5, 20.37° to 6.54,
13.32, 20.19°. In addition, the sorption of dyes gave an expansion on basal spacing from 13.19 Å to 13.49 Å. The expansion of basal spacing of Ni-Zn LHS indicates the sorption of dyes onto Ni-Zn LHS which was occurred not only on the surface but also on the gallery of Ni-Zn LHS.
Different from Ni-Zn LHS, after the sorption of dyes from waste water, three main peaks of Mg-Al LDH as shown in Fig. 4A became slightly sharper, their
intensities were smaller and their 2 θ shifted from 10.20,
20.12, 34.67° to 11.14, 22.9, 34.77°. As a results, the sorption did not give an expansion on basal spacing
instead reduced it from 8.59 Å to 7.94 Å. The smaller basal spacing after sorption indicates that the sorption of dyes onto Mg-Al LDH only occurred on the surface. Sorption of dyes caused Mg-Al LDH become more hydrophobic, results water molecule out from the interlayer.
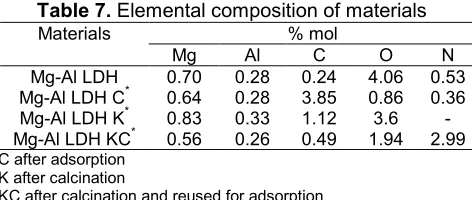
The differences between the surface morphology of both adsorbents before and after adsorption of dyes can be seen in SEM photograph (Fig. 10 and 11 for Ni-Zn LHS and Mg-Al LDH, respectively). There were a few differences before and after adsorption of dyes onto Ni-Zn LHS, may be caused by the dyes which covered the surface of Ni-Zn LHS. For Mg-Al LDH, there was agglomeration of Mg-Al LDH after adsorption as shown in Fig. 11. Adsorptions of dyes onto both adsorbents also change the % mol of EDS analysis, shown in Table 6 and 7 for Ni-Zn LHS and Mg-Al LDH respectively.
Adsorbents Regeneration
calcinations process (Fig. 3C), shows that all characteristic peaks of the layer compound collapsed and produced new materials [2]. From JCPDS data, two main peaks appearing after calcinations were ZnO
(JCPDS 36-1451) and NiO (JCPDS 44-1159), with 2θ
and basal spacing: 36.81° and 2.44 Å; 42.81° and 2.11 Å, respectively. In case of Mg-Al LDH after calcinations, XRD pattern shows that some characteristic peaks were damaged so their intensities become smaller (see Fig. 4C) because of the lost of dyes and water molecule on both surface and interlayer.
Then, the calcined adsorbents were used for adsorption of dyes from wastewater. Their adsorption capacity increased for Mg-Al LDH (from 30.5 mg/g to 84.7 mg/g) and decreased for Ni-Zn LHS (from 52.3 mg/g to 46.7 mg/g). These is caused by reconstruction structure (commonly called memory effect) occurred in Mg-Al LDH and not occurred in Ni-Zn LHS. This may be because after calcination the XRD pattern of Ni-Zn LHS showed that Ni-Zn LHS totally transformed into metal oxides (see Fig. 3C), whereas in Mg-Al LDH, the XRD pattern of Mg-Al LDH showed that layered structure was damaged after calcinations, but characteristic peaks for layered structure still exist although with small intensity (see Fig. 4C). Therefore, when Mg-Al LDH was used for dyes adsorption, the reconstruction of layered structure re-occurred. This reconstructions (memory effect) proved by XRD pattern of both calcined adsorbents (Fig. 3D and 4D). In case of the calcined Mg-Al LDH after reused, the XRD pattern showed reconstruction (like Mg-Al LDH before used as an adsorbent) and it was not shown in Ni-Zn LHS.
CONCLUSION
It was confirmed that Ni-Zn LHS and Mg-Al LDH were able to be used as adsorbent for yellow F3G and navy blue dyes in wastewater from dyeing fabric become anti NIR detector device. The sorption was predicted to occur mainly on the surface of Mg-Al LDH (adsorption capacity: 30.55 mg/g) and on interlayer of Ni-Zn LHS (adsorption capacity: 52.34 mg/g), through second order
The calcinations process decrease adsorption capacity of Ni-Zn LHS down to 46.7 mg/g but increase adsorption capacity of Mg-Al LDH up to 84.76 mg/g. The increasing adsorption capacity of Mg-Al LDH is possibly caused by memory effect that occurred in Mg-Al LDH but not occurred in Ni-Zn LHS.
ACKNOWLEDGEMENT
The author is grateful to Lembaga Pengelola Dana Pendidikan (LPDP), Minister of Finance of the Republic of Indonesia, for their financial support to this study. The author also indebted to Prof Shogo Shimazu (Department of Applied Chemistry and Biotechnology, Chiba University) for permission to using Ni-Zn LHS that synthesized in Prof. Shimazu’s laboratory as a basic material in this study.
REFERENCES
1. Hara, T., Ishikawa, M., Sawada, J., Ichikuni, N., and Shimazu, S., 2009, Green Chem., 11 (12), 2034–2040.
2. Rojas, R., Ulibarri, M.A., Barriga, C., and Rives, V., 2008, Microporous Mesoporous Mater., 112 (1-3), 262–272.
3. Arizaga, G.G.C., Satyanarayana, K.G., and Wypych, F., 2007, Solid State Ionics, 2007, 178 (15-18), 1143–1162.
4. Anonymous, Canadian WHMIS, 2011, no. SC 214917 and no. 214923, Canada.
5. Gerçel, Ö., Gerçel, H.F., Koparal, A.S., and
Öğütveren, Ü,B., 2008, J. Hazard. Mater., 160
(2-3), 668–674.
6. Santosa, S.J., Kunarti, E.S., and Karmanto, 2008,
Appl. Surf. Sci., 254 (23), 7612–7617.
7. Zaghouane-Boudiaf, H., Boutahala, M., and Arab, L., 2012,Chem. Eng. J., 187, 142–149.
9. Chang, Q., Zhu, L., Luo, Z., Lei, M., Zhang, S., and Tang, H., 2011, Ultrason. Sonochem., 18 (2), 553– 561.
10. Lv, L., He, J., Wei, M., Evans, D.G., and Duan, X., 2006,Water Res., 40 (4), 735–743.
11. Ho, Y., 2006,J. Hazard. Mater., B136 (3), 681–689. 12. Santosa, S.J., 2014, CLEAN – Soil, Air, Water, 42
(6), 760–766.
13. Isa, M.H., Lang, L.S., Asaari, F.A.H., Aziz, H.A., Ramli, N.A., and Dhas, J.P.A, 2007,Dyes Pigm., 74 (2), 446–453.
14. Li, Q., Yue, Q., Su, Y., and Gao, B., 2011,
Bioresour. Technol., 102 (9), 5290–5296.
15. Guan, Y., Mao, Y., Wei, D., Wang, X., and Zhu, P., 2013,Korean J. Chem. Eng., 30, 1810–1818. 16. Alver, E., and Metin, A.U., 2012, Chem. Eng. J.,
200-202, 59–67.