ADSORPTION ISOTHERM STUDIES ON ACID ORANGE-10 DYE REMOVAL USING CERIUM
DIOXIDE NANOPARTICLES
Harry Budiman and Oman Zuas
*Research Centre for Chemistry, Indonesian Institute of Science (RCChem-LIPI), Kawasan PUSPIPTEK Serpong, 15314 Tangerang, Banten, Indonesia
Received July 17, 2014; Accepted August 21, 2014
ABSTRACT
The adsorption capacity of AO-10 from aqueous solution onto CeO2-NPs was investigated under various
reaction parameters. Batch mode experiments were conducted to assess the potential of the CeO2-NPs as
adsorbent for the removal of AO-10 dye from aqueous solution. Equilibrium isotherm studies were carried out under an optimum reaction condition (i.e., AO-10 dye concentration = 15 mg/L, CeO2-NPS dosage = 2 g/L, pH of dye
solution = 2) obtained from this study. The equilibrium data obtained were fitted to Langmuir, Freundlich, and Redlich-Peterson isotherm models. The results shows that, the linear transform model provided the highest regression coefficient (R2 = 0.991) with the Langmuir model. The maximum monolayer adsorption capacity was found to be 33.33 mg/g at 30 °C, which is higher than some data from published literature.
Keywords:dye; adsorption; isotherms; CeO2
ABSTRAK
Kemampuan adsorpsi AO-10 dari larutan oleh CeO2NPs telah diteliti pada berbagai macam parameter reaksi.
Eksperimen dilakukan dengan metode batch untuk mengevaluasi kemampuan CeO2-NPs sebagai adsorben untuk
penghilangan AO-10 dalam larutan. Studi kesetimbangan isotermal dilakukan pada kondisi optimum reaksi yaitu konsentrasi zat warna (AO-10 = 15 mg/L, dosis CeO2-NPS = 2 g/L, pH larutan zat warna = 2). Data kesetimbangan
yang diperoleh dicocokkan dengan model isoterm Langmuir, Freundlich dan Redlich-Peterson. Hasil menunjukkan bahwa model linear memberikan nilai koefisien regresi tertinggi (R2 = 0,991) pada model Lagmuir. Kapasitas adsorpsi maksimum lapisan tunggal didapat sebesar 33,33 mg/g pada suhu 30 °C, dimana nilainya lebih tinggi dibandingkan dengan beberapa data dari literatur yang sudah terpublikasi.
Kata Kunci:zat warna; serapan; isotermal; CeO2
INTRODUCTION
Among the aqueous environmental related issues, water pollution by synthetic dyes from industries might be one of the most serious problems. As reported in many literatures, hundred thousand tons of commercial dyes are produced annually and most of them are used by industries to color their product [1-3]. Water pollution by synthetic dyes can be occurred because high percentage of colored industrial effluents is discharged directly into aqueous environment [4-5], which further can potentially threat the aqueous ecosystem because they are aesthetic pollutants, resistant to aerobic digestion, stable to light heat and oxidizing agents, and they can hinder the light penetration required for the aqueous biological processes [6-8]. In addition, the industrial effluents containing colored textile dyes may cause toxic, carcinogenic, or mutagenic for the aquatic life. In this regards, a proper treatment of industrial effluence (waste) containing textile dye before discharge
is crucial. For the treatment purposes, numerous treatment methods have been proposed including chemical coagulation, anaerobic reduction, aerobic oxidation, membrane filtration, photo-degradation and adsorption methods [3,7-10]. Among the reported technologies, the adsorption method provides an attractive technique especially if the adsorbent has high adsorption property [11]. In this regards, non-conventional metal oxide-based adsorbent have been reported to be important materials for the removal of dyes from aqueous solution such as Mg-Fe-CO3 layer double hydroxide [12], Cu-TiO2 composite [13], modified magnetic silica [14], graphene oxide-F3O4 [15], magnetic ZnFe 2O4 [16], and chitosan–ZnO nanoparticle [17].
equilibrium. The suitable isotherm model that explains the adsorption process is given separately, where the experimental data were analyzed using Langmuir, Freundlich, and Redlich Peterson isotherm.
EXPERIMENTAL SECTION
Materials
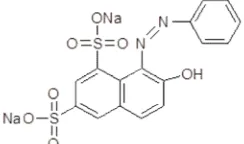
In this study, the powdered cerium dioxide nanoparticles (hereafter called CeO2-NPs) having 10-16 nm in particles diameter was the same batch with the CeO2-NPs used in our previous study [18]. Acid Orange-10 dye (AO-Orange-10, C16H10N2O7S2Na2, C.I. 16230, CAS 1936-358-4, Sigma-Aldrich) was used as a model pollutant (adsorbate) and its chemical structure is shown in Fig. 1. Acid orange is a synthetic azo dye used many staining formulation. This dye is not regarded as chronic toxic, but it can have some harmful effect including skin irritation, serious eye irritation, and respiratory irritation
[19]. Deionized water (17.5 MΩ.cm of resistivity) was
produced using a Milli-Q water purified system (Millipore Corp) and used in all experiment runs.
Procedure
Adsorption of AO-10 dye using CeO2-NPs
Adsorption testing of AO-10 dye by CeO2-NPs was conducted using batch experimental method. Typically, 0.01 g of CeO2-NPs was transferred into 15 mL capped glass tube containing 10 mL AO-10 dye solution. Subsequently, the tube was placed in a Cetromat WR temperature-controlled water bath shaker and agitated (140 rpm) at a certain time. All of the experiments were carried out at 140 rpm at 30 °C. Afterward, supernatant solution was separated from the adsorbent by centrifugation at 2500 for 5 min using IEC Centra CL2 Thermo centrifuge. In order to determine the residue of AO-10 in solution, the absorbance of supernatant
solution was measured at maximum wavelength (λmaks):
480 nm using Hitachi U-2000 UV-Vis spectrophotometer. Parameter of adsorption experiment including initial concentration of AO-10 dye (15-60 mg/L), adsorbent
hydrochloric acid solution (0.1 N) and sodium hydroxide solution (0.1 N). Effect of ionic strength was conducted using NaCl salt with concentration ranging from 0 to 0.7 mol/L.
Analytical measurement of AO-10 dye
concentration
The concentration of residue of AO-10 dye in the solution was determined by inserting the absorbance of the AO-10 sample solutions into AO-10 calibration curve. The calibration curve of the AO-10 was made by plotting the absorbance of AO-10 standard solutions versus their concentration. A high linearity of the calibration curve was found at maximum 30 mg/L of AO-10 dye, giving an expression: A = 0.029C-0.011, where A and C are the absorbance and concentration of the AO-10 standard solutions, respectively, with coefficient regression (R2) was found to be 0.999.
The percentage removal (%-R) of the AO-10 dye was calculated using Eq. 1, while the amount of dye adsorbed at equilibrium (qe) was calculated from the mass balance equation (Eq. 2):
o t
o
C -C
%-R = x 100
C
(1)
e o e
q = C - C V m (2)
where Co (mg/L) is initial concentration of AO-10 dye solution, Ct(mg/L) concentration of dye after time t(min), Ce is the liquid phase dye concentration at equilibrium (mg/L); V is volume of dye solution used (L) and m is the mass of sorbent used (g).
pH point of zero charge
Fig 2.The effect of initial concentration of AO-10 dye on the adsorption activity of CeO2-NPs
Fig 3. The effect of CeO2-NPs dosage on the percentage removal AO-10 dyes
Fig 4.The pHPZCof CeO2-NPs
Fig 5. The effect of initial pH on the percentage removal AO-10 dye
(this measured pH values were counted as the final value). The pHpzcwas taken from the diagonal line of the curve of the final pH versus initial pH.
RESULT AND DISCUSSION
Effect of Reaction Parameters
Effect of initial dye concentration
The effect of initial concentration of AO-10 dye (15-60 mg/L) on CeO2-NPs adsorption activity was studied at fixed pH 6 at 30 °C, and the result is shown in Fig. 2. As it can be seen from Fig. 2, the percentage removal of AO-10 dye decreased from 100% to 40% by increasing of AO-10 dye concentration from 15 to 60 mg/L. At the lowest concentration (15 mg/L), adsorbate molecules covered all surface active sites of CeO2-NPs so that the highest percentage removal of dye could be obtained. On the other hands, the percentage removal of AO-10 dye decreased at higher concentration because the entire surface active sites of adsorbent were saturated by adsorbate. The fully occupation of the surface active sites by the adsorbate may delay the adsorption
process while a high amount of adsorbate molecules were remained in the bulk solution [22-23].
Effect of adsorbent dosage
The effect of adsorbent dosage on the adsorption of AO-10 dye was investigated by varying the weight of CeO2-NPs ranging from 0.25 to 2 g/L, and the result is presented in Fig. 3. It was obviously observed from Fig. 3 that percent removal of AO-10 dye increased from 15% to 99% by increasing the dosage of CeO2-NPs from 0.25 to 2 g/L. Increase of the adsorbent dose may contribute to the more availability of the active sites for the adsorption process [24].
Effect of initial pH
Fig 6. Time dependency of the AO-10 dye adsorption onto CeO2-NPs
Fig 7.Effect of ionic strength on the adsorption of AO-10 dye onto CeO2-NPs
the adsorbent and net surface charge of the adsorbent in solution [25-26]. Experimentally, the pHpzc of CeO2-NPs was found to be about 6, as shown in Fig. 4. It was highlighted in previous studies [27-28] that the surface of adsorbent positively charged when pH solution < pHpzc, and negatively charged when pH solution > pHpzc.
Moreover, the effect of initial pH on the adsorption activity of CeO2-NPs was investigated in the pH ranging from 2 to 10 and the result is shown in Fig. 5. From the Fig. 5, it was found that the highest percentage removal of AO-10 dye was found at pH 2 and then decreased with the increase of pH of the AO-10 dye solution. In a solution, the AO-10 dye is preferably dissociated to ion Na+and sulfonate group (RSO3-) with pKa value of AO-10 dye solution is 12.5 [29-30]. Consequently, the RSO3
-of AO-10 dye has negative charged because the RSO3
-could be protonated by H+ at pH difference of solution (2-10) < pKa [25-26,28]. At lower pH (acidic), the surface of adsorbent become more positively charged (pH < pHpzc) lead to increase the percentage removal due to strengthening the attractive forces between adsorbate and adsorbent. On the other hands, the surface of adsorbent become more negatively charge along with the increase of pH solution (pH > pHpzc) lead to decrease the adsorption ability of adsorbent. This decrease phenomenon was due to stronger of the repulsion forces between adsorbate and adsorbent.
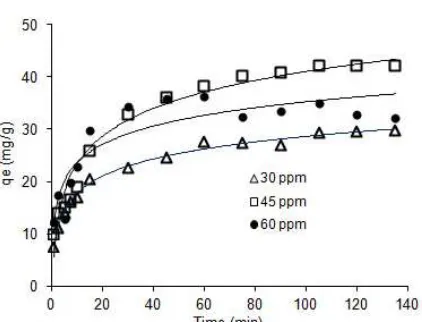
Effect of adsorption time
Fig. 6 shows a time dependency of the adsorption at difference of AO-10 dye concentration. As can be seen from Fig. 6, the adsorption of AO-10 dyes was found to increase with time and achieved its equilibrium after 120 min. Typically, the adsorption of AO-10 dye was rapidly occurred at the first 20 min which was probably due to the presence of large amount accessible surface active sites on CeO2-NPs. After that, the rate of adsorption process was slowly increasing. This slow increase might be due to huge number of surface active
sites have been covered by the AO-10 dye molecules, where this condition induces the occurrence of the repulsion forces between adsorbate at solid-solution interface [16,23]. Moreover, no considerable change on the amount of AO-10 dye adsorbed after 120 min, suggesting that the equilibrium process has been achieved.
Effect of ionic strength
Fig. 7 demonstrates the effect of ionic strength on the adsorption of AO-10 dye onto CeO2-NPs. It can be observed from Fig. 7 that the percentage removal of AO-10 dye decreased with increasing the concentration of NaCl in solution. In the solution, the Na+ ions originated from NaCl has not only neutralized the negative charge of RSO3
-group in AO-10 dye, but also results more positive charge of the surface of CeO2 -NPs. Such conditions were responsible to reduce the attractive forces between adsorbate molecules and adsorbent. This phenomenon in line with the assumption that the increase of ionic strength by the existence of NaCl in the solution may cause decrease the adsorption capacity of the adsorbate when an attractive of electrostatic interaction is occurred between adsorbate and adsorbent [16].
Adsorption Isotherm
Fig 8. Langmuir isotherm model for the adsorption of AO-10 dye onto CeO2-NPs
Fig 9. Freundlich isotherm curve for the adsorption of AO-10 dye onto CeO2-NPs
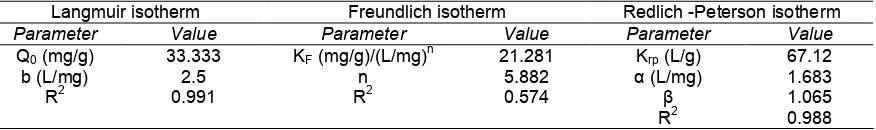
Table 1.Isotherm constant of the models for the adsorption of AO-10 dye onto CeO2-NPs
Langmuir isotherm Freundlich isotherm Redlich -Peterson isotherm
Parameter Value Parameter Value Parameter Value
Q0(mg/g) 33.333 KF(mg/g)/(L/mg)n 21.281 Krp(L/g) 67.12
b (L/mg) 2.5 n 5.882 α (L/mg) 1.683
R2 0.991 R2 0.574 β 1.065
R2 0.988
Langmuir isotherm
Langmuir isotherm is an adsorption model. This isotherm model takes an assumption that the monolayer adsorption occurs at specific homogenous sites within the adsorbent, which expressed by the Eq. (3).
0
where qe (mg/g) is the amount of dye adsorbed per unit mass of adsorbent, Ce(mg/L) is the concentration of AO-10 dye remaining in the solution after equilibrium. Q0 is the maximum amount of required to form a complete monolayer on the adsorbent surface at high Ce. The b is the constant related to the affinity of the binding sites (L/mg). The linear equation of the Langmuir model can be expressed by Eq. (4).
e e
e 0 0
C 1 C
= +
q Q b Q (4)
Fig. 8 shows the linear graphics of specific adsorption (Ce/qe) against the equilibrium concentration (Ce). This relationship clarifies that the adsorption of AO-10 dye on the surface of CeO2-NP is in agreement with the Langmuir model. The Langmuir constant, Q0 and b were determined from the slope and intercept of the linear plot of Fig. 8. The important characteristic of Langmuir isotherm is a dimensionless constant separation (RL) which is expressed in the Eq. (5).
where C0is the highest initial concentration of adsorbate (mg/L), and b is the constant of Langmuir. The shape of Langmuir isotherm is indicated by the value of RL
includes unfavorable (RL > 1), linear (RL= 1), favorable (0 < RL< 1), or irreversible (RL = 0) [31]. In this study, the value of RL was found to be 0.00662, demonstrating that the shape of Langmuir isotherm model for the adsorption of AO-10 dye onto CeO2-NPs is favorable. Parameters characteristic of the Langmuir isotherm model obtained in this study are listed in Table 1.
Freundlich isotherm
Freundlich isotherm is an empirical equation for describing single-component adsorption on heterogeneous surfaces due to due to the variation of functional group presence in the surface. Consequently, the interaction between adsorbate and adsorbent is occurred at different affinity [31-32]. The equation of the Freundlich isotherm model is given by the Eq. (6).
1 n e f e
q = K C (6)
Fig 10. Redlich-Peterson isotherm for the adsorption of AO-10 dye onto CeO2-NPs
e f e
1
logq = logK + logC
n
(7)
The value of Kf and n are listed in Table 1, which was calculated from the intercept and the slope of the linear graphic of the Fig. 9.
Redlich Peterson isotherm
Redlich-Peterson isotherm is the adsorption model which is used to compromise the limitation of both the Langmuir and Freundlich isotherm models. Thus, the equation of the Redlich-Peterson model combines parameters from the Langmuir and Freundlich model. The adsorption mechanism of Redlich-Peterson model follows a non ideal monolayer adsorption that is a hybrid mechanism from the Langmuir and Freundlich isotherm [28,33]. Redlich-Peterson model is expressed by the Eq. 8.
rp e
e β
e
K C q =
1 +αC (8)
where qe is the amount of adsorbate adsorbed per unit mass of adsorbent (mg/g), Ce is the adsorbate concentration remained in solution after equilibrium (mg/L). The Redlich-Peterson isotherm constants including Krp (L/g), α (L/mg), and β can be determined
from the Eq. 8. The β value is exponential value range
from 0 to 1. Adsorption model follows the Langmuir
model when the β value is 1, while when the β value is
0, the adsorption model follows the Henry’s law.
rp ee e
K C
ln - 1 =β ln C + ln α
q
(9)
The values of Krp, α, and β were calculated from intercept and slope of the linier plot in the Fig. 10 and the results are listed in Table 1. Based on the data as listed in Table 1, correlation coefficient of isotherm Langmuir model (R2: 0.991) is higher than Freundlich and Redlich-Peterson model, indicating that the adsorption of AO-10 dye onto CeO2-NPs had good agreement with the Langmuir isotherm. Thus, it can be suggested that the AO-10 dye was absorbed on the homogenous surface active site of adsorbent via a development of monolayer adsorbate mechanism. The adsorption capacity of monolayer generated by the Langmuir model was found to be 33.33 mg/g at 30 °C
Table 2 compares the adsorption capacities of the synthesized CeO2-NPs with various types of adsorbent for AO-10 dye removal. As can be seen, the adsorption capacity of CeO2-NPs for AO-10 adsorption is 33.33 mg/g, which was higher thanThespesia populneapods carbon, bagasse fly ash, saw dust, and waste sugarcane bagasse carbon. On the other hands, the value of Q0 of CeO2-NP is smaller than Mg-Fe-CO3 layer double hydroxide and monoamine modified magnetic silica (MAMMS). This finding indicates that the CeO2-NPs was more efficient as adsorbent for AO-10 dye removal than other as listed in Table 1, except for Mg-Fe-CO3 and monoamine modified magnetic silica (MAMMS) adsorbent.
CONCLUSION
REFERENCES
1. Priya, M.S., Divyashree, K., Goswami, C., Prabha, M.L., and Babu, A.K.S., 2013, Int. J. Eng. Adv. Technol., 2 (4), 913–918.
2. Pavanelli, S.P., Bispo, G.L., Nascentes, C.C., and Augusti, R., 2011,J. Braz. Chem. Soc., 22 (1), 111– 119.
3. Annadurai, G., Juang, R.S. and Lee, D.J., 2002, J. Hazard. Mater., B92, 263–274.
4. Olaniyi, I., Raphaeel, O., and Onyebuchi, N.J., 2012, Arch. Appl. Sci. Res., 4 (1), 406–413.
5. Rasul, M.G., Faisal, I., and Khan, M.M.K., 2006,Int. J. Environ. Pollut., 28 (1-2), 144–161.
6. Namasivayam, C., Radhika, R., and Suba, S., 2001, Waste Manage., 21 (4), 381–387.
7. Hariharan, C., 2006,Appl.Catal., A, 304, 55–61. 8. Sun, Q., and Yang, L., 2003, Water Res., 37 (7),
1535–1544.
9. Nigam, P., Banat, I.M., Singh, D., and Marchant, R., 1996,Proc. Biochem., 31 (5), 435–442.
10. Pandit, P., and Basu, S., 2004, Ind. Eng. Chem. Res., 43 (24), 7861–7864.
11. Masykur, A., Santosa, S.J., Siswanta, D., and Jumina, 2014,Indo. J. Chem., 14 (1), 63–70.
12. Abdelkader, N.B-H., Bentouami, A., Derriche, Z., Bettahar, N., and de Ménorval, L.-C, 2011, Chem. Eng. J., 169 (1-3), 231–238.
13. Zuas, O., and Budiman, H., 2013, Nano-Micro Lett., 5 (1), 26–33.
14. Atia, A.A., Donia, A.M., and Al-Amrani, W.A., 2009, Chem. Eng. J., 150 (1), 55–62.
15. Meral, K., and Metin, O., 2014,Turk. J. Chem., 1–8. 16. Konicki, W., Sibera, D., Mijowska, E.,
Lendzion-Bieluń, Z., and Narkiewicz, U., 2013, Colloid
Interface Sci., 398, 152–160.
17. Salehi, R., Arami, M., Mahmoodi, N.M., Bahrami, H., and Khorramfar, S., 2010, Colloids Surf., B, 80 (1), 86–93.
18. Zuas, O., Abimanyu, H., and Wibowo, W., 2014, Proc. Appl. Ceram., 8 (1), 39–46.
19. AMRESCO Safety Data Sheet of Acid Orange 10, 2014, http://www.amresco-inc.com/media.acux?path=/
media/products/msds/MSDS-E783.pdf, accessed on 4 June 2014.
20. Lopez-Ramon, F.M., Stoeckli, V., Moreno-Castilla, C., and Carrasco-Marin, F., 1999, Carbon, 37 (8), 1215–1221.
21. Al-Degs, Y.S., El-Barghouthi, M.I., El-Sheikh, A.H., and Walker, G.M., 2008, Dyes Pigm., 77 (1), 16– 23.
22. Khezami, L., and Capart, R., 2005,Hazard. Mater., 123 (1-3), 223–231.
23. Ghaedi, M., Heidarpour, Sh., Kokhdan, S.N., Sahraie, R., Daneshfar, A., and Brazesh, B., 2012, Powder Technol., 228, 18–25.
24. Garg, V.K., Gupta, R., Yadav, A.B., and Kumar, R., 2003,Bioresour. Technol., 89 (2), 121–124.
25. Khare, P., and Kumar, A., 2012,Appl. Water Sci., 2 (4), 317–326.
26. Dursun, G., Ciçek, H., and Dursun, A.Y., 2005, J. Hazard. Mater., 125 (1-3), 175–182.
27. Dąbrowski, A., Podkościelny, P., Hubicki, Z., and
Barczak, M., 2005, Chemosphere, 58 (8), 1049– 1070.
28. Liu, Q.-S., Zheng, T., Wang, P., Jiang, J.-P., and Li, N., 2012,Chem. Eng. J., 157 (2-3), 348–356. 29. Cheung, W.H., Szeto, Y.S., and Mckay, G., 2009,
Bioresour. Technol., 100 (3), 1143–1148.
30. Mall, I.D., Srivastava, V.C., and Agarwal, N.K., 2006,Dyes Pigm., 6 (3), 210–223.
31. Tan, L.A.W., Ahmad, A.L., and Hameed, B.H., 2009,J. Hazard. Mater., 164 (2-3), 473–482. 32. Hameed, B.H., and El-Khaiary, M.I., 2008, J.
Hazard. Mater., 157 (2-3), 344–351.
33. Ho, Y-S., Malarvizhi, R., and Sulochana, N., 2009, J. Environ. Prot. Sci., 3, 111–116.
34. Arulkumar, M., Sathishkumar, P., and Palvannan, T., 2011,J. Hazard. Mater., 186 (1), 827–834. 35. Singh, J., Uma, Mishra, N. S., Banerjee, S.,
Gusain, D., and Sharma, Y.C., 2011, Appl. Sci. Environ. Sanit., 6 (3), 2732–2743.