Hardness Prediction Based On P-h Curves
And Inverse Material Parameters Estimation
I Nyoman Budiarsa
1, a1Mechanical Engineering. University of Udayana.Bali. Indonesia aEmail: [email protected]
Keywords: Finite Element Model, Indentation, P-h Curve, HV, HRB
Abstract. The Finite Element model of Vickers indentation has been developed. The model was validated against published testing data. An approach to predict the P-h curves from constitutive material properties has been developed and evaluated based the relationship between the curvature and material properties and representative stress. The equation and procedure established was then successfully used in predict the full Vickers indentation P-h curve. FE Spherical indentation models of different radius have been developed and replay file model was developed that is able to produce data of different materials properties. Two new approaches to characterise the P-h curves of spherical indentation have been developed and evaluated. One is the full curve fitting approach while the other is depth based approach. Both approaches were proven to be adequate and effective in predicting indentation P-h curves. The concept and methodology developed is successfully used to predict hardness values (HV and HRB) of materials through direct analysis and validated with experimental data on selected sample of steels. The approaches (i.e. predict hardness from P-h curves) established was successfully used to produce hardness values of a wide range of material properties, which is then used to establish the relationship between the hardness values (HV and/or HRB) with representative stress. This provided a useful tool to evaluate the feasibility of using hardness values in predicting the constitutive material parameters with reference to accuracy and uniqueness by mapping through all potential materials ranges
Introduction
Many works has been explored in searching a way to inversely predict material properties from indentation tests [1]. Most of the research has been focusing on using full P-h curves [2] while the links established between the hardness and constitutive materials properties are mostly based on empirical data. For example, for elasto-plastic metals, most of the property-hardness data available had been mainly using strength (yield strength and ultimate tensile strength) [3] as it is difficult to quantify the contribution of the work hardening coefficient. This is not ideal, as increasingly, the work hardening coefficient is required for situation where a detailed FE model is required. An established link between materials properties, indentation curves and hardness values would also provide a useful tool to explore the feasibility of predicting both yield strength and work hardening coefficients based on hardness values and establish a full understanding with confidence about the issue such as uniqueness (with only one set of material properties it the testing results) or non-uniqueness (more than one sets of material properties fit the testing results), which has been a major problem of inverse material properties identification. The ability of identification of all possible candidate material property sets that match the testing results will also pave the way for future improvement of inverse program by using additional measurable data.
Materials and Experimental
Material used in this research were carbon steel with various compositions of carbon content (0.10 % C, 0.54 % C and 0.85 % C). The tensile tests were performed using a material testing machine with extensometer. Sample steel used is solid rod-shaped elliptical of 5 mm in diameter and 90 mm long has a holder on the edges. The samples were sectioned, mounted in resin before
Applied Mechanics and Materials Vol 776 (2015) pp 233-238 Submitted: 2015-02-13 © (2015) Trans Tech Publications, Switzerland Accepted: 2015-04-10 doi:10.4028/www.scientific.net/AMM.776.233
being polished with diamond paste. The Rockwell hardness test was performed using: Wilson Rockwell hardness tester (ACCO Wilson instrument division, USA). The indentation using spherical indenter B scale, with R= 0.79 mm (Diameter steel ball =1/16 in). For Vickers hardness tester using a direct load method. The indenter is in the form of right pyramid with a square base
and angle of 136o between opposite face. The load range available is from 98.07mN to 19.61 N. On
the Vickers hardness tester, the hardness is measured as the diagonal diamond impression load on the specimen displayed directly on the LCD touch panel display. The accuracy of the measurement of the diagonal length has been checked with an optical microscope. One of the samples (0.54% carbon) was processed through different heat treatments (annealing, quenching and tempering). The
sample was normalised at 8400 C, then annealed, quenched and tempered at T=2000 C, T= 4000 C
and T= 6000 C. This will effectively generate material samples with different hardness to modulus
(H/E) ratios as the Young’s modulus of steel doesn’t significantly with the heat treatments. These hardness data (HV and/or HRB) be used to validate the representative stress based hardness evaluation and property prediction program to be developed.
Numerical Model and Results
Finite element model (FE model) of the Vickers indentation designed using commercial code ABAQUS. The Vickers indenter has the form of the right pyramid with a square base and an angle
of 136 between opposite face. Only a quarter of the indenter and material column was simulated
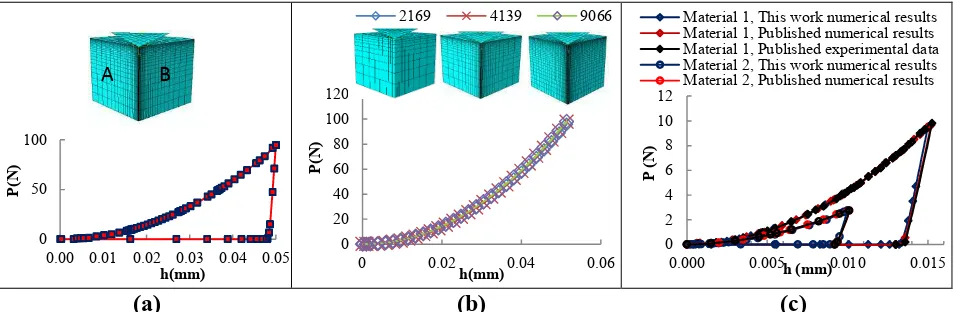
as a result of plane symmetric geometry. The sample size is more than 10 times the maximum indentation depth, which is sufficiently large to avoid any sample size effect or boundary effect[4] The bottom face of the material volume was fixed in all degrees of freedom (DOF) and two side faces (A and B) Fig. 1(a). Were symmetrically fixed in y and x direction. The element type used is C3D8R (reduced integration element used in stress/displacement analysis). Fig.1(b). Contact was defined at indenter-specimen interface with a friction coefficients of 0.2. The FE model of Vickers indentation test was verified by comparing the numerical results from this work with some published modelling and experimental results. Typical result is shown in Figure 1(c). The materials properties in the FE model were adopted from the data used by [1], and then the predicted P-h
curves were compared to the published numerical and experimental data. As shown in the curves, for both materials, the predicted results agree well with the experimental data. This suggests that the model is accurate and valid.
(a) (b) (c)
Figure 1(a). FE model of the Vickers indentation and P-h curve (b). Typical Effect of frictional
conditions on modelling. (c). Comparison of numerical results with some published experimental
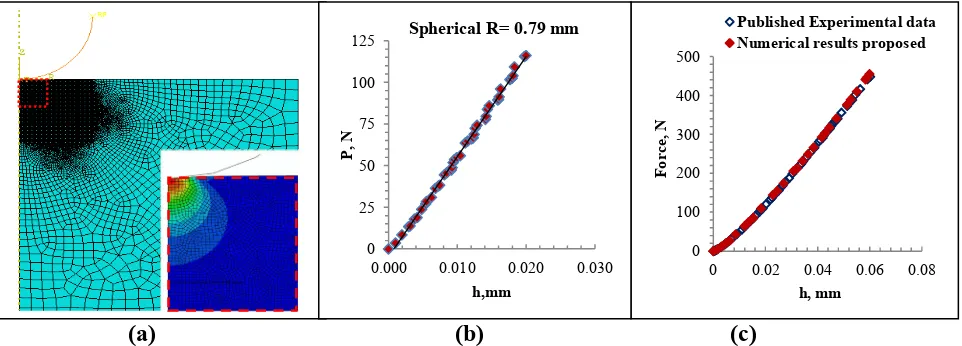
Figure 2(a). shows the FE model of Spherical indentation. A 2-D axial symmetric model was used due to the symmetry of the spherical indenter. The indenter was assumed to be rigid body as it is much harder than the indented material. The type element of the material is standard axial symmetric element: CAX4R and CAX3 (4-node bilinear asymmetric quadrilateral and 3-node linear asymmetric triangle element). The movement of the indenter was simulated by displacing a rigid
0 50 100
0.00 0.01 0.02 0.03 0.04 0.05
P( N ) h(mm) 0 20 40 60 80 100 120
0 0.02 0.04 0.06
P(
N
)
h(mm)
2169 4139 9066
0 2 4 6 8 10 12
0.000 0.005 0.010 0.015
P
(N
)
h (mm)
Material 1, This work numerical results Material 1, Published numerical results Material 1, Published experimental data Material 2, This work numerical results Material 2, Published numerical results
arc (rigid body) along the Z axis. In the model, the sample size can be changed to ensure that the sample is much larger than the indenter radius/contact area during the indentation to avoid potential sample size and boundary effects [4]. The thickness and width of the model used is 3mm in both side. The bottom line of the model was fixed in all degree of freedoms (DOF) and the central line was symmetrically constrained. Figure 2(b). shows typical P-h curve (Force vs. Indentation depth) during loading and unloading phase of a typical elastic-plastic materials with different indenter sizes. The loading curve represents the resistance of material to indenter penetration, while difference between the loading and unloading curve represents the energy loss [5] Figure 2(c) shows the comparison between the FE force-displacement data and corresponding result using a known analytical solution for indentation of linear elastic materials As shown in the figures, the FE results show a good agreement with the analytical solution.
(a) (b) (c)
Figure 2(a).FE Model of the spherical indentation and graph of plastic zone expansion during spherical indentation (b). Typical force indentation depth (P-h) curves for the spherical indentation (c).Comparison of numerical results with published experimental data of indentation with a spherical indenter (R=1.25 mm)
Inverse Material Properties Prediction Based On Vickers and HRB Hardness Values
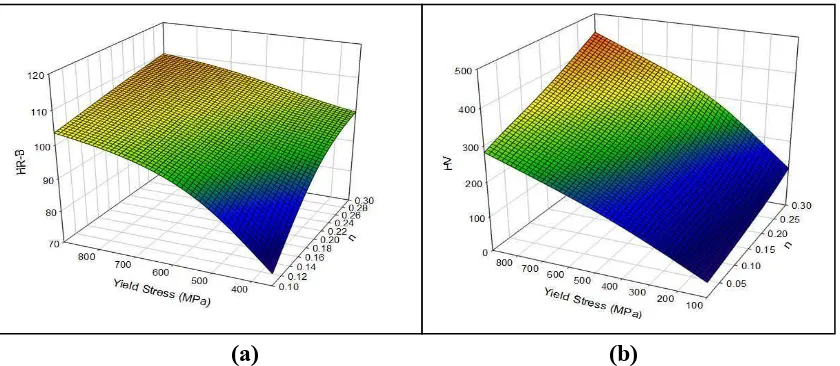
The work presented showed that hardness can be related to the stress of the indented material, σr, corresponding to a representative strain, εr, which represents the mean plastic strain after yielding and the hardness values can be predicted based on the indentation P-h curves [2], Base on the concept prediction developed, it is implied that the hardness values could be potentially being directly linked to the representative stresses over the material ranges studied. This is investigated by firstly determine the HV or the HRB values of materials over a wide range of properties, then a direct Hardness- representative stresses (σr) relation is explored using data fitting process. Figure 3(a) plots the HRB data against the constitutive material properties (yield stress(σy) and the work hardening efficient(n)). Figure 3(b). Shows the surface plot of HV vs material properties (σy and n). In Nonlinear Regression relationship between hardness - constitutive material properties can be formulated as:
HRB=111.67
e
. ...
.
(1)
HV =26.62 E+06
e
. . ..
.
(2)
If εr is a particular plastic strain point, the stress at the point representative stress, σr At this plastic strain point, the stress can also be expressed as:
0 100 200 300 400 500
0 0.02 0.04 0.06 0.08
Fo
rc
e,
N
h, mm
Published Experimental data Numerical results proposed
0 25 50 75 100 125
0.000 0.010 0.020 0.030
P,
N
h,mm
Spherical R= 0.79 mm
σr = σy 1 + εr (3)
The curve could be simplified as a linear line with an equation of :
HRB = 0.0748 ln (
.
)
-0.2945 (4)HV= 0.3115 σr + 11.186 (5)
These relationships (Eq.4 and 5) established allow direct hardness prediction from material properties. This is assessed using the two steel materials as example, the predicted HV and HRB showed a similar level of agreement with the experimental data. In the case of the 0.1 C Steel, the hardness value is 98.368% of the measured value; the HRB values is within 107% of the measured value; In the case of Mild steel, the predicted Hv value is within 98.611% of the measured value, HRB is within 102% of the measured value. Similar agreement has been found in other materials (within 5% error range). This suggests that these can be used to predict the hardness values with sufficient accuracy with the measurement error ranges.
(a) (b)
Figure 3(a) Surface plot of the HRB (b). HV data over a wide range of material properties (σy, n).
Furthermore the work carried out to investigate the feasibility of using the hardness values to predict the Yield stress and the work hardening coefficients with a particular focus on uniqueness issue making use of the methodologies and equations established in this work. The simulation space included a group of hardness data covering a wide range of material properties. In this process, a simulation space can be constructed conveniently using the representative stress approach (Eq.4 and 5). In this work, the yield stress was varied from 100 to 900 MPa with an increment of 10MPa. The strain hardening coefficients used were from 0.01 to 0.3 with an increment of 0.01. This covers over 2400 hardness data for Hv and HRB respectively. The results were then recorded and stored into a database to form a simulation space. In each case, the optimum material parameters, which produces the P-h curves match or close to the experimental results (in this case, hardness values), were determined by mapping the objective function (Eq. 6) [6]
G= ( ) ( )
( ) (6)
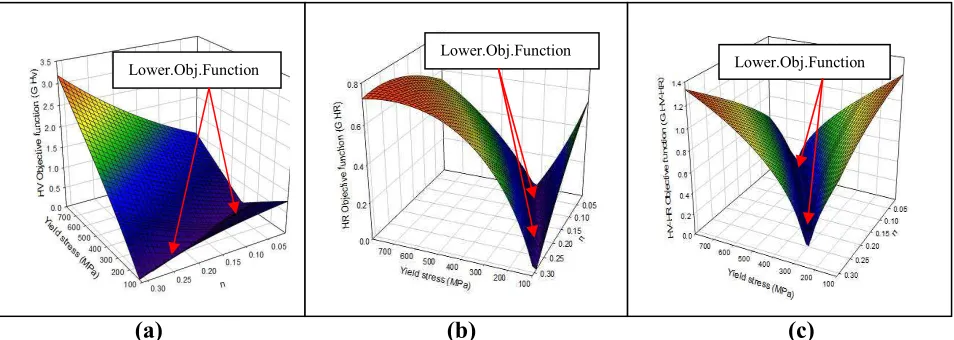
function vs. material parameters of hardness value HV and Fig.4(b) hardness value HRB. The contour band represents different objective function values. The figure shows that many sets of material properties have very close objective function values at the valley, which suggests that there are a large group of materials that can produce hardness value matching the experimental data. whereas in the surface plot of objective functions vs. material parameters for the dual indenter approach. As shown in the Figures 4(c), for both materials, there are still many sets of material properties with very close objective function values at the valley. It clear shows that there are a large group of material which give similarly Hv and HRB values in both cases.
(a) (b) (c)
Figure 4(a) Show the surface plot of objective function vs. material parameters of HV for the 0.1%C Steel. (b) HRB for the 0.1% C Steel. (c) surface plot of objective functions vs. material parameters for the dual indenter approach (HV and HRB) for the 0.1% C Steel.
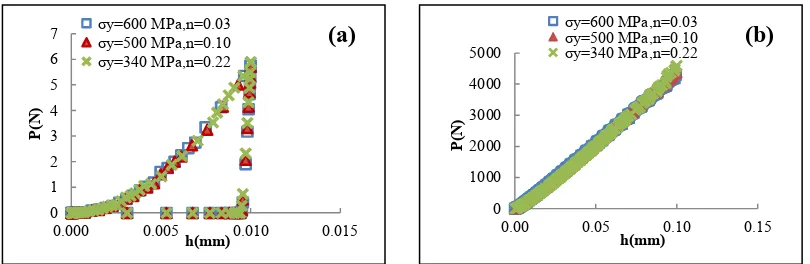
Figure 5(a) plots the materials sets taken at the valley of Figure 4(a) and 4(b). These data represent the material sets that have similar HV values and HRB values close to the experimental data of mild steel (within 1%). The data for the Vickers hardness is much scattered while there are many material data with low objective function for HRB. It is interesting to see that, even though, the shape of the indenters and the way the hardness has been calculated is different between HV and HRB, but the data with low objective function falls on a similar straight line. This explains why there is no improvement with the dual indenter approach. Figure 5(b) shows the stress strain curves of the selected material property sets (σy, n) from Figure 5(a). It is clearly shown that all these materials sets go through the same point with similar representative stress. Figure 6(a) plots the loading and unloading curves of Vickers indentation from FE indentation model. It is clearly shown that both the loading and the unloading cures are close to identical. Figure 6 (b) shows the loading curves of the Rockwell hardness; again, the P-h curves are almost identical. These suggest that there are multiple materials that have the same HV and HRB values.
(a) (b)
Figure 5(a) Materials sets with an objective function within 1%. (b) Comparison between the stress-strain curves of selected material sets with similar objective function
Lower.Obj.Function Lower.Obj.Function Lower.Obj.Function
0 500 1000 1500
0.00 0.20 0.40
St re ss , σ y (M pa ) Strain, Є σy=600 MPa,n=0.03 σy=500 MPa,n=0.10 σy=340 MPa,n=0.22 0 100 200 300 400 500 600 700
0 0.1 0.2 0.3 0.4
Y ie ld S tr es s ( M Pa ) n
Mild Steel (Hv) Mild Steel (HRB)
Figure 6(a) Comparison of P-h curves with material sets of similar low objective function of the Vickers hardness and (b) of the Spherical indentations
The work clearly highlighted that uncertainty of uniqueness is a major challenge for the application of inverse modelling, which has been the main concern of inverse modelling based on the indentation approach [1,7] If the physical process is non unique, in a search based method. the results may converge to a point (material sets) at a local minimal rather than globe minimal point, thus identify the wrong properties. For elasto-plastic materials, the method used in this work could effectively to identify any possible material property sets with the same hardness by using the representative stress method rather than repeating limited number of FE modelling.
Summary
A new method to predict the P-h curves from constitutive material properties has been developed and evaluated for both Vickers and spherical indentation. the models developed for P-h curve prediction are further applied to determine HV and Rockwell hardness values. The predicted hardness values are compared with the experimental data. The program is then used to produce hardness data over a wide range of material properties providing a simulation space to establish the relationship between hardness (HV and/or HRB) and representative stress. This is used to evaluate the feasibility of using hardness values in predicting the constitutive material parameters with particular focus on the uniqueness of the results by mapping through a large number of potential materials. The identification of all potential materials set will effectively narrow the material searching range and provide the possibility to identify the true material based pre-knowledge or other measurable data
References
[1] Dao M., Chollacoop N., Van Vliet K. J., Venkatesh T. A. and Suresh S., Computational modelling of the forward and reverse problems in instrumented sharp indentation, Acta Materialia, Vol. 49 (2001) pp. 3899–3918
[2] Budiarsa I N., Jamal M., P-h Curves and Hardness Value Prediction for Spherical Indentation Based on the Representative Stress Approach, App. Mech.and Mat. Vol. 493 (2014) pp 628-633 [3] Busby J. T., Hash M. C., Was G. S., The relationship between hardness and yield stress in
irradiated austenitic and ferritic steels, Journal of Nuclear Materials 336 (2005) 267-278 [4] Johnson K. L., Contact Mechanics, Cambridge: Cambridge University Press, UK, 1985
[5] Swaddiwudhipong S., Tho K. K. , Liu Z. S. and Zeng K., Material characterisation based on dual indenters, International Journal of Solids and Structures, Vol. 42 (2005) pp. 69-83
[6] Bolzon G., Maier G., Panico M.,Material model calibration by indentation, imprint mapping and inverse analysis, Inter. Journal of Solids and Structures, Vol. 41 (2004) pp. 2957-2975.
[7] Chen X., Ogasawara N., Zhao M. and Chiba N., 2007, On the uniqueness of measuring elastoplastic properties from indentation: The indistinguishable mystical materials, Journal of the Mechanics and Physics of Solids 55, (2007) pp. 1618–1660
0 1 2 3 4 5 6 7
0.000 0.005 0.010 0.015
P( N ) h(mm) σy=600 MPa,n=0.03 σy=500 MPa,n=0.10 σy=340 MPa,n=0.22 (a) 0 1000 2000 3000 4000 5000
0.00 0.05 0.10 0.15
P( N ) h(mm) σy=600 MPa,n=0.03 σy=500 MPa,n=0.10
Hardness Prediction Based On
P-h Curves And Inverse Material
Parameters Estimation
by
I Nyoman Budiarsa
FILE
TIME SUBMITTED 06-JUN-2015 01:58PM SUBMISSION ID 548513828
WORD COUNT 3223 CHARACTER COUNT 16502
12
%
SIMILARITY INDEX
6
%
INTERNET SOURCES
8
%
PUBLICATIONS
1
%
STUDENT PAPERS
1
3
%
2
2
%
3
1
%
4
1
%
5
1
%
6
1
%
Material Parameters Estimation
ORIGINALITY REPORT
PRIMARY SOURCES
www.scientific.net
Internet Source
"Proceedings of the 13th International
Conference on Metal Forming", steel
research international, 09/2010
Publication
www.nano.nsysu.edu.tw
Internet SourceBucaille, J.L.. "Determination of plastic
properties of metals by instrumented
indentation using different sharp indenters",
Acta Materialia, 20030402
Publication
Jiang, G.Q., C. Xu, M. Xun, and J. Wang. "The
Mode Analysis of Coherently Coupled Array
Based on Proton Implantation", Applied
Mechanics and Materials, 2015.
Publication7
<
1
%
8
<
1
%
9
<
1
%
10
<
1
%
11
<
1
%
in 5754 Alloys by Using Nuclear, Electrical
and Mechanical Methods", Defect and
Diffusion Forum, 2012.
Publication
X. X. Su. "Rapid Identification of Nonlinear
Material Parameters of Foams Based on
Neural Network", IFMBE Proceedings, 2010
Publication
Roopa, T.S., H. Narasimha Murthy, K.
Sudarshan, O.R. Nandagopan, Ajith Kumar,
M. Krishna, and Gangadhar Angadi.
"Mechanical properties of vinylester/glass
and polyester/glass composites fabricated by
resin transfer molding and hand lay-up",
Journal of Vinyl and Additive Technology,
2014.
Publication
Yao, Weizhi. "Crystal plasticity study of single
crystal tungsten by indentation tests",
Universität Ulm. Fakultät für
Ingenieurwissenschaften und Informatik,
2013.
Publication
etd.lsu.edu
Internet Source
12
<
1
%
13
<
1
%
14
<
1
%
15
<
1
%
16
<
1
%
17
<
1
%
research.cens.ucla.edu
Internet Source
Sacksteder, Irène. "Instrumented Indentation
for Characterization of Irradiated Metals at
Room and High Temperatures", Universität
Karlsruhe, 2011.
Publication
www.me.ust.hk
Internet SourceE Harsono. "The effect of friction on
indentation test results", Modelling and
Simulation in Materials Science and
Engineering, 09/01/2008
Publication
Takakuwa, Osamu, Yusuke Kawaragi, and
Hitoshi Soyama. "Estimation of the Yield
Stress of Stainless Steel from the Vickers
Hardness Taking Account of the Residual
Stress", Journal of Surface Engineered
Materials and Advanced Technology, 2013.
PublicationKEISHI YONEDA. "ESTIMATION OF
ANISOTROPIC PLASTIC PROPERTIES OF
ENGINEERING STEELS FROM SPHERICAL
IMPRESSIONS", International Journal of
EXCLUDE QUOTES OFF EXCLUDE
BIBLIOGRAPHY ON