THESIS
ESTIMATION OF GREEN LAND TO URBAN
CHANGE BASED ON CELLULAR AUTOMATA (CA)
METHOD IN SINGARAJA CITY AND ITS
SURROUNDING AREAS
I NYOMAN ARTO SUPRAPTO
POSTGRADUATE PROGRAM
UDAYANA UNIVERSITY
THESIS
ESTIMATION OF GREEN LAND TO URBAN
CHANGE BASED ON CELLULAR AUTOMATA (CA)
METHOD IN SINGARAJA CITY AND ITS
SURROUNDING AREAS
I NYOMAN ARTO SUPRAPTO NIM 1391261022
MASTER DEGREE PROGRAM
GRADUATE STUDY OF ENVIRONMENTAL SCIENCE
POSTGRADUATE PROGRAM
UDAYANA UNIVERSITY
DENPASAR
ii
ESTIMATION OF GREEN LAND TO URBAN
CHANGE BASED ON CELLULAR AUTOMATA (CA)
METHOD IN SINGARAJA CITY AND ITS
SURROUNDING AREAS
Thesis to Get Master Degree
At Graduate Study of Environment Science Postgraduate Program Udayana University
I NYOMAN ARTO SUPRAPTO NIM 1391261022
MASTER DEGREE PROGRAM
GRADUATE STUDY OF ENVIRONMENTAL SCIENCE
POSTGRADUATE PROGRAM
UDAYANA UNIVERSITY
DENPASAR
iii
AGRREMENT SHEET
THIS THESIS HAS BEEN APPROVED On January 25th 2016
First Supervisor Second Supervisor
Ass. Prof. Dr. Takahiro Osawa Dr. Eng. I Dewa Nyoman Nurweda Putra, S.Si. M.Si.
NIP. 198306142010121006
Knowing,
Head of Graduate Study on Environment Science Postgraduate
Program Udayana University
Director of Postgraduate Program Udayana University
Prof. Dr. I Wayan Budiarsa Suyasa, MS NIP. 196703031994031002
iv
This Thesis Has Been Examined On January 11th 2016
Examiner Comminttees Based On The Letter of Agreement from Rector Udayana University, No. 030/UN.14.4/HK/2016, Date January 5th 2016
Head of Examiner : Ass. Prof. Dr. Takahiro Osawa Members :
1. Dr. Eng. I Dewa Nyoman Nurweda Putra, S.Si, M.Si 2. Prof. Dr. Ir. I Nyoman Merit, M.Agr
v
STATEMENT FREE FROM PLAGIARSM
This undersigned below :
Name : I Nyoman Arto Suprapto NIM : 1391261022
Date of Birth : Bangli, 7 Juni 1987
Adress : Banjar Yeh Panes, Desa Songan, Kec. Kintamani, Bangli Thesis Title : Estimation of Green Land to Urban Change Based on Cellular
Automata (CA) Method in Singaraja City and Its Surrounding Areas
Hereby declare that the scientific work is plagiarism free. If in the future prove to have plagiarism in scientific work and then I am willing to accept sanction in accordance with the regulation of Minister of Republic Indonesia number 17 in 2010 and regualation applicable in the Republic of Indonesia.
Denpasar, Januari 25th, 2016 I respectfully,
vi
ACKNOLEDGMENT
Praise to Almighty God for blessing the author in finishing this research. The title of this research is “Estimation of Green Land to Urban Change Based on Cellular Automata (CA) Method in Singaraja City and Its Surrounding Areas”.
In this opportunity, the author would like to acknowledge:
1. Rector of Udayana University as supreme leader who has given me the opportunity to do a study at the University of Udayana. As a president of Udayana University, Prof.Dr.dr. Ketut Suastika,Sp.PD.KEMD has given me the facility to complete my research and study at the Udayana University.
2. Director of Postgraduate Program Udayana University, Prof. Dr. dr. A. A. Raka Sudewi, Sp. S(K) which has been providing various facilities in finishing my study in Postgraduate Program of Environment Science.
3. Ministry of Education and Culture Indonesia which support the author for given a “Beasiswa Unggulan” Scholarship to study in Postgraduate Program of Environment Science, University of Udayana, In Environmental Remote Sensing concentration.
4. Prof. Tasuku Tanaka as Director of Center of Remote Sensing and Ocean Science (CReSOS) Udayana University who give me the chance to do this study and give me many suggestion to this thesis.
vii give me a chance to do this research.
6. Ass. Prof. Takahiro Osawa as my first supervisor and Dr. Eng. I Dewa Nyoman Nurweda Putra, S.Si, M.Si as my second supervisor from Udayana University who support and review my paper.
7. Prof. Dr. Ir. I Nyoman Merit, M.Agr and Dr. Ir. I Wayan Nuarsa, M.Si as my examiner committee who give so many suggestion for this research.
8. USGS which was support this research to provide satellite image of Landsat.
9. The fellow students of the Master of Environmental Science in 2013 that also provide motivation and help in the completion of this thesis. 10. The family who continues to provide motivation in completing this
thesis.
11. All those who have helped the completion of this thesis which can not be mentioned one by one.
Hopely this research can be useful for the community and if there is less criticism and suggestions are welcome for future refinement of this research.
Denpasar, January 2016
viii
ABSTRAK
Estimasi Perubahan Lahan Hijau menjadi Lahan Terbangun dengan Menggunakan Metode Cellular Automata (CA) di Kota Singaraja dan Sekitarnya.
Kota Singaraja adalah kota terbesar kedua di Bali yang memiliki pertumbuhan cukup pesat. Pertumbuhan dan perkembangan wilayah di kawasan perkotaan Singaraja berdampak positif terhadap perekonomian masyarakat namun juga berdampak negatif terhadap lingkungan. Alih fungsi lahan menjadi salah satu isu negatif dari perkembangan wilayah perkotaan Singaraja. Penelitian ini bermaksud untuk menghitung besarnya alih fungsi lahan yang terjadi dari lahan hijau menjadi lahan terbangun dalam kurun waktu 14 tahun (2001 – 2015) dan prediksi penggunaan lahan tahun 2020 dan 2025 di Kawasan Perkotaan Singaraja dan sekitarnya.
Citra Landsat 7 dan Landsat 8 digunakan dalam penelitian ini untuk mengetahui peta penggunaan lahan. Peta penggunaan lahan diperoleh melalui proses klasifikasi citra dengan menggunakan metode supervised kemudian diverifikasi menggunakan data lapangan. Peta penggunaan lahan tahun 2015 dan 2001 digunakan untuk menghitung besarnya perubahan kawasan terbangun selama kurun waktu 14 tahun yaitu sebesar 11,37% (3.153,74 ha) sedangkan lahan hijau mengalami penurunan sebesar 11,17% (3.097,68 ha). Prediksi penggunaan lahan dilakukan dengan menggunakan metode Markov. Hasil prediksi menunjukan besarnya lahan terbangun pada tahun 2020 adalah 27,40% (7.598,45 ha) dan pada tahun 2025 adalah 35,97% (9.974,55 ha). Hasil prediksi ini diperoleh dengan tingkat akurasi sebesar 0,91.
ix
ABSTRACT
Estimation of Green Land to Urban Change Based on Cellular Automata (CA) Method in Singaraja City and Its Surrounding Areas
Singaraja city is the second largest city in Bali which have a fairly rapid growth. Growth and development of the region in urban areas of Singaraja give the positive impact on the economy of the community but also give the negative impact on the environment. Land use change and land conversion into one of the negative issues of the development of urban areas in Singaraja. This study intends to calculate the amount of land conversion occur on the green land into urban areas within 14 years (2001-2015) and predict land use change in 2020 and 2025 in Singaraja City and Its Sorrounding Areas.
Landsat 7 and Landsat 8 imageries were used to determine the land use map. Land use map obtained through the process of image classification using supervised method then verified using data field. Land use maps in 2015 and 2001 used to obtain the amount of change of urban areas and green land during the period of 14 years. This results show increasing amount of urban areas as 11,37% (3.153,74 ha) whereas green land decreased by 11,17% (3.097,68 ha). Land use change was predicted by Markov method. The projection results show the amount of urban areas in 2020 was 27,40% (7.598,45 ha) and 35,97% (9.974,55 ha) in 2025. The results obtained with this prediction accuracy rate of 0.91.
x
SUMMARY
Nyoman Arto Suprapto. Estimation of Green Land to Urban Change Based on Cellular Automata (Ca) Method in Singaraja City and Its Surrounding Areas.
Singaraja city is the second largest city in Bali which have a fairly rapid growth. Growth and development of the region in urban areas of Singaraja give the positive impact on the economy of the community but also give the negative impact on the environment. Land use change and land conversion into one of the negative issues of the development of urban areas in Singaraja.
The porpuse of this reaearch are 1). To know change of green land into urban land in Singaraja City and its surrounding areas occurred during the periode of 2001 – 2015, 2). To know the projection of land use change of green land into urban land in Singaraja City and its surrounding areas in 2020 and 2025, 3). To know the accuracy of Landsat image classification and land use projection. This study intends to calculate the amount of land conversion occur on the green land into urban areas within 14 years (2001-2015) and predict urban change in 2020 and 2025 in Singaraja City and Its Sorrounding Areas.
This research was conducted in two phases, namely the interpretation of satellite imageries and urban change projections. Image interpretation conducted to obtain the land use map. Urban change projection conducted to know how the use of urban land in 2020 and 2025. Land use map in the period of 2001-2015 used Landsat ETM+ imageries in 2001 and 2015. Land use map was classified into three classes namely urban area, green land, and water. The resolution of the Satellite image used is 30 m x 30 m.
xi
difference in value between the green land and urban areas by 0,20 %. The difference was caused by the the change of green land into water body.
Transition matrix and transition map were used to estimate the prediction map in 2020 and 2025. The result of the prediction show the land use change occur from green land into urban areas mostly occur in the city center of Singaraja, center of settlement, and the develop following the main road. The amount of urban areas in 2020 was 27,40 % (7.598.45ha) and 35,97% (9.974.55 ha) in 2025.
The accuracy of this study is very good. Land use classification obtained with accuracy of 0.84 which shows the land use classification results is good enough for further analysis. Land use projections even showed a very good level of accuracy that is equal to 0.91 which mean the projected results is very good.
xii
TABLE OF CONTENT
Page
INSIDE COVER ... i
PREREQUISITES DEGREE ... ii
AGREEMENT SHEET ... iii
THE DECREE OF EXIMINER COMMITTEE ... iv
STATEMENT FREE FROM PLAGIARISM ... v
ACKNOLEDGMENT... vi
ABSTRAK ... viii
ABSTRACT ... ix
SUMMARY ... x
TABLLE OF CONTENT ... iv
LIST TABLE ... vi
LIST OF FIGURE ... vii
CHAPTER I INTRODUCTION ... 1
1.1. Background ... 1
1.2. Problem Formulation ... 5
1.3. Research Objective ... 5
1.4. Research Benefits ... 5
CHAPTER II LITERATURE REVIEW ... 7
2.1. Land ... 7
2.1.1. Land Use ... 7
2.1.2. Land Use Change ... 9
2.1.3. Land Use Classification ... 12
2.2. Land Use Modeling ... 21
2.2.1 Definition of Model ... 21
xiii
2.3. Remote Sensing ... 27
2.4. Landsat Imagery ... 30
2.5.1 Landsat 7 Imagery ... 31
2.5.2 Landsat 8 Imagery ... 32
2.5. Classification Method ... 34
2.6. Geographic Information System ... 36
CHAPTER III FRAMEWORK OF RESEARCH ... 39
CHAPTER IV RESEARCH METHOD ... 41
4.1. Research Design ... 41
4.2. Research Location ... 44
4.3. Type and Sources of Data ... 45
4.4. Research Instruments ... 47
4.5. Data Analysis ... 48
CHAPTER V RESULTS AND DISCUSSION ... 59
5.1. Land Use Change in Singaraja City and Its Surrounding Areas ... 59
5.2. Urban Change Prediction ... 73
CHAPTER VI CONCLUSION AND SUGGESTION ... 80
5.1. Conclusion ... 80
5.2. Suggestion ... 81
REFERENCES ... 82
xiv
LIST OF TABLE
Table Page
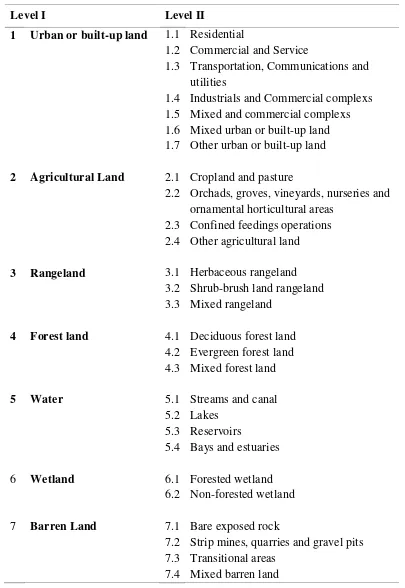
Table 2.1 Land Cover and Land Use Classification ... 13
Table 2.1 Land Cover and Land Use Classification (continue) ... 14
Table 2.2 Land Cover and Land Use in Scale of 1:1.000.000 ... 15
Table 2.3. Classification of Land Use Change Model ... 23
Table 2.3. Classification of Land Use Change Model (continue) ... 24
Table 2.4 Characteristics of Landsat Spectral ... 31
Table 2.6 Comparison Between the Characteristics of Each Channel Landsat 7 and Landsat 8 ... 33
Table 2.6 Comparison Between the Characteristics of Each Channel Landsat 7 and Landsat 8 (continue) ... 34
Table 4.1 Type and Source of Data ... 45
Table 4.1 Type and Source of Data (continue) ... 46
Table 4.2 Error Matrix... 54
Table 4.2 Error Matrix (continue) ... 55
Table 5.1 Landsat RGB Composite Images Characteristic ... 62
Table 5.2 Description of Land Use Class ... 67
xv
LIST OF FIGURE
Figure Page
Figure 2.1 Illustration of filter size, (a) Filter 3x3, (b) 5x5 filter, (c) Filter 7x7, (d) Oktogonal Filter 5x5, (e) Oktogonal Filter
7x7, (f) 4 Cros Filter nearest neighbor (Jensen, 1996). ... 27
Figure 3.1 Framework of Research ... 40
Figure 4.1 Research Design ... 43
Figure 4.2 Map of Research Location ... 44
Figure 4.3 Field Data of Training Area ... 46
Figure 4.3 Field Data of Validation ... 47
Figure 5.1 Result of Cloud Remove and Gap Filling (a) 2001, (b) 2003, (c) 2013, and (d) 2015 ... 61
Figure 5.2 Cloud Masking Landsat Images in (a) 2001, (b) 2003, (c) 2013, and (d) 2015 ... 64
Figure 5.3 Field Data for Training Area ... 66
Figure 5.4 Land Use Map of Singaraja City and Its Surrounding Areas (a) 2001, (b) 2003, (c) 2013 and (d) 2015 ... 68
Figure 5.5 Cross Classification: Land Use 2001 | Land Use 2013. ... 74
Figure 5.6 Land Use Prediction in 2015 ... 76
Figure 5.7 Land Use Prediction in 2020 ... 78
xvi
LIST OF ABREVIATION
BIG : Badan Informasi Geospasial (Spatial Information Agency) CA : Cellular Automata
CLUE : Conversion of Land Use and its Effects DN : Digital Number
ETM : Enhanced Thematic Mapper GIS : Geographic Information System HDI : Human Development Index MLR : Multinomial Logistic Regression OLI : Onboard Operational Land Imager
PKN : Pusat Kegiatan Nasional (Center of Nasional Activity) PKW : Pusat Kegiatan Wilayah (Center of Regional Activity) RGB : Red Green Blue
ToA : Top of Atmosphere
1
CHAPTER I INTRODUCTION
1.1. Background
Buleleng is the largest regency in Bali with a total area of 1365.88 km2 or 24.25% of the Bali Province. The capital of Buleleng regency is Singaraja city which is consist of 3 districts, namely district of Buleleng, Banjar and Sukasada. Singaraja is the second largest city in the Bali province after Denpasar. Based on the spatial structure of Bali Province (Bali Provincial Regulation No. 16 of 2009), the urban areas of Singaraja is included as PKW (Center of Regional Activity). Spatial structure mandated by the Bali Provincial Spatial Plan sets the urban areas of Sarbagita as PKN (Center of National Activity) and urban areas of Singaraja as PKW. Thus, the governments of both central and regional level will focus on the development of infrastructure in the urban areas. Enactment of Singaraja urban areas as PKW gives positive and negative impacts of the development because the economic activity will be focused on urban areas. Increased economic activity is one of the positive impacts on the provision of supporting infrastructure. However, land use change is also a threat to the growth and development of the region.
2
considerations factor and institutional factors. Physical and biological factors include the appropriateness of physical properties such as geological conditions, soil, water, climate, vegetation, animal and population. Economic factors characterized by profit considerations, market conditions and transportation. The institutional factors are characterized by the land law, the political situation, social situation and the administration can be carried out.
3
found that changes in land use caused changes to the condition of the flood discharge.
Spatial planning aims to allocate space to meet the needs of future development. The result of the development is expected to be the welfare of society. Measure of success of development obtained by the people is the Human Development Index (HDI) (UNDP, 2004). This measure of success only oriented to humans (antropocentris). The approach to see the results of the development is not only seen on the human aspect but also the aspects of the environment (ecosystem). Therefore, it is necessary the appropriate approach which is able to describe the situation as a whole.
4
5
1.2. Problem Formulation
Urban areas of Singaraja have a great potential to grow and develop. Centralization of infrastructure development, economic activity and urbanization occurs as a result of the growth. This research was conduct to answer several questions:
1. How much change of green land into urban land in Singaraja City and its surrounding area occur during the period of 2001 - 2015?
2. How is the prediction of land use changes from green land into urban land in Singaraja City and its surrounding areas in 2020 and 2025?
3. How are the accuracy of Landsat image classification and land use projection?
1.3. Research Objective
This research aims to:
1. To know change of green land into urban land in Singaraja City and its surrounding areas occurred during the periode of 2001 - 2015.
2. To know the projection of land use change of green land into urban land in Singaraja City and its surrounding areas in 2020 and 2025.
3. To know the accuracy of Landsat image classification and land use projection.
1.4. Research Benefits
6
1. Theoretical benefits
The theoretical benefit of this research is to provide input to the study of science in land use modeling.
2. Practical Benefits
a) Provide feedback to the Local Government of Buleleng for valuation of urban spatial planning.
b) Provide a new method to city planners in analyzing the space requirements.
7
CHAPTER II LITERATURE REVIEW
2.1. Land 2.1.1.Land Use
Land is part of the landscape that includes the notion of the physical environment including climate, topography or relief, hydrology including natural vegetation that all potentially will affect the use of land (Sitorus, 2004). According Hardjowigeno and Widiatmaka (2001) land as an area on the earth's surface, includes all components of the biosphere, including the atmosphere and all the consequences caused by humans in the past and present. Another concept of land held by Sitorus (2004) that describe land as the physical environment consisting of climate, relief, soil, water and vegetation as well as objects that exist on it all has an effect on land use. The physical environment will affect the potential for its use including the result of human activity. Land is an important natural resource (Yeh and Li, 1998) because it was found energy, food, raw materials and it is a habitat for animal life and wildlife. According to Briassoulis (2000) land is natural resource that support life which is the outermost surface of the earth. Biophysical properties of land that illustrate the purpose of use the land is called land use. Land use according to Sandy (1999) is the same terminology with the use of space or spatial.
8
activities on the object. Lambiin et al. (2000) also provide a common understanding of the differences in the definition of land cover and land use. Land cover is the biophysical state of the earth's surface and the layer below it. Land cover describes the physical state of the earth's surface as agricultural land, mountain or forest. Land cover is an attribute of the surface and subsurface containing biota, soil, topography, groundwater, and human structures. Land use indicates a different meaning, namely the purpose of human beings in exploiting the land cover. This definition is also supported by Townshend and Justice (1981) which describes the land cover as a physical embodiment (visual) vegetation, natural objects and cultural elements that exist on the surface of the earth regardless of human activities on the object. Briassoulis (2000) describes, land use depicts biophysical properties of the land that shows the function or purpose of the land is used by humans and can be described as a human activity that is directly related to the land, the use of such resources give effect to it.
9
cumulative and mutually supportive. The impact of environmental damage due to improper land use was greater at this time, due to a rapidly growing population requires a much larger area for the diverse needs (Mather, 1986).
2.1.2.Land Use Change
Land and humans have a very close relationship. Lillesand and Kiefer (1997) found a link between land uses with human activity on the land. Land use can be classified into two major categories, namely agricultural and non-agricultural land use. According Arsyad (1989) agriculture land distinguished as dry land, fields, gardens, pastures, production forest, protected forest, and so on, while the non-agricultural land use are distinguished as town or village (settlement), industrial, recreational, mining and so on.
Development trend of the current population of the city began to change, in which population and the rate is higher in the suburbs region compared to its urban center, which resulted in the conversion of fertile agricultural land in the suburbs into urban areas. Land use change in Indonesia is quite high, which is 1,000,000 acres per year. This is an issue that affected the environment (Bappenas et al., 2003). Land use is an important aspect, because it needs to be a study or research that examines these aspects in order to define strategies or steps to anticipate the effects that may occur.
10
defined as a change from the previous land use to another land use that may be permanent or temporary and it is a logical consequence of the growth and transformation of the social structure of the local growing economy.
Briassoulis (2000) states that over the last 300 years, the global land use change significantly and the main cause is human. In a period of 300 years the world population increases to five billion and at the same time there is a decrease in forest area of one billion acres. It shows how humans have a very big role on land use. The interaction between the dimensions of space and time with the biophysical and human dimensions resulted in a change of land use (Veldkamp and Verburg, 2004). Several studies and researches have been conducted to analyze the factors that cause a change in land use. Mansur (2001) mentions that three factors that influence land use change is the increase in population, urbanization and an increasing number of members of the upper middle income groups in urban areas. Different things revealed by Rustiadi et al. (2009), which revealed that the process of land use change caused by:
1. The high demand for land as a result of the increasing population.
2. Market failure: the failure of farmers to sell agricultural products at competitive prices so that prefer other types of businesses and change their land use.
11
Climate change, increasing population and urbanization process is a common cause which is considered by Wu et al. (2006) as factors that contribute to changes in land use. The complexity of the physical factors, biological, social, political, and economic dimensions in space and time at the same time is a major cause of land use change process (Wu et al., 2006).
Land use change as expressed by Rustiadi et al. (2009) is closely related to regional development policy. Regional development is an effort to build and develop a region based approach by considering the spatial aspects of socio-cultural, economic, physical environment, and institutions within a framework of integrated planning and development management. Functionally, an area can be identified based on its constituent components, such as components of biophysical, socio-cultural, economic and institutional (Kodoatie, 2005). Kodoatie (2005) mention that the region system is developed taking into account resources contained in the area concerned, which include:
1. Natural resources, including resource components that make up a system of natural physical or biophysical environment (land / soil, water, air, minerals, flora and fauna), as a part of a wider system.
2. Artificial Resources, includes a built environment (existing) in the form of a network infrastructure as driving variable for activities in an area, which can contribute to encourage, stimulate, and to some extent direct the development / construction region.
12
institutional and administrative systems, and social systems in which the development is done thoroughly to form a situation / particular condition. 4. Business activities, includes all components of system activities that can support the region's economy, which will determine the concentration of population in carrying out the activities, places of employment and transaction activity in the region to fulfilling the daily needs.
These four subsystems are mutual interactions within a given territory, thus giving the dynamics of the development of the region. A development must incorporate and adapt land use, water, and other natural resources. All the elements are combined in a single system harmonious environment, supported by a dynamic and harmonious management of population development (Murray and Lopez, 2006). Land use which is not accordance with the carrying capacity of land will cause damage to the environment. The danger again, the environmental impact of land use tends to be cumulative and mutually supportive (Mather, 1986).
2.1.3.Land Use Classification
13
Table 2.1
Land Cover and Land Use Classification
Level I Level II
2 Agricultural Land 2.1 Cropland and pasture
2.2 Orchads, groves, vineyards, nurseries and ornamental horticultural areas
2.3 Confined feedings operations 2.4 Other agricultural land
3 Rangeland 3.1 Herbaceous rangeland
14
Table 2.1
Land Cover and Land Use Classification (continue)
Level I Level II
8 Tundra 8.1 Shrub and brush tundra 8.2 Herbaceous tundra 8.3 Bare ground tundra 8.4 Wet tundra
8.5 Mixed tundra
9 Perennial Snow or Ice 9.1 Perennial snowfields 9.2 Glaciers
Source: USGS with modification, 1976
15
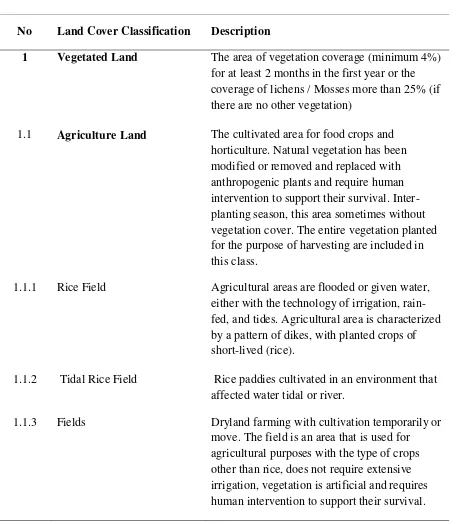
Table 2.2
Land Cover and Land Use in Scale of 1:250.000
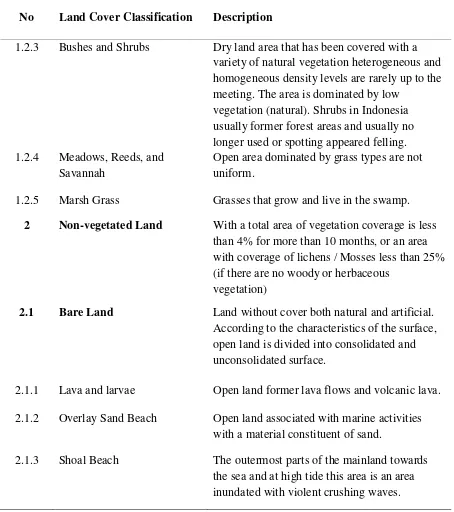
No Land Cover Classification Description
1 Vegetated Land The area of vegetation coverage (minimum 4%) for at least 2 months in the first year or the coverage of lichens / Mosses more than 25% (if there are no other vegetation)
1.1 Agriculture Land The cultivated area for food crops and horticulture. Natural vegetation has been modified or removed and replaced with anthropogenic plants and require human intervention to support their survival. Inter-planting season, this area sometimes without vegetation cover. The entire vegetation planted for the purpose of harvesting are included in this class.
1.1.1 Rice Field Agricultural areas are flooded or given water, either with the technology of irrigation, rain-fed, and tides. Agricultural area is characterized by a pattern of dikes, with planted crops of short-lived (rice).
1.1.2 Tidal Rice Field Rice paddies cultivated in an environment that affected water tidal or river.
16
Table 2.2
Land Cover and Land Use in Scale of 1:250.000 (continue)
No Land Cover Classification Description
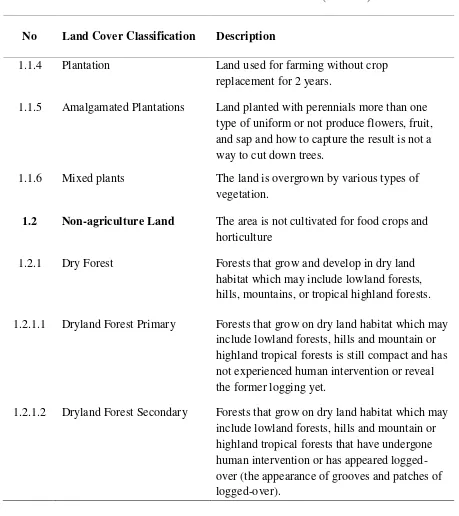
1.1.4 Plantation Land used for farming without crop replacement for 2 years.
1.1.5 Amalgamated Plantations Land planted with perennials more than one type of uniform or not produce flowers, fruit, and sap and how to capture the result is not a way to cut down trees.
1.1.6 Mixed plants The land is overgrown by various types of vegetation.
1.2 Non-agriculture Land The area is not cultivated for food crops and horticulture
1.2.1 Dry Forest Forests that grow and develop in dry land habitat which may include lowland forests, hills, mountains, or tropical highland forests. 1.2.1.1 Dryland Forest Primary Forests that grow on dry land habitat which may
include lowland forests, hills and mountain or highland tropical forests is still compact and has not experienced human intervention or reveal the former logging yet.
17
Table 2.2
Land Cover and Land Use in Scale of 1:250.000 (continue)
No Land Cover Classification Description
1.2.2 Wet Forest Forests that grow and thrive in wetland habitats such as swamps, including brackish marshes and peat. Wetland regions have unique characteristics, namely (1) the lowlands that stretch along the coast, (2) area of low
elevation, (3) a place that is affected by the tides for the area near the beach, (4) the area affected by the season which is located far from the beach, (5) most of the area covered in peat. 1.2.2.1 Wetland Forest Primary Forests that grow and thrive in wetland habitats
such as swamps, including brackish marshes and peat. Wetland regions have unique characteristics, namely (1) the lowlands that stretch along the coast, (2) area of low
elevation, (3) a place that is affected by the tides for the area near the beach, (4) the area affected by the season which is located far from the beach , (5) most of the area covered in peat, have not experienced human intervention. 1.2.2.2 Forest Wetlands Secondary Forests that grow and thrive in wetland habitats
such as swamps, including brackish marshes and peat. Wetland regions have unique characteristics, namely (1) the lowlands that stretch along the coast, (2) area of low
18
Table 2.2
Land Cover and Land Use in Scale of 1:250.000 (continue)
No Land Cover Classification Description
1.2.3 Bushes and Shrubs Dry land area that has been covered with a variety of natural vegetation heterogeneous and homogeneous density levels are rarely up to the meeting. The area is dominated by low
vegetation (natural). Shrubs in Indonesia usually former forest areas and usually no longer used or spotting appeared felling. 1.2.4 Meadows, Reeds, and
Savannah
Open area dominated by grass types are not uniform.
1.2.5 Marsh Grass Grasses that grow and live in the swamp.
2 Non-vegetated Land With a total area of vegetation coverage is less than 4% for more than 10 months, or an area with coverage of lichens / Mosses less than 25% (if there are no woody or herbaceous
vegetation)
2.1 Bare Land Land without cover both natural and artificial. According to the characteristics of the surface, open land is divided into consolidated and unconsolidated surface.
2.1.1 Lava and larvae Open land former lava flows and volcanic lava. 2.1.2 Overlay Sand Beach Open land associated with marine activities
with a material constituent of sand.
19
Table 2.2
Land Cover and Land Use in Scale of 1:250.000 (continue)
No Land Cover Classification Description
2.1.4 Grease Sand The dunes are formed by wind-borne sand deposits. Sand dunes are common in the desert or along the coast. There are several types of sand dunes are determined by the amount of sand, the strength and direction of the wind, the surface characteristics of the location of the deposition (sand or rock), the existence of the barrier and groundwater.
2.2 Settlement and Non-agriculture Area
Developed land characterized by the
substitution of land cover of natural or semi-natural artificial land cover and often waterproof.
2.2.1 Developed Land Areas that have undergone substitution by natural or semi-natural land cover with artificial ground cover that is usually watertight and relatively permanent.
2.2.1.1 Settlement Area or land used as a living environment or residential environment and the activities that support life.
2.2.1.2 Industrial Building Area used for buildings or industrial plants in the form of industrial estates or companies. 2.2.1.3 Roads Transport infrastructure networks that are
intended for vehicle traffic.
2.2.1.3.1 Arterial Road The main road serving the transport
characteristics of long-distance travel and high average speeds, according ISO 6502.4
20
Table 2.2
Land Cover and Land Use in Scale of 1:250.000 (continue)
No Land Cover Classification Description
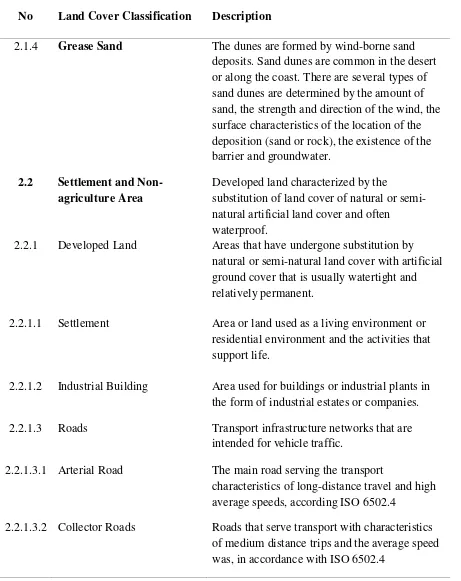
2.2.1.4 Railway Railroads
2.2.1.5 Air Port The airport that has a complete facility for domestic and foreign airlines.
2.2.1.6 Harbor Premises used as a docking and berthing of ships and their activity and cargo loading and unloading passengers.
2.2.2 Non-developed Land This land has experienced human intervention so that the natural land cover (semi-natural) cannot be found anymore. However, this land is not experienced as it occurs in the development of undeveloped land
2.2.2.1 Mining Open land as a result of mining activities, which cover the land, stone or stockpiled material at these sites are usually those coming from outside the location in question.
2.2.2.2 Hoarding Trash / Deposit The location was used as landfill material moved by humans. The materials deposited in these areas are actually coming from outside the location in question.
2.3 Water All appearance of waters, including the sea, reservoirs, coral reefs, and sea grass beds. 2.3.1 Lake or Reservoir The area of water with deep water inundation
and permanent inundation of shallow and including its functions.
2.3.2 Embankment Activity for fishing or salting-looking pattern bund around the coast.
2.3.3 Marsh Stagnant freshwater or brackish water is widely and permanently on the mainland.
21
Table 2.2
Land Cover and Land Use in Scale of 1:250.000 (continue)
No Land Cover Classification Description
2.3.5 Coral Reefs Collection of marine fauna gathered into one and form reefs.
2.3.6 The Sandbar Beach The appearance of the sand on the sea surface and sometimes drowned during neap tide, width <50 m, and not overgrown vegetation.
Source: SNI, 2010
Those classifications mentioned in the table 2.2 are composite from all land use and land cover all over Indonesia. To facilitate the classification in the Singaraja City and its surrounding area, land use or land cover class would refer to spatial plan document of Buleleng Regency. According to Buleleng Spatial Plan land use classes in the Buleleng Regencey grouped into roads, streams, lake, settlement, forest, plantation, rice field, field, bushes and shrubs, swamp forest, salting area, and dam.
2.2. Land Use Modeling 2.2.1 Definition of Model
22
with the system, he says the system is the mechanism by which various components interact with each other in a certain way to indicate its function in the real world. Another definition is based spatial proposed by Berger et al. (2001), in which a model is an abstraction of a real world system that has significant problems of detail with the problems being studied and also has transparency, so that the mechanisms and key factors affecting the change can be identified. The purpose of the model is easy to understand how the system works to simplify the process.
The model can be used to represent a specific issue on the science related to natural resources, and a variety of other disciplines. Modeling land-use change is one form of modeling that has attracted the attention of several researchers in the world. They studied the existence of a causal relationship between the management of a land with land use changes. Modeling land-use change has several uses, among others, to explore a variety of activities in which the occurrence of a change in land use driven by socioeconomic factors (Batty and Longley, 1994), predicting the economic and environmental impacts that will result from these changes (Theobald and Hobbs, 1998) and to evaluate the impact of government policy in determining the designation of land and land management (Bockstael et al., 1995). It is expected that land use change models have been developed to provide an understanding of the process of land use change and the factors that foster change.
23
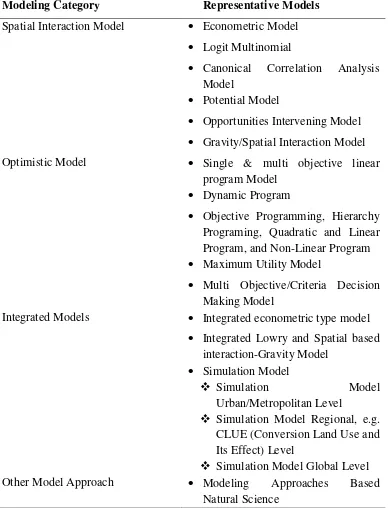
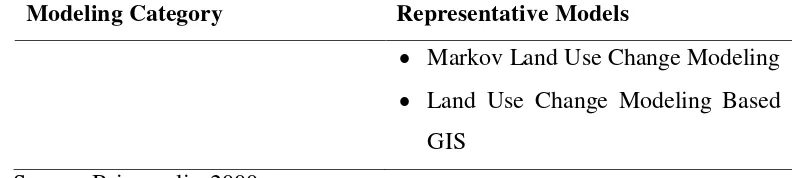
model and other modeling approaches. Table 2.3 show model classification by Briassoulis (2000).
Table 2.3.
Classification of Land Use Change Model
Modeling Category Representative Models
Spatial Interaction Model Econometric Model
Logit Multinomial
Canonical Correlation Analysis Model
Potential Model
Opportunities Intervening Model
Gravity/Spatial Interaction Model Optimistic Model Single & multi objective linear
program Model
Dynamic Program
Objective Programming, Hierarchy Programing, Quadratic and Linear Program, and Non-Linear Program
Maximum Utility Model
Multi Objective/Criteria Decision Making Model
Integrated Models Integrated econometric type model
Integrated Lowry and Spatial based Other Model Approach Modeling Approaches Based
24
Table 2.3.
Classification of Land Use Change Model (continue)
Modeling Category Representative Models
Markov Land Use Change Modeling
Land Use Change Modeling Based GIS
Source: Briassoulis, 2000
2.2.2 Projection Using Markov Chain (Cellular Automata)
25
Pij is the probability of land use changes from i into j, where n represents the number of land use classes. The value of the Pij should qualify that:
≤ � ≤ , , = , , , … . , �
Markov chain is the foundation of land use projection systems. This method was then developed by Ulam and Von Neumann in 1940 to create a formal framework to examine the behavior of complex systems. The method developed by Ulam and Von Neumann is known as Cellular Automata (CA). CA is a dynamic model of local interactions between cells in a regular grid (Hand in Munibah et all., 2008). CA is also defined as a two-dimensional grid, in which each cell represents land use while the land use change depending on the rules that take into account the neighbor land use (Manson in Munibah et all., 2008).
CA model is dynamic, the unit is in the form of discrete space (pixel or cell) and is a function of time and can be fixed (updated) simultaneously (state synchronously) (Messina and Walsh, 2001). The main component of CA is the cell, state, rule or change function (transition rule or transition function) and adjacency (neighborhood) (Chen et al. in Munibah et all., 2008).
26
Polhill et al. in Munibah et all., 2008), 100 m raster (Manson, in Munibah et all., 2008), 200 m raster (Parker in Munibah et all., 2008), and 1 km raster (Manson; Verburg et al. in Munibah et all., 2008).
State is a discrete variable in each cell that is the function of time (CSIRO, 2003). State that many CA approaches examined is the type of land use. Changes in land use in each cell (pixel) depending on the neighbors and initial period land use (Berger, et al., 2001; Manson in Munibah et all., 2008), and controlled by a set of rules system or transition function (Chen et al. in Munibah et all., 2008; Wolfram, 1984; Manson in Munibah et all., 2008). Transition function can be deterministic or stochastic (Wolfram, 1984; Manson in Munibah et all., 2008). In its application the rule transition can be a transition probability matrix (TPM), logistic regression, nearest neighbor probability.
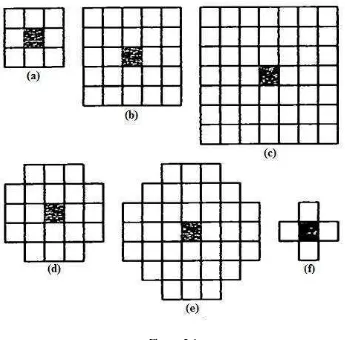
Adjacency means land use changes on the pixels will be affected by neighbor land use pixels. In this case the number of pixels is needs to be defined that are considered as neighbors. The concept of neighborhood is technically translated with the filter / window. Some illustrations are presented filter size in Figure 2.1. Filter mean how much neighbors cell consider to influence the state of its cell. The cells around the initial cell affected its cell state. Consideration of the number of neighbor cell very important to get the future cell state.
27
Figure 2.1.
Illustration of filter size, (a) Filter 3x3, (b) 5x5 filter, (c) Filter 7x7, (d) Oktogonal Filter 5x5, (e) Oktogonal Filter 7x7, (f) 4 Cros Filter nearest neighbor (Jensen, 1986).
2.3. Remote Sensing
28
Remote sensing components consist of: 1. Sources
Power sources use in the remote sensing such as natural energy and artificial energy. Natural energy derived from solar and artificial so-called pulse. Remote sensing that using solar system is called passive system and the use of pulse power is called active system. Passive system can record the reflected power and radiance. By using the excess pulses can be used for taking pictures at night.
2. Object
Remote sensing objects are all objects that exist on the earth's surface, such as soil, mountains, water, vegetation, and human cultured, city, farmland, forest or objects in the sky like a cloud.
3. Sensors
The sensor is a device used to receive the reflected energy or electromagnetic radiation. For examples aerial cameras and scanners. 4. Detector
The detector is contained in a tape recorder to record the force sensor and the reflected beam.
5. Vehicle
The vehicle means for storing the sensor such as aircraft, satellites and space shuttle.
29
and good quality. The electronic system has advantages as greater capabilities and more definitively in distinguish between objects and the analysis process is faster because it uses a computer. Based on the energy used remote sensing system divided into radiant energy and reflected energy. Based on its vehicle, remote sensing was distinguished into aerospace sensing system (airborne system) and space (spaceborne system).
30
2.4. Landsat Imagery
Landsat image is a picture of the earth's surface taken from space with a height of approximately 818 km from the Earth's surface, with a scale of 1: 250,000. In each recording Landsat imagery has a coverage area of 185 km x 185 km so that certain aspects of the object can be identified without a broad enough range throughout the area surveyed or studied. Landsat imagery is generated imagery of some spectrum with different wavelengths, namely:
1. Channel 4 with a wavelength of 0.5 to 0.6 µm in the blue region of the spectrum, either for detecting aquatic sediment load in your body, charred, sediment suspension and reefs.
2. Channel 5 with a wavelength of 0.6 to 0.7 µm in the green region of the spectrum, both for detecting vegetation, culture, etc.
3. Channels 6 with wavelengths from 0.7 to 0.8 µm in the red region of the spectrum, both for detecting surface relief of the earth, water and land boundaries.
4. Channel 7 with a wavelength of 0.8 to 1.1 µ m in the infrared region, which is less likely to detect the earth's surface relief when compared with channel 6.
5. Channel 7 with a wavelength of 0.8 to 1.1 µm in the infrared region, which is less likely to detect the earth's surface relief when compared with channel 6.
31
Therefore, through the geological interpretation of Landsat imagery is based on the difference in the reflection.
2.5.1 Landsat 7 Imagery
Landsat 7 is satellite that aligned with the sun orbit and crossed the equator at 10:00 local time. This satellite has the ability to cover the same area every 16 days. Image of Landsat ETM+ (Enhanced Thematic Mapper) is one type of multispectral images. Landsat ETM remote sensing imagery is now often used, this image has 7 channel consisting of the visible spectrum in channels 1, 2, and 3, the near infrared spectrum at channels 4, 5, and 7 and the thermal infrared spectrum at channel 6. Those channel classifications show in Table 2.4.
Table 2.4
Characteristics of Landsat Spectral
No. Chanel Wavelength (µm) Spatial Resolution (m)
1 Blue 0.45-0.52 30
2 Green 0.53-0.61 30
3 Red 0.63-0.69 30
4 Near Infrared 0.78-0.90 30 5 Short Wave Infrared 1.55-1.75 30 6 Thermal infrared 10.4-12.5 60 7 Short Wave Infrared 2.09-2.35 30 8 Panchromatic 0.52-0.9 15 Source: Liliesand and Kiefer, 1996
32
2.5.2 Landsat 8 Imagery
Landsat 8 is a continuation of the Landsat mission is to be the first time since 1972 the earth observation satellite (Landsat 1). Landsat 1, which was originally named the Earth Resources Technology. Satellite 1 was launched July 23, 1972 and start operating until January 6, 1978. The next generation, Landsat 2 was launched January 22, 1975 which operated until 22 January 1981. The Landsat 3 launched March 5, 1978 ending March 31, 1983; Landsat 4 was launched July 16, 1982, discontinued 1993. Landsat 5 was launched March 1, 1984 are still functioning until now but experienced severe disruption since November 2011, as a result of this disturbance, on December 26, 2012, USGS announced that Landsat 5 will be disabled. In contrast to 5-generation predecessor, Landsat 6 was launched October 5, 1993 failed to reach orbit. While Landsat 7, launched April 15 Dec 1999, still functioning despite damage since May 2003 (Liliesand and Kiefer, 1996).
33
targeting that this Landsat satellite will be operate for five years (OLI sensors for 5 years and TIRS sensor designed for 3 years). Do not rule out the possibility of productive age Landsat 8 can be longer than the age that proclaimed as occurs in Landsat 5 (TM), which initially targeted only three years in operation until 2012 but it still works.
Landsat 8 has sensors Onboard Operational Land Imager (OLI) and the Thermal Infrared Sensor (TIRS) with 11 numbers of channels. Among these channels, 9 channels (bands 1-9) are in the OLI and 2 others (bands 10 and 11) on TIRS. Most of the channels have specifications similar to Landsat 7. The channel type, wavelength and spatial resolution of each band on Landsat 8 compared with Landsat 7 as shown in the Table 2.5.
Table 2.5
Comparison Between the Characteristics of Each Channel Landsat 7 and Landsat 8
34
Table 2.5 Comparison Between the Characteristics of Each Channel Landsat 7 and Landsat 8 (continue)
Image classification is a process performed to classify an object of the satellite image by identifying the appearance of objects (Lillesand and Kiefer, 1990). Classification is a technique used to remove the detailed information of the input data to show important patterns or spatial distribution to ease of interpretation and analysis of the image so that the image obtained useful information. For land cover mapping, the results can be obtained from the multispectral classification satellite imagery. Multispectral classification algorithm itself is designed to present a thematic piece of information by classifying phenomena based on the criteria that the spectral values.
35
color of the image, static analysis and graphical analysis. Static analysis is used to consider the average value, standard deviation and variance of each class of samples taken to determine differences in the sample. Graphical analysis is used to see the distribution-the distribution of pixels in a class. Classification methods commonly used are:
a. Supervised
Supervised classification is based on the idea that the user can select a sample pixel in an image that represents the particular land use class and then direct the image processing software to use the preferred choice as a reference for grouping other pixels in the image. Training area was chosen based on knowledge of the user. Users can specify a limit to express how close the results to be achieved. This limit is often determined based on the spectral characteristics of local examples. Users can also design their output. As an example of how many classes are required in the final image that classification (Dharmawan, 2012).
36
(Dharmawan, 2012). Algorithms that can be used to complete the supervised method are the minimum distance and parallelepiped.
b. Unsupervised
The working of unsupervised method is the opposite of the supervised method, in which the pixel values is grouped by computer into spectral classes using cluster algorithms (Dharmawan, 2012). In this method, the start of the analysis will usually determine the number of classes. Then establishes land classes for spectral classes that have been grouped by computer. The result then was generated the analyst could combine a few classes that are considered to have the same information into a single class. For example, class I, class 2 and class 3, respectively, are rice fields, plantations and forests, the analyst can classify classes into one class as the class of vegetation. So in unsupervised methods, classification is not entirely without human intervention. Several algorithms can be used to resolve this unsupervised method including the K-Means and ISODATA.
2.6. Geographic Information System
37
GIS is a formal unity that consists of a variety of physical and logical resources pertaining to the objects contained in the earth's surface. Thus, GIS is a computer-based system that is used to store and manipulate geographic information. GIS is designed to collect, store and analyze objects and phenomena where geographic location is an important or critical characteristics to be analyzed.
Thus, GIS is a computer system which has the following four capabilities in handling geographic referenced data: (a) input, (b) data management (storage and retrieval), (c) the analysis and manipulation of data, (d) output (Aronoff, 1989).
Conceptually a GIS technology must have the following capabilities:
1. Location, GIS must be able to demonstrate the existence of an object based on the location of the images presented on the map. Location of the object described as a way to achieve it, such as a place name, postal code, or can also use the geographical position of objects such as latitude and longitude.
2. Conditions, a GIS technology should be able to determine the condition of an object depicted in the map. This condition such as type of soil, flora and fauna and so on.
3. Trends, GIS must be able to demonstrate the changes that occur in a certain object, after a lapse of some time.
38