BUSINESS STRATEGY EVALUATION IN LOW CRUDE OIL PRICE
ENVIRONMENT
Rina Mariama1, Harimukti Wandebori1 1School of Business and Management (SBM)
{Institut Teknologi Bandung (ITB), Indonesia
E-mail: [email protected]
Abstract
Alpha-AA Company (AAA) is an upstream oil company operated in Indonesia for more than 90 years as part of Alpha-A Business Unit. When the global oil price has been declining since the end of 2014, the company has to change strategy to be able sustain in the business. The challenge situation also face by AAA despite of lower oil price is mature oil fields with declining production. The current situation has led to narrowing the company revenue margin since the lifting cost trend tends to increase meanwhile total oil production declines over time and oil price hit by global market condition. The fundamental issue nowadays is how the company minimizing the strategic gap exist in the current low oil price environment while keep seeking strategic competitiveness and above-average returns contribution to Government of Indonesia and Corporation. In the process of formulating strategy, the company will be verified through external and internal conditions. The result of external and internal conditions observations will be organized by the Strength Weakness Opportunity Threat (SWOT) analysis. Focus group discussion consisted of several experts was formed to discuss about the level of business strategy. In the low oil price condition, AAA should keep its competitive position using cost leadership strategy. Type of diversification of AAA is low level of diversification with dominant revenue from crude oil. The strategy should be able to answer the condition since global oil price is not something AAA could control. The strategy formulations are developed through hexagonal restructure framework.
Keywords: cost leadership, oil price, strategic management
INTRODUCTION
Alpha-AA Company (AAA) operates Omega production sharing contract (PSC) located in central Sumatra, Indonesia. Alpha operates with the partnership of Special Task Force for Upstream Oil and Gas Business Activities (SKK Migas) through PSC with contract that will end in 2021. As of end of December 2015 the average oil production in AAA is 285 million barrel oil equivalent per day (MBOEPD) came from areas of operations in Sumatra i.e. Metro, Delta, Papa, Lima and Bravo. The main office for AAA Operations is located in Someo- and oil final terminal is located in Fcho/ BBB has been Jndonesias largest producer of crude oil which delivers approximately 35% of national production.
Year 2015 was a challenging year for Alpha Corporation and the entire oil gas industry. Alpha Corporation achieved a 2.5% return on capital employed versus the 10.9% achieved in 2014. In light of difficult market conditions, Alpha Corporation took significant actions to reduce costs and improve net cash flow. It reduced capital and operating expenses through renegotiating contracts with vendors and suppliers, streamlining organizations to reduce employee and contractor workforce, deferring and canceling projects not economic at low prices, and selling nonstrategic and other assets. Even though the upstream business had a number of notable accomplishments during 2015 by the increase of Alpha Corporation worldwide net oil-equivalent production by 2%, it did not cope with the lowering of oil and gas commodity price.
Fluctuation in the price showed on the trend in benchmark prices for Brent crude oil, and West Texas Intermediate (WTI) crude oil as shown on the table below.
Table 1 Oil Price Comparison
Description February 2016 Average 2015 Average 2014
WTI (Oil) $31 per barrel $52 per barrel $99 per barrel
Brent (Oil) $29 per barrel $49 per barrel $93 per barrel
In April 2016, Alpha Corporation announced a loss of US$725 million for 2016 first quarter, compared with earnings of US$2.6 billion in the 2015 first quarter. The decline merely impacted by a more than 35% decline in crude oil prices. Earnings for the upstream segment are closely aligned with industry prices for crude oil. Crude oil price is subject to external factors over which the company has no control, including product demand connected with global economic conditions, industry inventory levels, technology advancements, production quotas or other actions imposed by the Organization of Petroleum Exporting Countries (OPEC), actions of regulators, weather-related damage and disruptions, competing fuel prices, and regional supply interruptions or fears thereof that may be caused by military conflicts, civil unrest or political uncertainty. Any of these factors could also inhibit the companys production capacity in an affected region.
LITERATURE REVIEW
Business level strategy is a set of commitments and actions are integrated and coordinated to gain a competitive advantage by leveraging core competencies in specific product markets as explained by Hitt, Ireland & Hoskisson (2013). Factors to differentiate business level strategies are basis for customer value (cost and/or distinctiveness), and target market (broad and/or narrow market segment). Those factors will define five business strategies i.e. cost leadership, focused cost leadership, differentiation, focused differentiation and integrated cost leadership/differentiation. Adopted from Hitt, Ireland and Hockisson, AAA should use cost leadership based on view from competitive scope (broad target) and competitive advantage (cost). The target is the lower the better without sacrificing the safe operational standard. In term of corporate level strategy, AAA falls under low diversification with crude oil as dominant business. While Alpha Corporation has moderate to high level of diversification with related constraints product such as upstream, mid stream and downstream.
Wheelen & Hunger (2012) defines environmental scanning is the monitoring, evaluation, and dissemination of information from the external and internal environments to key people within the corporation. A corporation uses this tool to avoid strategic surprise and to ensure its long-term health. To formulate the business strategy, company has to do an environmental scanning to identify opportunities, threats, and its internal environment which was strength and weakness. According to Ireland, Hoskisson & Hitt, (2013), the environment divided into two factors i.e. external and internal factors.
External Factors
This part will evaluate condition outside company that affects the business. Oil and gas industry in Indonesia is regulated closely by government due to its criticality to support the country economic. Meanwhile, most of the oil and gas operators are subsidiaries from global corporation with headquarter outside Indonesia. Wheelen & Hunger (2012) explained that the environmental observation was the monitoring, evaluation and dissemination of information from the external and internal environments to key people within the corporation. The external environment consisted of three variables i.e. natural environment, social environment and task environment.
Other reference regarding external environment from Ireland, Hoskisson & Hitt (2013) defined firms understands the external environment by acquiring information about competitors, customers, and other stakeholders to build their own base of knowledge and capabilities/ B firms strategic actions are influenced by the conditions in the three parts (the general, industry, and competitors).
E\_aR_i` ;VcR ;\_PR`
products, bargaining power of suppliers, bargaining power of buyers, and intensity of rivalry among competitors. Three of the five forces relate to the industry participants. The other two relate to the vertical participants•the suppliers and consumers.
The first force analyzes the ease of entry for new participants in the marketplace. If entry is easy, then this factor indicates a high level of competition. The second factor is the possibility of a new good or service coming onto the market and eroding sales of established products. Uhe third factor evaluates the number and activity of a companys rivals/ Obviously, the more established rivals, the greater the competition. However, a manager also needs to assess the likelihood that any one rival can dominate the market to the detriment of all the other participants. The fourth factor is the bargaining power of the industry suppliers. If there are few suppliers who provide a scarce resource, competition may get heavy for that resource, thus increasing costs and eroding profits. The fifth and final factor is the consumers bargaining power/ If the consumer has a strong bargaining position then this will drive down prices for the finished good and erode profitability.
All five competitive forces jointly determine the intensity of industry competition and profitability, and the strongest force or forces are governing and become crucial from the point of view of strategy formulation. The summaries of forces are as follows:
1. Threat of new entrants: High
High threat of new entrants meaning possibility of new players go into the industry is very limited due to economies of scale, high capital invested, low switching cost, complicated government regulations, environmental regulations, and technology (patent and copyrights).
2. Threat of substitute products: Low
It is low substitute products or services nowadays due to limited availability of commercial company take part on the renewable energy production. Even though there are a lot of varieties of renewable energy available in Indonesia that requires further exploration. Threat of substitute currently low, but it is likely to change in longer run. Type of substitutes products are geothermal, hydropower, solar and wind. Coal and nuclear are also considered as substitute product.
3. Bargaining power of suppliers: Low
Given the current oil price, the bargaining power of supplier is low due to low investment and on-going projects availability.
4. Bargaining power of buyers: High
Robust bargaining power of buyer powered reduction in the price when the supply of oil is abundant. Big country consumers may affect global demand. In this case, buyers bargaining power become increasing.
5. Intensity of rivalry among competitors: Medium
External Factor Analysis Summary (EFAS)
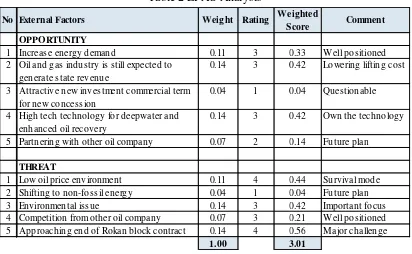
According to Wheelen & Hunger (2012), External Factor Analysis Summary is one way to organize the external factors into the generally accepted categories of opportunities and threats as well as to analyze how well a particular companys management )rating* is responding to these specific factors in light of the perceived importance (weight) of these factors to the company. The EFAS of this research is shown on the table below.
Table 2 EFAS Analysis
As indicated on EFAS summary, AAA total weight is 3.01 meaning the company strategy was slightly above average among the major oil operating companies in Indonesia.
Internal Factors
Internal factors were formed by the strength, and weaknesses of the internal factors of the company that would give certain benefit or loss in fulfilling the need of the company target market. The internal factors that will be assessed are organization structure, culture, value chain analysis and finance analysis. The data gathered based on in-depth interview, focus group discussion, and Corporation annual report.
Organization structure of AAA organization had gone through organizational transformational review as part of Alpha-A Business Unit Transformation. The new organization starts effective in second quarter 2016. This is to transform the organization into a flexible, efficient, sustainable and competitive with clear value proposition in the Alpha Corporation and the country the operation located. The background of the changes was to transform the current business that increase in operating cost, decrease in production, and change on the business environment climate. The previous organization was complex,
No External Factors Weight Rating Weighted
Score Comment
OPPORTUNITY
1 Increase energy demand 0.11 3 0.33 Well positioned 2 Oil and gas industry is still expected to
generate state revenue
0.14 3 0.42 Lowering lifting cost
3 Attractive new investment commercial term for new concession
0.04 1 0.04 Questionable
4 High tech technology for deepwater and enhanced oil recovery
0.14 3 0.42 Own the technology
5 Partnering with other oil company 0.07 2 0.14 Future plan
THREAT
1 Low oil price environment 0.11 4 0.44 Survival mode 2 Shifting to non-fossil energy 0.04 1 0.04 Future plan
3 Environmental issue 0.14 3 0.42 Important focus
4 Competition from other oil company 0.07 3 0.21 Well positioned 5 Approaching end of Rokan block contract 0.14 4 0.56 Major challenge
layered and geographically dispersed organization. The transformational organization is expected to have better support and align with the planned near and long term activity level. Culture of the company should unite the ~3,000 employees the value way of work to support the company in a single platform. Value in Alpha is called the Alpha Way. The Alpha Way is used for all Alpha employees worldwide not only in Sumatra. The values are distinguished and guided the action.
Value chain of Alpha is focus only for upstream oil industry not cover mid stream and down stream. According to Porter (1980), every company is a group of activities which held to design, make, marketing, deliver and support the product. All of those activities can be drawn by using the value chain. The value chain of Alpha comprises of land acquisition, exploration, appraisal, development, and production. The difference between the competitors value chain is the source of competitive lead/ Grom the value chain activities of AAA, the influences of value creation in the income statement are price, cost and tax. Price and tax are two components that company could not control. Price is merely dictated by world market related with supply and demand of the crude oil in the market. Taxation is related with compliance to the government monetary term. The only thing that company could control is cost. Company should do its best to operate efficiently. Related with the value chain activities, some examples that could help reducing the cost are as follows minimize the carbon footprint, safeguard assets, optimize the drilling configuration, ensure pipeline operations, reduce maintenance costs, improve oil well planning, maintain lean operations, streamline event and field management.
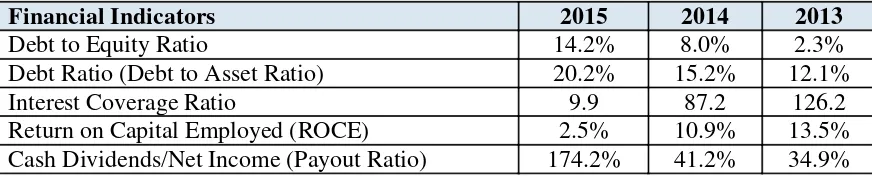
Financial indicators shows that the company mission to provideabove-average returns to the stakeholders are quite challenging based on stability/capital structure ratio analysis as shown below.
Table 3 Capital Structure Ratio
Financial Indicators 2015 2014 2013
Debt to Equity Ratio 14.2% 8.0% 2.3%
Debt Ratio (Debt to Asset Ratio) 20.2% 15.2% 12.1%
Interest Coverage Ratio 9.9 87.2 126.2
Return on Capital Employed (ROCE) 2.5% 10.9% 13.5%
Cash Dividends/Net Income (Payout Ratio) 174.2% 41.2% 34.9%
Stability/capital structure ratio showing that debt to equity ratio and debt ratio become higher in 2015 compare to 2014 and 2013. It means that the company need more debt to finance the projects/activities. On the interest coverage ratio, it showed that the company had more challenges in pay the interst of outstanding debt. 2015 ratio is lower that 2014 and 2013. It means that the more its debt expenses burden the company.
company is paying out more in dividends than it makes in net income. Therefore, lower payout ratio is preferable to higher payout ratio.
Internal Factor Analysis Summary (IFAS)
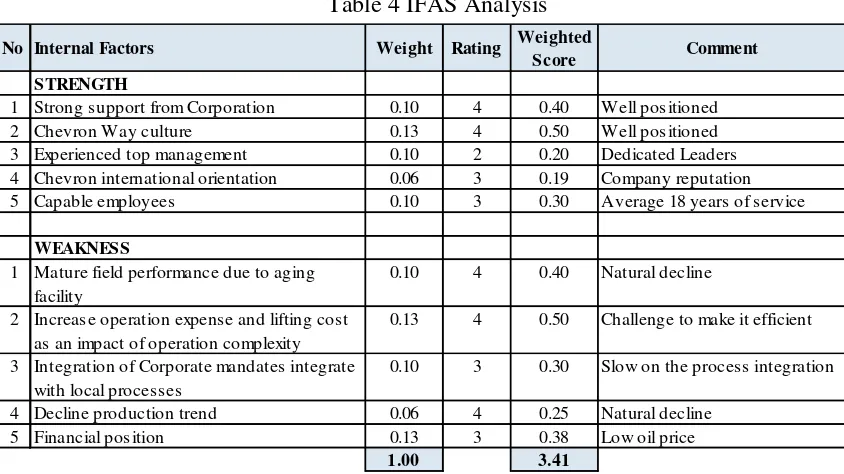
According to Wheelen & Hunger (2012), IFAS is one way to organize the internal factors into the generally accepted categories of strengths and weaknesses as well as to analyze how well a particular companys management is responding to these specific factors in light of the perceived importance of these factors to the company.
Table 4 IFAS Analysis
As indicated on IFAS summary above, AAA total weight is 3.41 meaning the company strategy was slightly above average compared to the strengths and weaknesses of others in the major oil operating companies in Indonesia.
METHODOLOGY
The methodology used qualitative method. The data are taken from secondary sources such as annual report, books, consultant reports, journals and company website. Also, interviews and focus group discussion were conducted to validate the data. Selected respondents for interview are Leadership level in AAA Company. The external environment data were taken from various journals and information from internet. While, the internal environment data are taken from internal reports of the company.
RESULTS
The research used the strategic management framework to close the strategic gap exist and determine how to close the gap. After external and internal environment were scanned. The next step is to analyze using SWOT, TOWS and hexagonal restructuring. Then, it could be
No Internal Factors Weight Rating Weighted
Score Comment
STRENGTH
1 Strong support from Corporation 0.10 4 0.40 Well positioned 2 Chevron Way culture 0.13 4 0.50 Well positioned 3 Experienced top management 0.10 2 0.20 Dedicated Leaders 4 Chevron international orientation 0.06 3 0.19 Company reputation 5 Capable employees 0.10 3 0.30 Average 18 years of service
WEAKNESS
1 Mature field performance due to aging facility
0.10 4 0.40 Natural decline
2 Increase operation expense and lifting cost as an impact of operation complexity
0.13 4 0.50 Challenge to make it efficient
3 Integration of Corporate mandates integrate with local processes
0.10 3 0.30 Slow on the process integration
4 Decline production trend 0.06 4 0.25 Natural decline 5 Financial position 0.13 3 0.38 Low oil price
used to evaluate the strategies followed by the strategy implementation as shown on figure below.
Figure 2. Research Framework
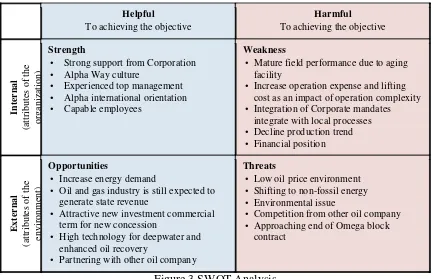
According to Wheelen & Hunger (2012), SWOT is an acronym used to describe the particular Strengths, Weaknesses, Opportunities, and Threats that are strategic factors for a specific company. The external environment consists of variables (Opportunities and Threats) that are outside the organization and not typically within the short-run control of top management. The internal environment of a corporation consists of variables (Strengths and Weaknesses) that are within the organization itself and are not usually within the short-run control of top management. These variables form the context in which work is done. Uhey include the corporations structure- culture- and resources/ Cased on external and internal factor analysis the summary of SWOT table is shown below.
Helpful
t Mature field performance due to aging facility
t Increase operation expense and lifting cost as an impact of operation complexity t Integration of Corporate mandates
t Oil and gas industry is still expected to generate state revenue
t Attractive new investment commercial term for new concession
t High technology for deepwater and enhanced oil recovery
t Partnering with other oil company
Threats
t Low oil price environment t Shifting to non-fossil energy t Environmental issue
t Competition from other oil company t Approaching end of Omega block
contract
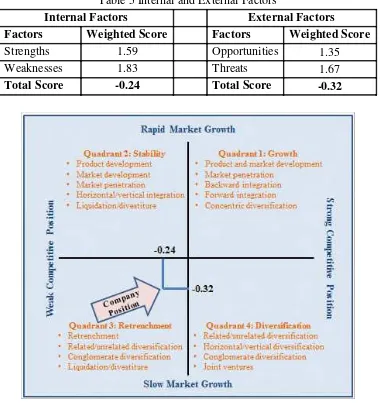
Based on SWOT, EFAS, and IFAS, the company position in Grand Strategy Matrix can be determined as shown on figure below. Grand strategy matrix is a strategic tool to have insight of strategic planning options for company either in strong or weak competitive positions in industry experiencing either rapid or slow growth.
Table 5 Internal and External Factors
Internal Factors External Factors
Factors Weighted Score Factors Weighted Score
Strengths 1.59 Opportunities 1.35
Weaknesses 1.83 Threats 1.67
Total Score -0.24 Total Score -0.32
Figure 4 Grand Strategy Matrix
From the company position in SWOT matrix, the position can be interpreted as follows:
1. Oil price decline is still the biggest threat for AAA.
2. Aging facilities and operating cost increase impact the ability of AAA to generate more revenues.
3. Environmental issue related with minimizing carbon footprint is still a challenge effort. 4. Oil energy demand is still high in the market and oil company is still expected to generate
5. The position is in quadrant 3 (retrenchment/turnaround).
The retrenchment/turnaround strategy is used when a company is experiencing profit stagnation- decline or other serious problems/ Jt is an attempt to change the companys strategy in the hopes of reversing its fortunes. In order to turn a firm around, the company should change the direction of the company.
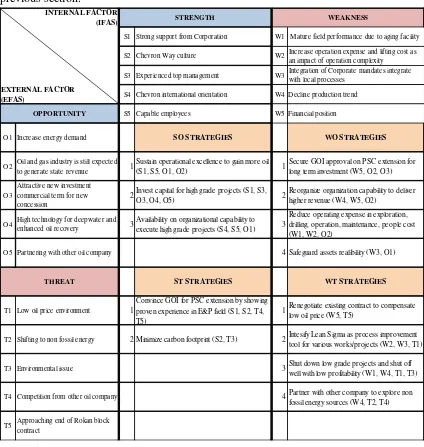
TOWS Matrix
Uhe strategy options can be developed through UPXT matrix to show the companys strategy alternatives. The strategy options whether competitive or conservative can be also formulated. Based on Wheelen & Hunger (2012) there are four strategies in TOWS matrix. The TOWS matrix was developed based on SWOT analysis that was discussed on the previous section.
Figure 5 TOWS Matrix INTERNAL FACTOR
(IFAS)
S1 Strong support from Corporation W1 Mature field performance due to aging facility
S2 Chevron Way culture W2 Increase operation expense and lifting cost as an impact of operation complexity
S3 Experienced top management W3 Integration of Corporate mandates integrate with local processes
S4 Chevron international orientation W4 Decline production trend
S5 Capable employees W5 Financial position
O1 Increase energy demand SO STRATEGIES WO STRATEGIES
O2 Oil and gas industry is still expected to generate state revenue 1
Sustain operational excellence to gain more oil
(S1, S5, O1, O2) 1
Secure GOI approval on PSC extension for long term investment (W5, O2, O3)
O3
Attractive new investment commercial term for new concession
2Invest capital for high grade projects (S1, S3,
O3, O4, O5) 2
Reorganize organization capability to deliver higher revenue (W4, W5, O2)
O4 High technology for deepwater and
enhanced oil recovery 3
Availability on organizational capability to execute high grade projects (S4, S5, O1) 3
Reduce operating expense in exploration, drilling, operation, maintenance, people cost (W1, W2, O2)
O5 Partnering with other oil company 4 Safeguard assets realibility (W3, O1)
ST STRATEGIES WT STRATEGIES
T1 Low oil price environment 1
Convince GOI for PSC extension by showing proven experience in E&P field (S1, S2, T4, T5)
1Renegotiate existing contract to compensate low oil price (W5, T5)
T2 Shifting to non fossil energy 2 Minimize carbon footprint (S2, T3) 2Intesify Lean Sigma as process improvement tool for various works/projects (W2, W3, T1)
T3 Environmental issue 3Shut down low grade projects and shut off
well with low profitability (W1, W4, T1, T3)
T4 Competition from other oil company 4Partner with other company to explore non
fossil energy sources (W4, T2, T4)
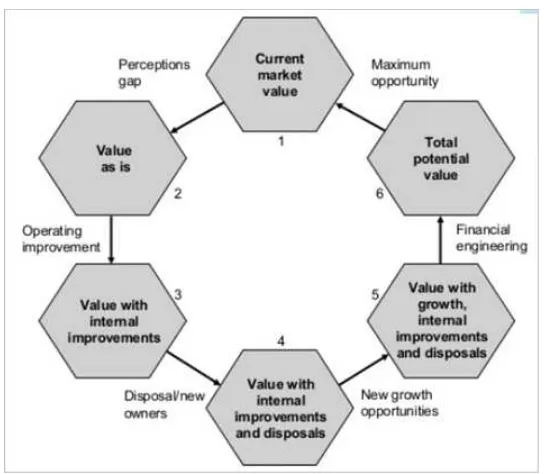
Hexagonal Restructure Framework
Hexagonal restructure framework can be used as a tool in restructure the company in order to unleash the value. Company still has significant untapped potential to create value by improving the operations, restructuring their portfolios, managing the balance sheets, and improving the governance. Management can also take measures to ensure that current market valuations reflect current strategy and performance, as well as improvements over time. Hexagonal restructure framework can help the company to examine restricting opportunities. The framework uses six dimension hexagon analysis as follows.
Figure 6 Hexagonal Framework
Current Market Value.
All the financial indicators in 2015 are not favorable compare to 2014 and 2013 as with the example shown on table 3 regarding Capital Structure Analysis Ratio. The ideal situation is targeting 2014 capital structure with payout ratio 41.2% with reason that the average oil price was US$99 per barrel compare to 2013 with US$108 per barrel.
Perception gap that need to address to boost better capital structure are as follows: 1. Operating expense increasing, production decreasing, changing business environment. 2. Organization and contracts in place set up to operate with different activity levels than
what is currently planned in both the near term and long term outlooks. 3. Complex, layered, and geographically dispersed organization.
Based on TWOS matrix the gap could be addressed through alternatives as follows: 1. Reduce operating expense in exploration, drilling, operation, maintenance, people cost. 2. Intensify Lean Sigma as process improvement tool for various works/projects.
Value As Is.
The payout ratio of 2015 was 174.5% meaning the sustanaibility of a company dividend payments is at risk since ratio more than 100% indicates that the company is paying out more in dividends than it makes in net income. It will become worst in 2016 if the company does not do anything. The Alpha Corporation total earning for 2015 was down 76% reduction compare to 2014. Based on first quarter 2016 financial report, the earning was minus US$725 million was impacted by a more than 35% decline in crude oil price.
The effort is focused on improving free cash flow, lower cost structure with better pricing, work flow efficiency, and matching organization size to expected future activity level. This is to aim capital spending is coming down. Therefore, the company can achieve to have high return, shorter cycle projects and pacing longer cycle investment.
Downscoping is a strategic approach to restructuring, in this case some other means of eliminating activities that are unrelated to a companys core businesses/ Uhe impact of downscoping in short term is to reduce debt/cost and emphasize in strategic control. The expected outcome in the long term is higher performance organization.
As mention on TOWS strategy alternatives the downscoping can be carried out through reducing operating expense, process improvement through lean sigma, and shut down low grade projects. The elements that are identified as follows:
1. Consolidated and right sized infrastructures to be in line with the reduced activities such as convert Metro and Echo camps from residential camp to industrial camp only, close down golf course in Metro, Echo and half of golf course (9 holes) in Delta, relocate all expatriates to Romeo to enable closing expatriate school in Delta, shut down low profitability wells.
2. Revised internal policies to support activity reduction or cost savings such as housing policy (increase housing deduction for in-camp occupants), bachelor quarter policy (eliminate free meals at messhall and laundry services), in-camp transportation (eliminate in-camp shuttle bus service and taxi service for non operational activities), introduce rotator policy with new work schedule scheme and enable the employee to live in any location outside residential camp.
Value with Internal Improvements.
By consolidated and right sized infrastructure and revised internal policy, the value is decreasing in level of activities that resulted decreasing in organization capability to support it in term of number of employee, number of contractors, number of contracts.
Value with Internal Improvements and Disposal.
organization size, it is reduced by 25% and the new organization become more flexible with less reporting layer and higher span of control.
Value with Growth.
Since the Omega block PSC will end in 2021, decision to growth strategy will be known 2-year prior the contract end (2019). Based on TOWS strategy alternative, the strategy also include securing GOI approval on PSC extension for long term investment and convincing GOI for PSC extension by showing proven experience in E&P fields. These strategies will enable the company to open up opportunity for long term investment.
Company also withhold the obligation to safeguard the environmental requirement on carbon footprint reduction and compliance to law number 32 Year 2009 regarding Environmental Protection and Management. Company has commitment to meet standard environmental quality requirements and to follow abandonment and site restoration activities at the end of contract. The activities include but not limited to soil remediation and asset retirement strategy. This effort will support growth strategy to act as prudent operator.
Total Potential Value.
This value could not be determined at this point since the decision on growth strategy will depend on the milestone of GOI approval on PSC extension decision in 2019.
CONCLUSION
To conclude, AAA should be consistent in performing cost leadership strategy since the global oil price is not something that AAA could control. By having efficient operations, it will reduce the lifting cost and widened the revenue margin. In the implementation plan, the milestones are developed and key performance indicators are assigned to responsible person in charge. Alignment among the balanced scorecard with the actual will be monitored using the dashboard as performance measurement system which is interactive for strategy execution tracking.
AAA should clarify the strategy by adding the possibility whether the Omega block will be extended or not because it will change the business strategy from cost leadership to other strategy to prove that the company has all the features to be eligible as the prudent operator for next contract term (another 10 year extension).
REFERENCES
Alpha A corporation web page. [Online] Available at: https://www.xxxxxx.com/-/media/xxxxxx/stories/documents/1Q16-earnings-press-release.pdf, [Accessed in May 2016]
Carlesi, L., Verster, B., and Wenger, F., 2007. The New Dynamics of Managing the
Corporate Portfolio. McKinsey on Finance Number 23. [Online] Available at:
www.mckinsey.com/Client.../Latest.../MoF_Issue_24_Summer%2007.ashx
[Accessed June 2016]
David, F.R., 2009. Strategic Management. 12thed. New York: Pearson Education Inc. Hitt, M. A., Ireland, R. D., & Hoskisson, R. E., 2013. The Management of Strategy
-Concepts and Cases, 10th ed. Ohio: South Western Cengage Learning.
Kaplan, R. S., & Norton, D. P., 2008. The Execution Premium: Linking Strategy to Operation for Competitive Advantage.Massachussets: Harvard Business Press. Porter, M.E., 1985. Competitive Advantage: Creating and Sustaining Superior
Performance. New York: N.Y. Free Press.
Porter, M.E., 2007. Understanding Industry Structure. Massachussets: Harvard Business School.
Porter, M.E., 1996. What is Strategy? Harvard Business Review, November-December 1996.
PWC, May 2016. Oil and Gas in Indonesia: Investment and Taxation Guide. 7th ed.
[Online] Available at:
https://www.pwc.com/id/en/publications/assets/oil_and_gas_guide_2014.pdf
[Accessed June 2016]