Iranian Journal of Basic Medical Sciences
ijbms.mums.ac.irGreen tea extract protects endothelial progenitor cells from
oxidative insult through reduction of intracellular reactive
oxygen species activity
Wahyu Widowati
1*, Rahma Micho Widyanto
2, Winsa Husin
1, Hana Ratnawati
1, Dian Ratih
Laksmitawati
3, Bambang Setiawan
4, Dian Nugrahenny
5, Indra Bachtiar
61 Medical Research Center, Faculty of Medicine, Maranatha Christian University, Jl. Prof. Drg. Suria Sumantri 65, Bandung 40164, West Java, Indonesia 2 Biomolecular and Biomedical Research Center, Aretha Medika Utama, Jl. Babakan Jeruk 2 no 9, Bandung, 40163, West Java, Indonesia
3 Faculty of Pharmacy, Pancasila University, Jl Jagakarsa, Jakarta, Indonesia
4 Department of Medical Chemistry and Biochemistry, Faculty of Medicine, Lambung Mangkurat University, Banjarmasin, South Kalimantan, Indo nesia 5 Department of Pharmacology, Faculty of Medicine, Brawijaya University, Jl. Veteran, Malang, 65145, East Java, Indonesia
6 Stem Cell and Cancer Institute, JL. A. Yani no.2 Pulo Mas, Jakarta, 13210, Indonesia
A R T I C L E I N F O A B S T R A C T
Article type: Original article
Objective(s):Many studies have reported that tea consumption decreases cardiovascular risk, but the mechanisms remain unclear. Green tea is known to have potent antioxidant and free radical scavengingactivities. This study aimed to investigate whether green tea extract (GTE) can protect endothelial progenitors cells (EPCs) against oxidative stress through antioxidant mechanisms.
Materials and Methods: Mononuclear cells (MNCs) were isolated from peripheral blood by density gradient centrifugation with Ficoll. The cells were then plated on fibronectin-coated culture dishes. After 7 days of culture, EPCs were characterized as adherent cells double positive for DiI-ac-LDL uptake and lectin binding. EPCs were further identified by assessing the expression of CD34/45, CD133, and KDR. EPCs were then treated with hydrogen peroxide (H2O2) at doses of 50, 100, 200
µM and incubated with or without GTE (25 µg/ml). The intracellular reactive oxygen species (ROS)
levels were detected by flow cytometry using a ’, ’-dichlorofluorescein diacetate (DCF-DA) fluorescentprobe.
Results: GTE ameliorated the cell viability of EPCs induced by H2O2 at doses of 50, 100, 200 µM for
about 25.47, 22.52, and 11.96% higher than controls, respectively. GTE also decreased the intracellular ROS levels of EPCs induced by H2O2 at doses of 50, 100, 200 µM for about 84.24,
92.27, and 93.72% compared to controls, respectively.
Conclusion: GTE improves cell viability by reducing the intracellular ROS accumulation in H2O2
-induced EPCs.
Article history: Received: Oct 12, 2013 Accepted: Jun 19, 2014
Keywords:
Antioxidant
Endothelial progenitor cells Green tea
Oxidative stress Reactive oxygen species
►
Please cite this paper as:Widowati W, Widyanto RM, Husin W, Ratnawati H, Laksmitawati DR, Setiawan B, Nugrahenny D, Bachtiar I. Green tea extract protects endothelial progenitor cells from oxidative insult through reduction of intracellular reactive oxygen species activity. Iran J Basic Med Sci 2014; 17:702-709.
Introduction
Endothelial dysfunction plays an important role in pathogenesis of atherosclerosis caused by cardio-vascular risk factors. It has been observed in patients with established coronary artery disease or coronary risk factors (1). Endothelial progenitor cells (EPCs), a kind of stem cells forming a new vessel, play critical roles in maintaining the vessel tone and repairing the endothelial cells injury (2-5). Recent studies indicated that the number of circulating EPCs reduces in patients with atherosclerosis risk factors leading to the development of atherosclerosis lesions (6, 7).
Endothelial dysfunction is closely related with increased oxidative stress and may be reversed by antioxidant treatment (2, 8). Previous studies suggested that flavonoids may improve endothelial
function (8, 9). Flavonoids have powerful antioxidant properties and they exert their effects by scavenging free radicals (10, 11). Previous studies also suggested that tea flavonoid prevents LDL (low density lipoprotein) oxidation, inflammatory, endothelial dysfunction that is crucial to the development of atherosclerotic plaque (8, 12).
Tea from Camellia sinensis is the second most
widely consumed beverage in the world after water (13-15). Many studies have reported the relation between tea consumption and cardiovascular risk (15-17), and suggested that the risk reduction is due to flavonoid compounds in tea (8, 9, 18, 19). Other studies also indicated that dietary flavonoid from tea and other sources (such as red wine, apples, onions, chocolate, blueberries, and strawberries) is related
with reduced cardiovascular risk (20-23). Green tea has abundant flavonoids, including catechins (30-36% of dry weight), and epigallocatechin-3-gallate (EGCG) constitutes up to 63% of total catechins in tea (24). The antioxidant activity of EGCG has been shown to be 25-100 times more potent than vitamins C and E (25). We hypothesized that green tea extract (GTE) is able to protect EPCs from oxidative stress through antioxidant mechanism, thereby contributes to the protective effect on endothelial cells. To test this hypothesis, we assessed the protective effects
and ROS-inhibiting effects of GTE on H2O2-induced
oxidative damage in human EPCs.
Materials and Methods
Preparation and extraction of green tea
Dried green tea leaves was obtained from PT. Perkebunan Nusantara (PTPN) VIII, Bandung, west Java Indonesia. Green tea was planted and harvested from Cisaruni plantation, Garut, West Java. The dried green tea leaves contained water level 7.15%; protein 22.00%; fiber 14.33%; ash 5.13%, crude lipid 1.33%; carbohydrate 57.31%. The green tea plant were identified by staff of herbarium, Department of Biology, School of Life Sciences and Technology, Bandung Institute of Technology, Bandung, West Java, Indonesia. The green tea plant was identified as
Camellia sinensis L. Kuntze or Thea sinensis (L.),
Camellia theifera Griff. The preparation and
extraction of green tea were performed according maceration extraction method (12, 26, 27). One kilogram of dried green tea leaves was extracted with distilled methanol 96% by maceration method for 5 days filtered and collected until the colorless methanol filtrate. The collected methanol filtrate was evaporated using rotatory evaporator to produce methanol extract of green tea 173.9 g or 17.39%. The
methanol extract of green tea was stored at 4°C.
Superoxide dismutase (SOD) assay
The SOD assay was done using a SOD assay kit (Cayman) comprising assay buffer, sample buffer, radical detector, SOD standard, and xanthine oxidase.
SOD standards were prepared by introducing μl
diluted radical detector and μl SOD standard
(7-level standard) per well. Green tea extract was dissolved in DMSO in concentrations of 500, 125, and 31.25 µg/ml (27). The sample well contained 200 µl diluted radical detector and 10 µl sample. All wells were added 20 µl diluted xanthine oxidase. The mixtures were shaken carefully for few seconds, incubated for 20 min at room temperature, SOD activity was measured on a microplate reader at 450 nm (Cayman). The SOD value was calculated using the equation from the linear regression of standard curve substituting linear rate (LR) for each sample.
Total phenol content
Total phenol content was assayed according to
the Folin–Ciocalteu method. Samples μl) were
introduced into microplate; μl of Folin-Ciocalteu’s
reagent . M and μl of sodium carbonate
(7.5%) were added. The samples were mixed and
incubated at 45°C for 15 min (28). Subsequently,
absorbance value was measured at 760 nm. The total phenolic content expressed as Epigallocatechin Gallate equivalent (EGCGE) and Gallocatechin equivalent (GCE) was calculated by the following formula:
where C: total content of phenolic compounds, μg/mg
green tea extract, in EGCGE and in GCE;
c: the concentration of EGCG or GC established from
the calibration curve, μg/ml;
V: the volume of extract (ml); m: the weight of green tea extract (mg).
Total phenol value was obtained from the regression equation for EGCG: Y=0.0048X+0.036, with
R2=0.99 and for GC: Y=0.02X+0.057 with R2=0.97.
ABTS-reducing activity
The antioxidant capacity green tea extract was
measured using the , ’
-Azinobis-(3-ethylbenzo-thiazoline-6-sulfonic acid) (ABTS•+) diammonium
salt free radical assay (29, 30, 31). ABTS•+ was
produced by reacting 14 mM ABTS and equal volume of 4.9 mM potassium persulfate achieved final concentration of 7 mM ABTS in 2.45 mM potassium persulfate. The mixture was incubated in the dark
room temperature for 16 h. The ABTS•+ solution was
diluted with 5.5 mM PBS (pH 7.4) and measured with microplate reader at 745 nm, resulting the
ABTS•+ absorbance in the presence of the test sample
relative to the ABTS•+ absorbance in the absence of
the test sample (negative control). ABTS-reducing activity (%) was then continued to be calculated as
median inhibitory concentration (IC50).
Ferric reducing antioxidant power (FRAP) assay
The ferric reducing antioxidant power assay (FRAP) of each standard solution and sample were measured according to a modified protocol developed
by Mishra et al (2006) (32). The FRAP reagent was
prepared by adding 2,4,6-tripyridyl-s-triazine (TPTZ)
and ferric chloride, forming the Fe3+–TPTZ complex.
Antioxidant reduced to Fe2+– TPTZ at low pH was
measured at 595 nm. The standard curve was linear
between 0.019 and μg/ml FeSO4. Results were
expressed in μM Fe )) /μg extract and compared with
Table 1. The mean of SOD activity (U/ml) of GTE. SOD activity was measured in triplicate for each concentration of GTE. Linear equation, coefficient of regression (R2) of SOD standard, and SOD
activity of GTE were calculated. The data are presented as mean±standard deviation
Sample Concentrations of green tea extract μg/ml)
500 125 31.25
Mononuclear cells (MNCs) were isolated from peripheral blood of healthy young human volunteers by Ficoll-Paque plus (GE Healthcare) using density gradient centrifugation. MNCs were then plated on culture dishes coated with human fibronectin (Roche)
and cultured in VascGrowTM medium (Stem Cell and
Cancer Institute) at 37°C in a 5% CO2 incubator. After
4 days of culture, medium were changed and the culture was maintained through day 7. Informed
consent was obtained from all volunteers and all
procedures performed in this study were approved by Research Ethics Committee of Faculty of Medicine, Maranatha Christian University and Immanuel Hospital, Bandung, Indonesia.
EPCs characterization
EPCs were characterized as adherent cells after 7 days of culture. Direct fluorescent staining was used to
detect dual binding of Fluorescein isothiocyanate
-conjugated Ulex europaeus agglutinin I (FITC-UEA-I;
Sigma) and 1,1-dioctadecyl-3,3,3,3-tetramethylindo-carbocyanine-labeled acetylated LDL (DiI-ac-LDL; Invitrogen). To detect the uptake of DiI-ac-LDL,
adherent cells were incubated with DiI-ac-LDL
(1 mg/ml) at 37°C for 4 hr. Cells were then fixed with
3% paraformaldehyde for 10 min. After washing, cells were incubated with FITC-UEA-I (1 mg/ml) at 37°C
for 1 hr. Cell nuclei were also stained with ′, ′
-diamidino-2-phenylindole (DAPI; Invitrogen). Finally, cells were observed using an inverted fluorescence microscope (Axiovert 40 CFL, Zeiss). Cells that were double positive for DiI-ac-LDL and lectin were defined as EPCs (35).
Further identification of EPCs was performed using fluorescence-activated cell sorting (FACS) analysis. Adherent cells were detached using trypsin-ethylenediamine tetra-acetic acid (EDTA). Cells (1 x
105) were pre-incubated with FcR blocking reagent
(Miltenyi Biotech) for 15 min at room temperature.
Cells were then incubated at 4°C with FITC-conjugated
anti-CD45/phycoerythrin (PE)-conjugated anti-CD34
(BD Biosciences) and PE-conjugated
anti-Table 2. The mean of phenolic content of GTE and GC was expressed as EGCGE and GCE. The phenolic content was measured in triplicate for each sample. Linear equation, coefficient of conjugated vascular endothelial growth factor receptor 2 (VEGFR2)/KDR (R&D System) for another 40 min. Isotype-identical antibodies served as negative controls. Quantitative FACS was performed
on a FACSCalibur Flow Cytometer(BD Biosciences).
EPCs cytotoxicity assay
EPCs cytotoxicity was performed to determine the maximum tolerance concentration of GTE on EPCs culture and to determine the optimal oxidative
damage concentration of H2O2 for the following
experiments. Cytotoxicity of EPCs was determined by
CellTiter® (Promega) based on quantitative
colorimetric assay. After 7 days of culture, cells were then digested with trypsin-EDTA and cultured at a
density of 5 x 10⁴ cells/ml on 96-well tissue culture
plates using serum-free medium for 24 hr before treatment (28, 36, 37). Cells were then treated with various concentrations of GTE (3.13-100 µg/ml) and
H2O2 (12.5-400 µM) for 24 hr. EPCs were
supplemented with 20 µL of CellTiter® (Promega)
each well and incubated for another 4 hr. Optical density values were measured at 490 nm using microplate reader (Bio-Rad).
Assessment protective effect of GTE on oxidative damage in EPCs
After 7 days of culture, cells were digested with trypsin-EDTA and 5 x 10⁴ cells were cultured on
96-well tissue culture plates using serum-free medium for 24 hr before treatment. Cells were then treated with GTE (25 mg/l) for 1 hr before treatment with various
concentrations of H2O2 (50, 100, 200 µM) for a
subsequent 24 hr (38). Cell viability was measured by
CellTiter® assay (Promega). Cells treated without H2O2
served as controls. Optical density values were measured at 490 nm using microplate reader (Bio-Rad).The values were expressed as a percentage of control.
Measurement of intracellular reactive oxygen species
The intracellular ROS levels were detected by
flow cytometry using a DCF-DA fluorescent probe
(Invitrogen) according to the method of Jie et al (38)
Table 3. The IC50 of ABTS-reducing activity of GTE and EGCG. ABTS-reducing activity (%) was calculated in triplicate for each
concentration of GTE and EGCG. Seven concentrations of sample included: 5, 2.5, 1.25, 0.625, 0.3.125, 0.156, 0.078, . μg/ml. Linear equation, coefficient of regression (R2) of GTE and EGCG were calculated
Sample The highest activity of ABTS reducing activity (%) Linear equation R2 IC50 μg/ml)
GTE 97.30 Y=17.248X+12.636 0.9197 2.17
Table 4. The FRAP activity. The standard curve was linear between
. and μg/ml FeSO4. [The FRAP activity was calculated in
triplicate for each concentration of GTE and EGCG. Seven concentrations of sample included 25.000, 12.500, 6.250, 3.125, 1.563,
. , . μg/ml. Results of FRAP activity were expressed in μM Fe
)) /μg sample. Linear equation of FeSO4 was Y=0.0064X+0.0445). The
data are presented as mean±standard deviation
Concentration μg/ml FRAP activity (GTE μM Fe )) /μgEGCG
25.000 98.35±1.73 186.16±14.64 12.500 60.76±0.56 163.08±19.40 6.250 34.85±0.86 83.77±3.48 3.125 15.74±0.48 46.19±1.45 1.563 14.42±0.40 31.72±0.41 0.782 11.36±0.71 14.14±0.52 0.391 10.38±0.47 11.92±0.15
Measurement of intracellular reactive oxygen species
The intracellular ROS levels were detected by
flow cytometry using a DCF-DA fluorescent probe
(Invitrogen) according to the method of Jie et al (38)
and Stolzing & Scutt (39) with modification. After 7 days of culture, EPCs were digested with
trypsin-EDTA and 1 x 10⁵ cells were incubated with 10 µM
DCF-DA at 37°C for 30 min. Next, the excess probes
were washed out with phosphate-buffered saline (PBS)+KCl, and then incubated with GTE (25 µg/ml) for 30 min. Cells were then incubated with H2O2 at
final concentrations of 50, 100, and 200 µM' for another hour. Finally, the intracellular ROS levels were measured using FACSCalibur Flow Cytometer
(BD Biosciences). Cells treated with H2O2 without
GTE pre-treatment served as controls. The measured fluorescence values were expressed as a percentage of control.
Table 5. The EPCs functional characterization of DiI-ac-LDL uptake and lectin binding (adherent cells were stained with DAPI and percentage of the double-stained cells was calculated)
No Number of cells
Number of double positive cells (DiI-ac-LDL uptake and lectin binding)
% of double-stained cells
1 30 22 73.33
2 30 25 83.33
3 31 23 74.19
4 30 26 86.67
5 24 22 91.67
6 29 22 75.86
7 26 13 50.00
8 40 20 50.00
9 31 16 51.56
Mean ± SD 70.74 ± 16.28
Statistical analysis
Data are presented as mean, the differences between groups were analyzed using one-way analysis of variance (ANOVA) with SPSS 20.0
statistical package. Only probability values of P<0.05
were considered statistically significant and later
subjected to Duncan’s post hoc test.
Results
Antioxidant activity of GTE
The antioxidant activities of GTE were examined including SOD activity, total phenolic content, ABTS-reducing activity, and FRAP activity. SOD activity was measured in concentrations of 500, 125, and 31.25
μg/ml. GTE showed high antioxidant activity and
similar activity among concentrations (Table 1). Total phenolic content of GTE was measured using the EGCG and GC standard, the phenolic major in green tea. It was demonstrated that compared to the GC, the content of EGCG was higher in GTE (Table 2).
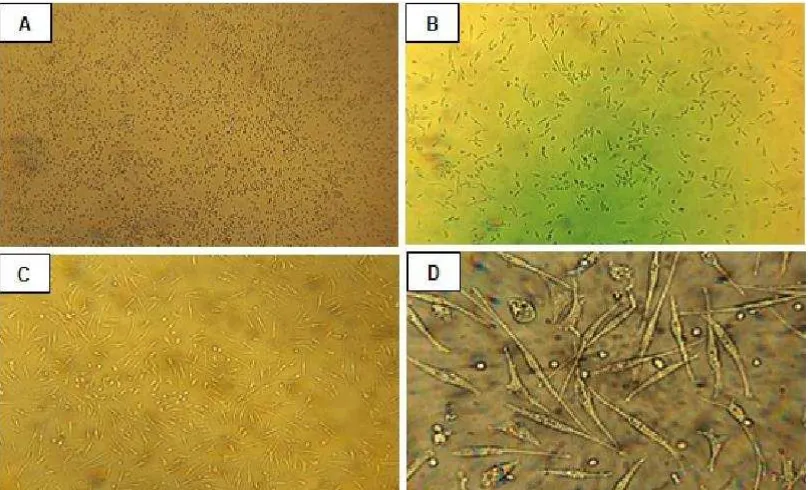
Figure 1. The EPCs morphology characterization. MNCs (A, 400x magnification) were cultured on VascGrowTM medium. Cells exhibited a
Table 6. The expression of EPCs markers (CD34/45, CD133, KDR) identified by flow cytometry. The data are presented as
Mean 0.13±0.041 0.14±0.035 0.23±0.031
As a representative of antioxidant activity, ABTS-reducing activity of GTE was measured using EGCG as the control. The IC50 is the concentration of GTE or
Fe3+-TPTZ complex. The presence of antioxidant will
reduce Fe3+-TPTZ to Fe2+-TPTZ. Based on FRAP
assay, EGCG showed more active antioxidant compared to GTE (Table 4).
EPCs characterization
The attached EPCs proliferated rapidly forming spindle-shaped cells within 4-7 days of culture (40). Beside cell morphology, functional assay was also be used to demonstrate that putative progenitors have endothelial cell potential, including uptake of DiI-ac-LDL (41) and binding of FITC-UEA-1 plant lectin (42). Cell surface markers analysis by flow cytometry has also been used to identify the EPCs.
In the present study, MNCs isolated and cultured for 7 days resulted in attached spindle-shaped endothelial cell-like morphology (Figure 1). EPCs were then characterized as adherent cells double positive for DiI-ac-LDL uptake and lectin binding
(70.74±16.28%) (Table 5). Surface markers
identification of EPCs demonstrated the expression of CD34/45 (0.13±0.041%), CD133 (0.14±0.035%), and KDR (0.23±0.031%) (Table 6).
EPCs cytotoxicity assay
The cell viability was measured using colorimetric method for determining the cytotoxicity assay.
CellTiter® solution (Promega) was used in this study.
Table 8. The effect of GTE pretreatment (25 µg/ml) on H2O2
-induced EPCs
(The cells viability was estimated by CellTiter® assay after
treatment with 50, 100, 200 µM H2O2 for 24 hr. The data are
presented as mean±standard deviation)
Samples Cell viability (%) over negative control (Mean±standard deviation) H2O2 0 µM (Control) 100±3.31 d
differences among the means of groups (concentrations of H2O2 or
H2O2 + GTE) based on Duncan’s post-hoc comparisons (P< 0.05)
The solution contains a novel tetrazolium compound
[3-(4,5-dimethylthiazol-2-yl)-5-(3-carboxy
methoxy-phenyl)-2-(4-sulfophenyl)-2H-tetrazolium, MTS]. The MTS tetrazolium compound is bioreduced by cells into a colored formazan product due to conversion by dehydrogenase enzymes in metabolically active cells (27, 43).
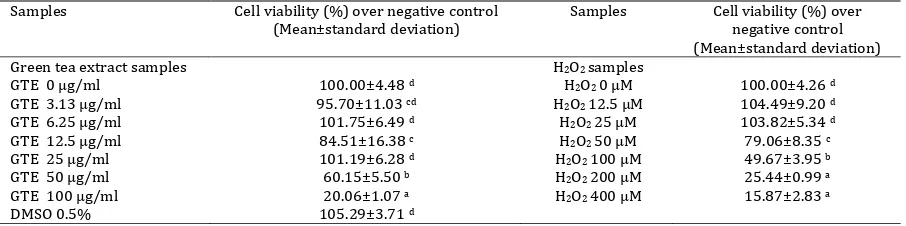
The result of cytotoxicity effect from GTE and H2O2
is shown in Table 7. After treatment with GTE at concentrations of 50 and 100 µg/ml for 24 hr, the viability of cells decreased about 40 and 80%, respectively, relative to the negative controls. Treatment with GTE at concentration of 3.13-25 µg/ml had relatively no effect on cells cytotoxicity.
The cells treated with H2O2 at concentrations of
12.5-25 µM demonstrated no toxicity. The viability of EPCs decreased for about 21, 55, 75, and 84% relative to the negative controls at the concentrations of 50, 100, 200, and 400 µM, respectively. GTE concentration of 25 µg/ml and H2O2 concentrations of
50, 100, and 200 µM had been chosen for independent and dependent concentrations of the following experiments.
Protective effect of GTE on oxidative damage in EPCs
Pre-treatment with 25 µg/ml of GTE on H2O2
-induced EPCs at concentrations of 50, 100, and 200
Table 7. The effect of GTE and H2O2 on cytotoxicity of EPCs
(EPCs were cultured on 96-well tissue culture plates (5 x 10⁴ cells/well) and treated with GTE or H2O2 at a wide range of doses for 24 hr
After treatment, cells were prepared for CellTiter® analysis of cells cytotoxicity)
Samples Cell viability (%) over negative control (Mean±standard deviation)
Samples Cell viability (%) over negative control
among the means of groups (concentrations of GTE/DMSO for the first coloumn and H2O2 for the second coloumn) based on Duncan’s
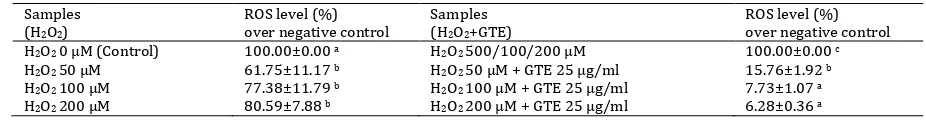
Table 9. The fluorescence intensity of ROS in H2O2-induced EPCs
(The cells were incubated with 10 µM DCF-DA for 30 min and exposed to several doses of H2O2 (50, 100, and 200 µM). The basal level of
ROS with no exposure to H2O2 was obtained by gating with the ROS level of control unstained-DCF-DA cells. High concentrations of H2O2
increased ROS levels in EPCs but not statistically significant. Parallel samples were treated with 25 µg/ml of GTE and the ROS level in cells decreased relative to the controls (H2O2-induced cells) at the concentrations of 50, 100, and 200 µM. The measured ROS levels were
expressed as a percentage of negative controls (cells not induced by H2O2). H2O2 exhibited an increase in ROS level)
Samples
The data are presented as mean±standard deviation. Different superscripts in the same column (a, b, c) indicate significant differences among
the means of groups (concentrations of H2O2 for the first coloumn and H2O2 + GTE for the second coloumn) based on Duncan’s post-hoc
controls (H2O2-induced EPCs), respectively (Table 8).
These data showed that GTE protects the cells from
oxidative damage and ameliorates the H2O2-induced
loss of EPCs viability.
Intracellular reactive oxygen species levels in EPCs
The level of fluorescence intensity is an indicator of ROS production. The basal level of ROS with no
exposure to H2O2 was about 7-16 % compared to
that in controls (unstained-DCF-DA cells). After
treatment with different doses of H2O2 (50, 100, 200
µM) for 1 hr, the level of ROS in EPCs increased for about 7-34 % compared to that in negative controls (untreated cells). When the cells were treated with 25 µg/ml of GTE, ROS levels decreased dose-dependently for about 84.24% (100-15.76%), 92.27% (100-7.73%), and 93.72% (100-6.28%)
(Table 9). Compared to the H2O2-induced EPCs at
concentrations of 50, 100, 200 µM, respectively. The effect of H2O2 concentrations on ROS levels in EPCs hypercholesterolemic rat compared to control without black tea extract (12). It was also suggested that GTE contained high level of EGCG. This result was validated with previous study that GTE contains flavonoids, including catechins (30-36% of dry weight), and EGCG constitutes up to 63% of total catechins (24). Based on ABTS-reducing activity, GTE
and EGCG had high activity with similar IC50. This that EGCG had higher antioxidant activity compared to GTE. Previous study suggested that GTE has high antioxidant and it consists of EGCG. The increase in polyphenol content in green tea will increase its antioxidant activity (44).
The result demonstrated that peripheral blood MNCs were able to differentiate into EPCs during 7-d incubation. EPCs are the precursors of mature endothelial cells and initially defined by the expression of CD34 or the more immature marker protein CD133 and the endothelial marker proteins such as VEGFR2/KDR, von Willebrand factor (VWF), VE-cadherin, DiI-ac-LDL uptake, and lectin binding (35).
Previous studies showed that intracellular
steady-state concentrations of H2O2 above μM are
able to cause oxidative stress (45, 46). Median
cytotoxic concentrations (EC50) decreased from 500
to μM with increase in incubation time from
to 24 hr. Twenty-four-hour treatment was proved to be sufficient to determine incipient cytotoxic
concentrations of H2O2 inducing growth arrest and
cell death (47). Cellular responses elicited by H2O2
depend upon the severity of the damage, which is further influenced by the cell type and the magnitude of the dose of the exposure (48, 49). Besides, the antioxidant defense mechanisms also contributed.
This study showed that H2O2, a categorized non free
radical of ROS, is cytotoxic and decrease the EPCs
viability start at dose μM. The toxicity
mechanisms of H2O2 to EPCs due to intracellular ROS
level, increased the phosphorylation of p38 MAPK, JNK, and NF-B, and decreased the cellular levels of BCl-2 and AP-1 (50).
Compared with HUVECs and CAECs, EPCs
exhibited ≈ - to 4-fold higher expression and activity
of manganese superoxide dismutase (MnSOD) and glutathione peroxidase, but not copper zinc superoxide dismutase (CuZnSOD) or catalase (51, 52). Pretreatment with GTE (25 mg/l) was able
has a potent antioxidant property, and one of the active compounds is catechin. The cathecin, the most abundant component in green tea, has a potent antioxidant property and is shown to be 25 to 100 times more potent than vitamins C and E (23). The GTE (25 mg/l) was able to significantly decrease ROS
levels in H2O2-induced EPCs. The mechanism of ROS
reduction maybe due to scavenging activity or upregulated intracellular antioxidant. This study
confirmed previous studies that H2O2 may impair
EPCs proliferation and induce EPCs apoptosis. Catechin may increase the capacity of EPCs for the
resistance to apoptosis induced by H2O2 (53).
Conclusion
Ministry of Research and Technology, Indonesia (Ristek Insentif Kapasitas Produksi 2011), and Faculty of Medicine, Maranatha Christian University, Bandung, and also supported by Stem Cell and Cancer Institute (SCI), Jakarta, which facilitated the complete culture laboratory.cardiovascular disease, and erectile dysfunction: clinical implications. European Urology Supplements 2009; 8:58-66.
2. Versari D, Daghini E, Virdis A, Ghiadoni L, taddei S. Endothelial dysfunction as a target for prevention of cardiovascular disease. Diabetes Care 2009; 32:S314-S321. 3. Walter DH, Rittig K, Bahlmann FH, Kirchmair R, Silver M,
Murayama T, et al. Statin therapy accelerates
reendothelialization: A novel effect involving mobilization and incorporation of bone marrow-derived endothelial
progenitor cells. Circulation 2002; 105:3017–3024.
4. Sata M. Molecular strategies to treat vascular diseases: Circulating vascular progenitor cell as a potential target for prophylactic treatment of atherosclerosis. Circ J 2003;
67:983–991.
5. Siddique A, Shantsila E, Lip GYH, Varma C. Endothelial progenitor cells: what use for the Cardiologist. J Angiogenesis Res 2010; 2:6.
6. Lenk K, Uhlemann M, Schuler G, Adams V. Role of endothelial progenitor cells in the beneficial effects of physical exercise on atherosclerosis and coronary artery
disease. J Appl Physiol 2011; 111:321–328.
7. Mavromatis K, Aznaouridis K, Mheid IA, Veledar E,
Dhawan S, Murrow JR, et al. Circulating proangiogenic cell
activity is associated with cardiovascular disease risk. J Biomol Screening 2012; 17:1163-1170.
8. Hodgson JM, Croft KD. Tea flavonoids and cardiovascular health. Mol Aspects Med 2010; 31:495-502.
9. Hodgson JM. Tea flavonoids and cardiovascular disease. Asia Pac J Clin Nutr 2008; 17:288-290.
10. Amic D, Davidovic-Amic D, Beslo D, Rastija V, Lucic B, Trinajstic N. SAR and QSAR of the antioxidant activity of flavonoids. Curr Med Chem 2007; 14:827-845.
11. Saeed N, Khan MR, Shabbir M. Antioxidant activity, total phenolic and total flavonoid contents of whole plant
extracts Torilis leptophylla L. BMC Complementary and
Altern Med 2012;12:1-12.
12. Widowati W, Ratnawati H, Mozefis T, Pujimulyani D, Yelliantty Y. Hypolipidemic and antioxidant effects of black tea extract and quercetin in atherosclerotic rats. Int J Med Pharm Sci Eng 2013; 7:373-380.
13. Costa LM, Gouveia ST, Nobrega JA. Comparison of heating extraction procedures for Al, Ca, Mg and Mn in tea
samples. Ann Sci 2002; 18:313–318.
14. Macfarlane A, Macfarlane I. The empire of tea: the japanese population. The Japan Public Health Center-Based Study Cohort. Stroke 2013; 44:1369-1373.
18. McCullough ML, Peterson JJ, Patel R, Jacques PF, Shah R, Dwyer JT. Flavonoid intake and cardiovascular disease
mortality in a prospective cohort of US adults 1,2,3,4. Am J
Clin Nutr 2012; 95:454–464.
19. Stangl V, Lorenz M, Stangl K. The role of tea and tea flavonoids in cardiovascular health. Mol Nutr Food Res 2006; 50:218-228.
20. Heiss C, Keen CL, Kelm M. Flavanols and cardiovascular
disease prevention. European Heart J 2010; 31:2583–2592.
21. Mink PJ, Scrafford CG, Barraj LM, Harnack L, Hong CP,
Nettleton JA, et al. Flavonoid intake and cardiovascular
disease mortality : a prospective study in postmenopausal
women 1,2,3,4. Am J Clin Nutr 2007; 85:895–909.
22. Boyer J, Liu RH. Apple phytochemicals and their health benefits. Nutrition J 2004; 3:5.
23. Terao J, Kawai Y, Murota K. Vegetable flavonoids and cardiovascular disease. Asia Pac J Clin Nutr 2008; 17:291-293.
24. Manning J, Roberts JC. Analysis of catechin content of commercial green tea products. J Herbal Pharmacother 2003; 3:19-32.
25. Doss MX, Potta SP, Hescheler J, Sachinidis A. Trapping of growth factors by catechins: a possible therapeutical target for prevention of proliferative diseases. J Nutr Biochem 2005; 16:259-266.
26. Tiwari P, Kumar B, Kaur M, Kaur G, Kaur H. Phytochemical screening and extraction : A Review. Internationale Pharmaceutica Sciencia 2011; 1:98-106. 27. Widowati W, Wijaya L, Wargasetia TL, Bachtiar I, Yellianty, Laksmitawati DR. Antioxidant, anticancer, and apoptosis-inducing effects of Piper extracts in HeLa cells. J Exp Integr Med 2013; 3:225-230.
of black tea (Camellia sinensis L.) extract and fractions. Med Plants 2011; 3:21-26.
29. Jang A, Liu X-D, Shin M-H, Lee B-D, Lee S-K, Lee J-H, et
al. Antioxidative potential of raw breast meat from broiler
chicks fed a dietary medicinal herb extract mix. Poultry Sci
2008; 87:2382–2389.
30. Thring TSA, Hili P, Naughton DP. Anti-collagenase, anti-elastase and antioxidant activities of extracts from 21 plants. BMC Complement Altern Med 2009; 9:27.
31. Etoundi CB, Kuaté D, Ngondi JL, Oben J. Anti-amylase, anti-lipase and antioxidant effects of aqueous extracts of some Cameroonian spices. J Nat Products 2010; 3:165-171. 32. Mishra A, Bapat MM, Tilak JC, Devasagayam TPA.
Antioxidant activity of Garcinia indica (kokam) and its
syrup. Curr Sci 2006; 91:90-93.
33. Adedapo AA, Jimoh FO, Afolayan AJ, Masika PJ. Antioxidant activities and phenolic contents of the
methanol extracts of the stems of Acokanthera oppositifolia
and Adenia gummifera. BMC Complement and Altern Med
2008; 8:54.
34. Chen J, Wang X, Zhu J, Shang Y, Guo X, Sun J. Effects of
Ginkgo biloba extract on number and activity of endothelial
progenitor cells from peripheral blood. J Cardiovasc
Pharmacol 2004; 43:347–352.
35. Vasa M, Fichtlscherer S, Adler K, Aicher A, Martin H,
Zeiher AM, et al. Increase in circulating endothelial
progenitor cells by statin therapy in patients with stable coronary artery disease. Circulation 2001; 103:2885-2890. 36. Bickford PC, Tan J, Shytle RD, Sanberg CD, Elbadri N,
Sanberg R. Nutraceuticals synergistically promote
proliferation on human stem cells. Stem Cells and Dev 2006; 15:118-123.
37. Gu J, Wang CQ, Fan HH, Ding HY, Xie XL, Xu YM, et al.
Effect of resveratrol on endothelial progenitor cells and their contributions to reendothelialization in intima-injured rats. J Cardiovasc Pharmacol 2006; 47:711-721. 38. Jie G, Lin Z, Zhang L, Lv H, He P, Zhao B. Free radical scavenging effect of Pu-erh tea extracts and their protective effect on oxidative damage in human fibroblast cells. J Agric Food Chem 2006; 54:8058-8064.
39. Stolzing A, Scutt A. Effect of reduced culture temperature on antioxidant defences of mesenchymal stem cells. Free Rad Bio & Med 2006; 41:326-338.
40. Hristov M, Weber C. Endothelial progenitor cells: Characterization, pathophysiology, and possible clinical relevance. J Cell Mol Med 2004; 8:498-508.
41. Hirschi KK, Ingram DA, Yoder MC. Assessing identity,
phenotype, and fate of endothelial progenitor cells. Arterioscler Thromb Vasc Biol 2008; 28:1584-1595. 42. Suzuki K, Sakata N, Kitani A, Hara M, Hirose T, Hirose
W, et al. Characterization of human monocytic cell line,
U937, in taking up acetylated low-density lipoprotein and cholesteryl ester accumulation A flow cytometric and HPLC
study. Biochim Biophys Acta 1990; 1042:210–216.
43. Malich G, Markovic B, Winder C. The sensitivity and
specificity of the MTS tetrazolium assay for detecting the in
vitro cytotoxicity of 20 chemicals using human cell lines.
Toxicology 1997; 124:179-192.
44. Huang WY, Lin YR, Ho RF, Liu HY, Lin YS. Effects of water solutions on extracting green tea leaves. 2013; 2013:368350.
45. Miguel F, Augusto AC, Gurgueira SA. Effect of acute vs
chronic H2O2-induced oxidative stress on antioxidant
enzyme activities. Free Radic Res 2009; 43:340-347. 46. Stone JR, Yang S. Hydrogen peroxide: a signaling messenger. Antioxid Redox Signal 2006; 8:243-270. 47. Gülden M, Jess A, Kammann J, Maser E, Seibert H.
Cytotoxic potency of H2O2 in cell cultures: Impact of cell
concentration and exposure time. Free Rad Biol Med 2010;
49:1298–1305.
48. Temple MD, Perrone GG, Dawes IW. Complex cellular responses to reactive oxygen species. Trends Cell Biol
2005; 15:319–326.
49. Finkel T, Holbrook NJ. Oxidants, oxidative stress and
biology of ageing. Nature 2000; 408:239–247.
50. Lee SH, Kim JY, Yoo SY, Kwon SM. Cytoprotective effect of dieckol on human endothelial progenitor cells (hEPCs) from oxidative stress-induced apoptosis. Free Radic Res 2013; 47:526-534.
51. Dernbach E, Urbich C, Brandes RP, Hofmann WK, Zeiher AM, Dimmeler S. Antioxidative stress-associated genes in circulating progenitor cells: evidence for enhanced
resistance against oxidative stress. Blood 2004; 104:3591–
3597.
52. He T, Peterson TE, Holmuhamedov EL, Terzic A, Caplice NM, Oberley LW, Katusic ZS. Human endothelial progenitor cells tolerate oxidative stress due to intrinsically high expression of manganese superoxide dismutase. Arterioscler
Thromb Vasc Biol 2004; 24:2021–2027.
53. Cao Y, Xu ZC, He XJ, Dang XQ, Yi ZW, Zeng XQ. Protective effects of cathecin on apoptosis of endothelial progenitor
cells induced by H2O2 in rats. Zhongguo Dang Dai Er Ke Za