ELECTRONIC ABSORPTION SPECTRA OF SOME PHOTOSENSITIZERS BEARING CARBOXYLIC ACID
GROUPS: INSIGHTS FROM THEORY
Original Article
ASMIYENTI DJALIASRIN DJALIL
1,2*, ENADE PERDANA ISTYASTONO
3, SLAMET IBRAHIM
1,
DARYONO HADI TJAHJONO
11School of Pharmacy, Bandung Institute of Technology, Jalan Ganesha 10 Bandung 40132, Indonesia, 2The University of Muhammadiyah Purwokerto, Jl. Raya Dukuhwaluh, PO. Box 202 Purwokerto 53182, Indonesia, 3
Received: 08 Nov 2015 Revised and Accepted: 17 May 2016
Laboratorium Teknologi Farmasi, Universitas Sanata Dharma, Yogyakarta, Indonesia
Email: asmiyenti@yahoo.com
ABSTRACT
Objective: The main objective of this research work was to give insight from theory in interpreting electronic absorption spectra of tetrapyrrolic macrocycles bearing carboxylic acid groups: protoporphyrin IX, pheophorbide a and its 1-hydroxyethyl derivatives for application in photodynamic therapy.
Methods: All calculations were carried out by using the Gaussian 03W version 6.0. Electronic excitation energies and oscillator strengths were computed as vertical excitations from the minima of the ground state structures by using ZINDO and TD-DFT approach in vacuo. The simulated spectra were obtained by using the GaussSum 2.2.0 program.
Results:The results showed thatchlorine compounds (pheophorbide a and its 1-hydroxyethyl derivative)display the red-most absorption (Qx
Conclusion: The chlorin compounds bearing carboxylic acid groups were, however, more promising candidates to be utilized in PDT compared to the corresponding porphyrin compounds.
) at longer wavelengths and their absorption were stronger than porphyrin compounds (protoporphyrin IX and its 1-hydroxyethyl derivative). On the other hand, the 1-hydroxyethyl derivatives were not able to red-shift the absorption compared to the parent compounds.
Keywords: Absorption spectra, 1-Hydroxyethyl derivative, Photodynamic therapy, Pheophorbide a, Protoporphyrin IX, TD-DFT, ZINDO
© 2016 The Authors. Published by Innovare Academic Sciences Pvt Ltd. This is an open access article under the CC BY license
INTRODUCTION
PDT is a treatment technique for cancer and for certain benign conditions which utilizes a combination of visible light and a photosensitizer to produce reactive oxygen species in cells [1]. Photosensitizer is activated under irradiation, and the energy is then transferred to nearby molecules via a radiationless transition. In particular, triplet molecular oxygen (3O2
The most widely used photosensitizer, photofrin (porfimer sodium), used mainly in the treatment of esophageal cancer and non-small cell lung cancer, illustrates the main problems of today’s photosensitizers. Its red-most absorption maximum lies at a too short wavelength to achieve optimal tissue penetration, and the extinction coefficient for this absorption is low [3]. Photosensitizers with the red-most absorption at as long wavelength as possible and with enhanced absorption in this region are necessary for successful application of PDT.
) is excited to the singlet state that is cytotoxic and can then destroy nearby cancer cells. In comparison to other currently available cancer therapeutic methods, PDT has the advantage of preferential accumulation of the photosensitizer in the tumor tissue and precise selectivity of the treatment by controlling the light [2].
We present here our work on some tetrapyrrolic macrocycles bearing carboxylic acid groups. In general, the 1-hydroxyethyl substituent increases the hydrophilicity of the compound, an advantage when the drug is administrated systemically. The 1-hydroxyethyl derivative of protoporphyrin IX (PPIX) was synthesized using addition reaction with hydrobromide, followed by nucleophilic substitution with H2
The most widely used method to calculate absorption spectra is a time-dependent density functional theory (TD-DFT) which, despite the fact that it is a single-reference method, has proven sufficiently accurate in many studies [6]. However, the performance of TD-DFT much depends on the actual functional used in the excited state calculations [7-9]. The studies show that the results can deviate significantly from experiments and that the performance of the functionals often is system specific. On the other hand, several prediction of UV-Vis spectra were performed using ZINDO [10-11]. In general, DFT methods (TD-DFT) had an extra calculation time cost compared to semiempirical methods (ZINDO). The theoretical works presented here were focused on the structural, energetic and spectroscopic behavior of protoporphyrin IX (1a), pheophorbide a
(2a) and its 1-hydroxyethyl derivative (1b, 2b) (fig. 1). ZINDO and TD-DFT were used for this purpose. On the other hand, we take
advantage of the λ
O [4]. We have found that the 1-hydroxyethyl derivative of PPIX efficiently generates singlet oxygen than those with parent compound when irradiated with visible light. Furthermore, the 1-hydroxyethyl derivative of PPIX showed lower dark toxicity in a normal cell compared to the parent compound [5]. In the continued effort to design, synthesize and characterize new
photosensitisers that exhibit a high-efficiency base on its absorption spectra, information from modern theoretical methods is very useful. In this paper, we show the absorption spectra prediction to assess the best molecules for PDT applications.
max at Qx
MATERIALS AND METHODS
band predicted by these two methods in order to reach a better agreement between theoretical estimates and experimental measurements.
obtained using the GaussSum 2.2.0 program [15]. In comparing the theoretical and experimental data, we adjusted a fixed constant value (k) of a parent compound (1a, 2a) to its 1-hydroxyethyl derivative.
Fig.1: Molecular structures of protoporphyrin IX (1a), pheophorbide a (2a) and its 1-hydroxyethyl derivatives
RESULTS AND DISCUSSION
Geometry optimization
The optimized configurations of all molecules are depicted in fig. 2. The optimized structure showed a planar geometry, which is comparable to those reported earlier [8, 16]. Total energy of 1a, 1b, 2a, and 2b were-1152102,-1248032,-1223981, and-1271943 kcal/ mol, respectively. The 1-hydroxyethyl derivative of compounds studied has smaller total energy than the parent compounds.
Electronic absorption calculations in vacuo and comparison with experimental spectra
The experimental electronic spectra of porphyrins are very specific. Because of their highly conjugated ring, porphyrin-like systems show an intense band (ε ~ 200000) at about 400 nm called the Soret or B band while in the region of 500-600 nm there are usually four weaker distinct of Q bands. Q bands have the low energy S0→ S1
transitions (Q-bands) that are nearly forbidden by parity rules as a result of the high D2hsymmetry while B band has the most intense
appears at higher energy allowed S0→ S2
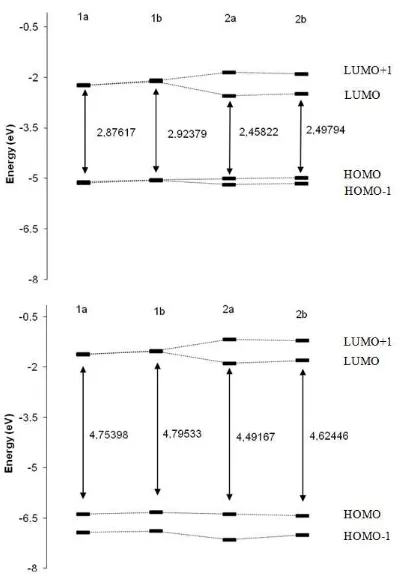
The spectroscopic behavior of tetra pyrrolic macrocycles can be rationalized in terms of the Gouterman four-orbital model, where the principal excitations involve the two highest occupied molecular orbitals (HOMO and next-HOMO) and the two lowest unoccupied orbitals (LUMO and next-LUMO) [17]. These energies are shown in fig. 3. The Gouterman’s four level model of the compounds predicts that these four frontier orbitals are separated by a gap of 2.5 to 2.9 eV by ZINDO methods and 4.5 to 4.8 eV by TD-DFT (table 1). An HOMO-LUMO gap of chlorine (2a, 2b) is lower than porphyrins (1a, 1b). Furthermore, it can be seen that the ∆
transition [17].
H-L of 1a
and 1b have nearly the same energy, as well as for 2a and 2b. The energy difference between HOMO and HOMO-1 orbitals as well as the LUMO and LUMO+1 orbitals for the porphyrin compounds (1a, 1b) are small, in particular when the energies are calculated with ZINDO method.
Fig.2: Optimized geometry of 1a, 1b, 2a, and 2b
Fig.3: Orbital energy levels for the four gouterman orbitals of 1a, 1b, 2a, and 2b by ZINDO (top) and TD-DFT methods
(bottom)
Table 1: Negative of the HOMO (-εHOMO) and LUMO energies (-εLUMO), and HOMO-LUMO gaps (∆H-L) calculated by ZINDO and TD-DFT in eV
TD-DFT ZINDO
1a 1b 2a 2b 1a 1b 2a 2b
-εHOMO 6.38145 6.32784 6.38472 6.42662 5.11207 5.04922 5.00459 4.98309
-εLUMO 1.62747 1.53251 1.89303 1.80216 2.23590 2.12543 2.54637 2.48515
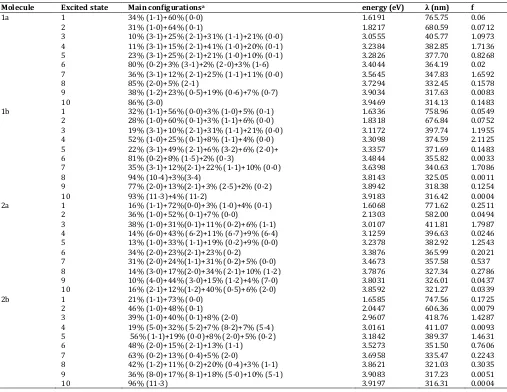
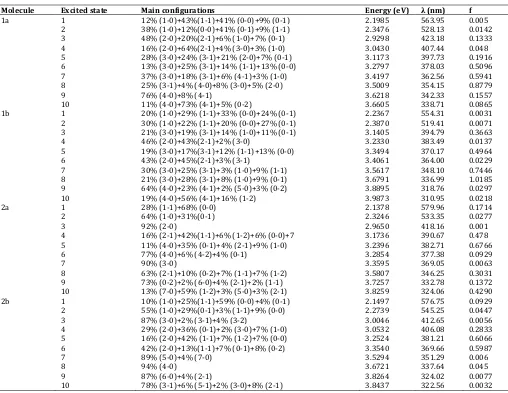
Electronic spectra of the compounds in the gas phase calculated by ZINDO and TD-DFT are shown in table 2 and table 3, respectively. The results show the main excitation energies, along with their relative oscillator strengths and the transition character. The optical band gap obtained from spectra is the lowest transition (or excitation) energy from the ground state to the first dipole-allowed excited state, which is an assumption that the lowest singlet excited state can be explained by only one single excited configuration, in which an electron is promoted from the HOMO to the LUMO. In fact, the optical band gap is not the orbital energy difference between the HOMO and LUMO, but the energy difference between the S0 state
and S1 state. Only when the excitation to the S1
On the basis of the Gouterman four-orbital theoretical model, the Q-band is mainly due to two electronic transitions, named Q
state corresponds almost exclusively to the promotion of an electron from the HOMO to the LUMO, can the optical band gap be approximately equal to the HOMO-LUMO gap in quantity [18].
x and Qy.
The Qx transition arises from the HOMO → LUMO (in brief notation
0-0) electronic excitation with a contribution from the HOMO-1 → LUMO+1 (1-1), whereas the Qy transition is composed of the
HOMO-1 → LUMO (1-0) and HOMO → LUMO+1 (0-1) electronic excitations [18,19]. Summarized in table 2 and table 3, the Qx band (first excited
state) is mainly composed of the HOMO → LUMO transition (33 -73%) with a smaller amount of the next-HOMO → next-LUMO
(16-43%). The next-HOMO → next LUMO electronic excitation
contributes in a higher amount by TD-DFT compared to ZINDO method. The Qx
This can be assigned to a π → π* transition. The Q
transition corresponds to the strong experimental band that plays the basic role in PDT applications.
y
band counterpart equally corresponds to next-HOMO → LUMO and HOMO → next -LUMO excitations. This second excitation energy falls between 1.82-2.04 eV with a weak intensity (0.01<f<0.07) by employing the ZINDO. Moreover TD-DFT calculated the energy falls between 2.27– 2.39 eV with intensity (0.01<f<0.04).
Table 2: Excitation energies (eV and nm), oscillator strengths (f) and main configurations obtained by ZINDO. All electronic states belong to 1
Molecule
A
Excited state Main configurationsa energy (eV) λ (nm) f
1a 1 34% (1-1)+60% (0-0) 1.6191 765.75 0.06
aBy convention, in parentheses, the first number, n, is referred to as the occupied orbital contribution from HOMO-n, and the second, m, to the
virtual one LUMO+m.
The absorption spectra of the chlorins (2a, 2b) show striking differences from those of the porphyrins (1a, 1b). The Qx band much
more intense in the chlorins, and the lowest energy transition undergoes a bathochromic (red) shift. For example, TD-DFT calculated shows Qxband (λ= 579.96 nm, f=0.1714) for 2a compared with 1a (λ=563.95 nm, f=0.005). Chlorin compounds, in which one of the pyrrole double bonds has been saturated, are however more
promising candidates to be utilized in PDT as they display the red-most absorption (Qx
Fig. 4 and 5 indeed shows that Q
) at longer wavelengths and the absorption is stronger compared to the corresponding porphyrin compounds.
x band of chlorin compound (2b) at
become well separated (fig. 3). Although the energy of the lowest eg (π*) orbital does not increase much, that of the HOMO (a1u) is
successively raised. The overall result is that the energy of the
lowest transition (Qx band) decrease along the sequence
porphyrin-chlorin. At the same time, symmetry restrictions are removed or modified, and Qx band becomes more intense.
Table 3: Excitation energies (eV and nm), oscillator strengths (f) and main configurations obtained by TD-DFT. All electronic states belong to 1
Molecule
A
Excited state Main configurations Energy (eV) λ (nm) f
1a 1 12% (1-0)+43%(1-1)+41% (0-0)+9% (0-1) 2.1985 563.95 0.005
aBy convention, in parentheses, the first number, n, is referred to as the occupied orbital contribution from HOMO-n, and the second, m, to the
virtual one LUMO+m.
Gaussian 03 software was used to predict the electronic absorption spectra of compounds. One of the advantages of this software is that it includes a module to represent the curve of the spectrum (sum of Gaussian curves) calculated from the oscillator strengths and the wavelengths making easier to visualize the results. The simulated absorption spectrum was constructed using the oscillator strengths calculated at the ZINDO (fig. 4) and TD-DFT level of theory (fig. 5), fitted to a Gaussian distribution with a full-width at half-maximum (fwhm) of 3000 cm-1
Three or four intense transitions were observed in the B-band region. Two weak transitions are observed in the low-energy Q-band region of the calculated absorption spectrum (Q
.
x and Qy
The substitution of vinyl groups with 1-hydroxyethyl has little influence on the gap and thus on Q
band). A visual comparison between the Gaussian fits and the experimental spectra (fig. 6) indicates that the computed spectra pattern look remarkably similar to the experimental spectra without the vibronic overtones in the Q-band region.
x bands. ZINDO method shows
that Qx
These patterns are in good agreement with experimental data (table 4). In this work, although the absorption bands did not match exactly with experiment, the relative shifts in absorption as a function of 1-hydroxyethyl substitution were shown to correlate very well. These data are important and indicate that the computed values of all compounds studied should by analogy correlate with one another, and will be useful in predicting the absorption spectrum of the yet-to-be prepared other compounds.
bands are slightly blue-shifted as one goes from 1a (765.75 nm) to 1b (758.96 nm), as well as from 2a (771.62 nm) to 2b
(747.56 nm). The same trend is observed by a TD-DFT method. They are slightly blue-shifted as one goes from 1a (563.95) to 1b (554.31 nm), as well as from 2a (579.96 nm) to 2b (576.75 nm).
A comparison of the ratios of the Soret band and Q-band extinction coefficients in the experimental spectra with the relative extinction coefficients in the computed spectra indicate that they are quite similar (table 4). The experimental spectra show a relative ratio of 100:4.5:3.4 for the Soret: Qx:Qy-band extinction coefficients in 1a.
Based on the ZINDO method, the Soret: Qx:Qy-band relative ratio of
2b is 100:5.4:11.8. Whereas, using TD-DFT method the Soret: Qx:
Qy-band relative ratio of 2b is 100:6.4:13.3.
Fig.4: Simulated electronic spectra for 1b (top) and 2b (bottom) by ZINDO fitted to a Gaussian distribution with fwhm
of 3000 cm-1. The inset in the upper right shows an expanded view of the Q-band region with fwhm 600 cm-1
Fig.5: Simulated electronic spectra for 1b (top) and 2b (bottom) by TD-DFT fitted to a Gaussian distribution with fwhm
of 3000 cm-1. The inset in the upper right shows an expanded view of the Q-band region with fwhm 600 cm-1
Fig.6: Calculated (top) and experimental (bottom) spectra of pheophorbide a (2a)
Table 4: Relative ratio of observed extinction coefficient (ε) Qx,Qy
Compounds
, Soret band, and comparison with calculated results
λcal B, Qy, Qx ε soret: Q
(nm); y:Qx
λ a
cal B, Qy, Qx ε soret: Q
(nm); y:Qx
λ b
obs B, Qy,Qx ε soret: Q
(nm); y:Qxc
1a 383, 681, 766;
100:4.1:3.5
361, 528, 563; 100:1.6:0.6
405, 576, 630 (in DMF); 100:4.5:3.4
1b 378, 677, 759;
100:3.4:2.5
344, 519, 554; 100:0.6:0.3
402, 572, 625 (in methanol); 100:4.8:2.7
2a 399, 582, 772;
100:3.0:15.5
385, 533, 579; 100:4.4:27.1
408, 609, 665 (in diethylether); 100:7.2:46.0
2b 402, 606, 747;
100:5.4:11.8
378, 545, 577; 100:6.4:13.3
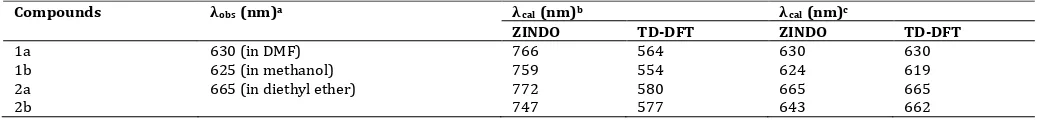
Table 5: Observed Qx
Compounds
band and corresponding Qx band calculated results
λobs (nm)a λcal (nm)b λcal (nm)c
One can also note that the Q band excitation energy by ZINDO method tend to overestimate. The different trend was observed for B bands: we calculated them to be at 383 nm and 378 nm for 1a and 1b, respectively, whereas experiments report respective values of 405 and 402 nm. These bands are nonetheless not implied in phototherapy processes, so we do not analyze here in this part of the spectrum. The Q band excitation energy estimation by TD-DFT tend to be low compared with the experimental data. These results differ from those reported by Palma et al. [8]. The differences of estimation and experiment data for TD-DFT and ZINDO method were 87-90% dan 78-84%, respectively. Considering the differences values reveal the TD-DFT more accurately than ZINDO method.
Liu et al. [21] and Yuan et al. [22] reported that the visible absorption maxima can be precisely calculated by ZINDO/S method
by adjusting OWFπ-πvalue (the relationship between π-π overlap
weighting factor) OWFπ-π. In this work, although the absorption bands did not match exactly with experiment, we tried to correlate with the experimental results. After conversion with adjusted k
value, the predicted absorption maxima of 2b are 643 nm by ZINDO method and 662 nm by the TD-DFT method (table 5).
CONCLUSION
Electronic absorption spectra of PPIX, pheophorbide a and its 1-hydroxyethyl derivatives were predicted within ZINDO and TD-DFT methods. The spectra were analyzed and compared with available experimental data. The chlorin compounds bearing carboxylic acid groups were, however, more promising candidates to be utilized in PDT compared to the corresponding porphyrin compounds. Although the absorption bands did not match exactly with experiment, the relative shifts and intensity as a function of a 1-hydoxyethyl substitution and reduction of pyrrole ring were shown to correlate very well. Overall, the prediction by using TD-DFT reveal more accurately than ZINDO approach.
CONFLICT OF INTERESTS
Declared none
REFERENCES
Calculated Q band based on ZINDO and TD-DFT with adjusted k value: ZINDO results multiply by 0.822 (for porphyrin), 0.861 (for chlorin); TD-DFT results multiply by 1.117 (for porphyrin), 1.147 (for chlorin).
1. Castano AP, Demidova TN, Hamblin MR. The mechanism in
photodynamic therapy: part one-photosensitizers,
photochemistry and cellular localization. Photodiagn Photodyn Ther 2004;1:279-93.
2. Maiya BG. Photodynamic therapy: 2. Old and new
photosensitizers.Resonance 2000;15-29.
3. Ormond AB, Freeman HS. Dye sensitizers for photodynamic
therapy. Materials 2013;6:817-40.
4. Mwakwari SC. Syntheses and properties of iso porphyrins and related derivatives for application in photodynamic therapy [dissertation]. Lousiana (United States): Louisiana State University and Agricultural and Mechanical College; 2007. 5. Djalil AD, Nurulita NA, Limantara L, Ibrahim S, Tjahjono DH.
Biological evaluations of protoporphyrin IX, pheophorbide a, and its 1-hydroxyethyl derivatives for application in photodynamic therapy. Int J Pharm Pharm Sci 2012;4:741-6.
6. Eriksson ESE, Eriksson LA. Computational design of chlorin-based photosensitizers with enhanced absorption properties. Phys Chem Chem Phys2011;13:11590-6.
7. Perpete EA, Wathelet V, Preat J, Lambert C, Jacquemin D. Toward a theoretical quantitative estimation of the λmax
8. Palma M, Cardenas-Jiron GI, Rodriguez MIM.Effect of chlorin structure on theoretical electronic absorption spectra and on the energy released by porphyrin-based photosensitizers. J Phys Chem A 2008;112:13574-83.
of
anthraquinones-based dyes. J Chem Theory Comput
2006;2:434-40.
9. Tian BX, Eriksson ESE, Eriksson LA. Can range-separated and hybrid DFT functionals predict low-lying excitations? A tookad case study.J Chem Theory2010;6:2086-94.
10.
structure and electronic spectra of a hydroxyl substituted naphthoquinones. Spectrochim Acta Part A 2005;61:777-90.
11.
AM1/CI, CNDO/S and ZINDO/S
computations of absorption bands and their intensities in the UV spectra of some 4(3H)-quinazolinones. Spectrochim Acta Part A 2006;65:299-307.
12. Frisch MJ, Trucks GW, Schlegel HB, Scuseria GE, Robb MA, Cheeseman JR, et al. Gaussian 03 revision B.04. Wallingford CT: Gaussian, Inc; 2004.
13. Francl MM, PetroWJ, Hehre WJ, Binkley JS, Gordon MS, DeFrees DJ, et al. Self-consistent molecular orbital methods. XXIII. A polarization type basis set for second-row elements. JChem Phys 1982;77:3654-65.
14. Liu YL, Feng JK, Ren AM. Structural, electronic, and optical properties of phosphole-containing p-conjugated oligomers for light-emitting diodes.J Comput Chem 2007;28:2500-9. 15. O’Boyle NM, Vos JG. GaussSum 1.0. Dublin, Ireland: Dublin City
University; 2005. Available from: http://gausssum.
sourceforge.net. [Last accessed on 10 Oct 2015].
16. Ghosh A. A comparative theoretical study of free-base
porphyrin, chlorin, bacteriochlorin, and isobacteriochlorin: evaluation of the potential roles of ab initio hartree-fock and density functional theories in hydroporphyrin chemistry. J Phys Chem B 1997;101:3290-7.
17. Gouterman M, Wagniere GH, Snyder LC. Spectra of porphyrins: Part II. Four orbital model. J Mol Spectrosc1963;11:108-27. 18. Quartarolo AD, Russo N, Sicilia E, Lelj F. Absorption spectra of
the potential photodynamic therapy photosensitizers texaphyrins complexes: a theoretical analysis. J Chem Theory Comput 2007;3:860-9.
19. Petit L, Quartarolo A, Adamo C, Russo N. Spectroscopic
properties of porphyrin-like photosensitizers: insights from theory. J Phys Chem B2006;110:2398-404.
20. Liu JN, Chen ZR, Yuan SF. Study on the prediction of visible absorption maxima of azobenzene compounds. J Zhejiang Univ Sci B 2005;6:584-9.
21. Yuan SF, Chen ZR, Cai HX. Calculation of visible absorption
maxima of phthalocyanine compounds by quantum theory.