Katalog BPS : 9302001.8172
PRODUK DOMESTIK REGIONAL BRUTO
K O T A T U A L
GROSS REGIONAL DOMESTIC PRODUCT
MUNICIPALITY OF TUAL
BY BUSSINES FIELD
2 0 1 2
BADAN PUSAT STATISTIK
PRODUK DOMESTIK REGIONAL BRUTO
KOTA TUAL
MENURUT LAPANGAN USAHA
GROSS REGIONAL DOMESTIC PRODUCT
MUNICIPALITY OF TUAL
BY BUSSINES FIELD
2 0 1 2
ISSN : 0216.4769
Katalog BPS/BPS Catalogue : 9302001.8172 Nomor Publikasi/Publication Number : 81025.1304 Ukuran Buku/Book Size : 20 x 16 Cm Jumlah Halaman/Total Pages : x + 66 Naskah / Manuscript :
Seksi Neraca Wilayah Dan Analisis Statistik
Section of Regional Accounts and Statistical Analysis
Kulit Buku / Cover Design :
Seksi Neraca Wilayah Dan Analisis Statistik
Section of Regional Accounts and Statistical Analysis
Diterbitkan oleh / Published by :
Badan Pusat Statistik Kabupaten Maluku Tenggara
BPS – Statistics, Regency of Maluku Tenggara
Dicetak oleh / Printed by :
Badan Pusat Statistik Kabupaten Maluku Tenggara
BPS – Statistics, Regency of Maluku Tenggara
Boleh dikutip dengan menyebutkan sumbernya/
WALIKOTA TUAL
S A M B U T A N
Dengan pujian, hormat dan kemuliaan kepada Tuhan yang Maha Kuasa, saya menyambut dengan gembira penerbitan Buku Produk Domestik Regional Bruto Kota Tual Menurut Lapangan Usaha Tahun 2012 ini. Dimana data dan analisa statistik yang akurat dan tepat waktu sangat diperlukan dalam merencanakan pembangunan di segala bidang, baik oleh pemerintah maupun swasta, demi membangun Kota Tual yang lebih baik.
Untuk itu kami ucapkan terima kasih dan penghargaan kepada Badan Pusat Statistik yang telah bekerja keras dalam menyajikan publikasi Produk Domestik Regional Bruto Menurut Lapangan Usaha tahun 2012, dan kepada semua Dinas/Instansi pemerintah maupun swasta di daerah ini yang ada kaitannya dengan penerbitan buku ini. Saya harapkan lebih meningkatkan kerjasama, terutama dalam memberikan data yang dibutuhkan demi kelancaran penghitungan dan publikasi di tahun mendatang.
Semoga publikasi ini dapat bermanfaat bagi semua pihak.
Tual, Agustus 2013
WALIKOTA TUAL,
MUNICIPALITY OF TUAL
P R E F A C E
With praise, honor and glory to God Almighty, e’am delighted to
welcome the publication of book of Regional Gross Domestic Product of Municipality of Tual by Industrial Origin year 2012. Where data and statistical analysis of accurate and timely is needed in the planning all sectors of development, well government and private, favor of building a Municipality of Tual.
Regardly, we are thankful and appreciate for the hard work of Central Board of Statistics Regency of Maluku Tenggara to publish Gross Regional Domestic Product of Municipality of Tual by Industrial Origin 2012, and to all departemnt/government institution as well as private in this area that are related with the publication on this book. I would expexct further improve the cooperation, especially the in giving data needed for the smooth counting and publication in the coming year.
Hopefully this publication can be beneficial for all sides.
Tual, August 2013
MAJOR OF MUNICIPALITY OF TUAL,
PDRB Menurut Lapangan Usaha 2012 iii
K A T A P E N G A N T A R
Produk Domestik Regional Bruto Kota Tual Menurut Lapangan Usaha
Tahun 2012 merupakan publikasi tahunan yang disusun oleh BPS Kabupaten
Maluku Tenggara.
Penghitungan PDRB pada Publikasi ini untuk keenam kalinya
menggunakan tahun 2000 sebagai tahun dasar menggantikan tahun dasar
1993. Tabel-tabel yang disajikan mencakup series data tahun 2009 – 2012 atas dasar harga Berlaku dan Konstan 2000. Selain itu disajikan pula ulasan
tentang keadaan perekonomian Kota Tual Tahun 2012.
Disadari bahwa publikasi ini bukan merupakan satu-satunya referensi
dalam perencanaan pembangunan ekonomi, namun dapat memberikan
gambaran keadaan perekonomian daerah ini.
Penghargaan dan terima kasih kami sampaikan kepada Bapak
Walikota Tual dan jajarannya serta semua pihak atas bantuan dan
kerjasamanya sehingga publikasi ini dapat dirampungkan, kiranya kerjasama
yang telah terjalin dapat lebih ditingkatkan.
Semoga publikasi ini bermanfaat bagi kita semua.
Langgur, Agustus 2013
Kepala BPS Kabupaten Maluku Tenggara,
Johnny Tuhumury, SE
iv PDRB Menurut Lapangan Usaha 2012
P R E F A C E
Gross Regional Domestic Product of Municipality of Tual by Business Field 2012 is an annual publication which is compiled by BPS Regency of Maluku Tenggara.
The calculation of GRDP on this publication is the fifth times using year 2000 as a base year replacing base year 1993. Tables presented inside consist of series of data from 2009 – 2012 at current market prices and 2000 constant market prices. Beside that, there is also brief review of Municipality of Tual economics condition on 2012.
We are aware that this publicatioon is not the only reference for economics development planning, but it can provide description of the economics condition of the region.
Appreciation and gratitude are dedicated to the Major of Municipality of Tual and Staff and also everyone for the help and cooperation so that this publication can be finished. Hopefully, such cooperation can be improved.
Hopefully, may this publication be useful for all of us.
Langgur, August 2013
Executy the Task of the Head of BPS Regency of Maluku Tenggara,
Johnny Tuhumury, SE
PDRB Menurut Lapangan Usaha 2012 v
DAFTAR ISI CONTENTS
Halaman P a g e
Kata Pengantar iii
Preface
Daftar Isi v
Contents
Daftar Gambar vi
List of Figures
Daftar Tabel vii
List of Tables
I. PENDAHULUAN
INTRODUCTION
1. Pengertian Pendapatan Regional……… 1
Definition of Regional Income
2. Alasan Pemilihan Tahun 2000 sebagai Tahun Dasar….. 8
Reason to Assign Year 2000 as Base Year
3. Kegunaan Pendapatan Regional………... 10
Advantages of Regional Income
4. Penyajian Angka Indeks………... 13
Presentation of Indexes
II. TINJAUAN EKONOMI
ECONOMICS REVIEW
1. Kondisi Umum Ekonomi...………. 16
Condition of Economic Public
2. Pertumbuhan Ekonomi Daerah……….... 21
Regional Economics Growth
3. Pertumbuhan Ekonomi Sektoral……….. 22
Sectoral Economics Growth
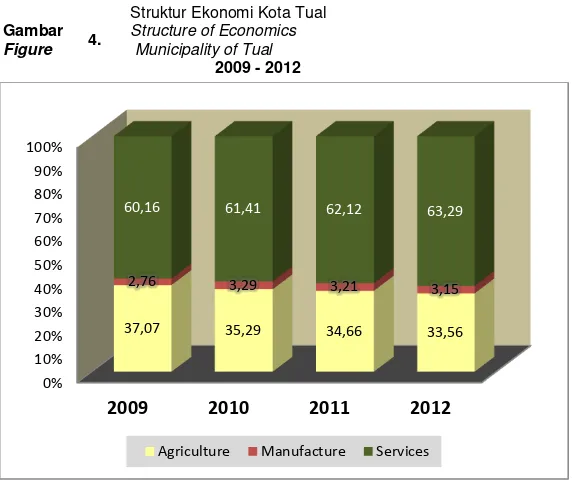
4. Struktur Ekonomi……… 24
Economics Structure
5. Pendapatan Regional Perkapita……….. 30
Regional Percapita Income
6. Indeks Harga Implisit... 32
Implicit Prices Index
III. TABEL-TABEL
vi PDRB Menurut Lapangan Usaha 2012
DAFTAR GAMBAR LIST OF FIGURES
Gambar Halaman
Figures P a g e
1. Produk Domestik Regionanl Bruto
Kota Tual 2009-2012 ……….. 20
Gross Regional Domestic Product of Municipality of Tual 2009-2012
2. Laju Pertumbuhan Ekonomi Kota Tual 2009-2012... 22
Economics Growth Rate of Municipality of Tual 2009-2012
3. Distribusi PDRB Kota Tual
menurut Sektor Atas Dasar Berlaku 2012... 26
Distribution of GRDP of Municipality of Tual by Sector at Current Market Prices 2012
4. Struktur Ekonomi Kota Tual 28
Structure of Economics Municipality of Tual
5. Tingkat Pendapatan Perkapita Kota Tual
2009-2012... 31
Percapita Income Levels of Municipality of Tual 2009-2012
6. Laju Inflasi Harga Produsen Barang dan Jasa
Kota Tual 2009-2012... 33
PDRB Menurut Lapangan Usaha 2012 vii
DAFTAR TABEL LIST OF TABLES
Tabel Halaman
Table P a g e
A. Laju Pertumbuhan Ekonomi Sektoral
Kota Tual 2009-2012... 25
Growth Rate of Economy by Sector of Municipality of Tual 2009-2012
B. Struktur Ekonomi Sektoral Kota Tual 2009-2012 30
Structure of Economy by Sector of Municipality of Tual 2009-2012
1. Produk Domestik Regional Bruto Kota Tual
menurut Lapangan Usaha Atas Dasar Harga Berlaku
2010-2012... 34
Gross Domestic Regional Products of Municipality of Tual by Business Field at Current Market Prices 2010-2012
2. Produk Domestik Regional Bruto Kota Tual
menurut Lapangan Usaha Atas Dasar Harga Konstan 2000,
2010-2012... 37
Gross Domestic Regional Products of Municipilaty of Tual by Business Field at 2000 Constant Market Prices 2010-2012
3. Distribusi Persentase Produk Domestik Regional Bruto Kota Tual menurut Lapangan Usaha Atas
Dasar Harga Berlaku 2010-2012... 40
Percentage Distribution Gross Domestic Regional Products of Municipality of Tual by Business Field at Current
Market Prices 2010-2012
4. Distribusi Persentase Produk Domestik Regional Bruto Kota Tual Menurut Lapangan Usaha Atas
Dasar Harga Konstan 2000, 2010-2012... 43
Percentage Distribution Gross Domestic Regional Products of Municipality of Tual by Business Field at 2000
viii PDRB Menurut Lapangan Usaha 2012
Tabel Halaman
Table P a g e
5. Indeks Perkembangan Produk Domestik Regional Bruto Kota Tual menurut Lapangan Usaha Atas
Dasar Harga Berlaku 2010-2012... 46
Growth Index of Gross Domestic Regional Products of Municipality of Tual by Business at Current Market Prices 2010-2012
6. Indeks Perkembangan Produk Domestik Regional Bruto Kota Tual menurut Lapangan Usaha Atas
Dasar Harga Konstan 2000, 2010-2012... 49
Growth Index of Gross Domestic Regional Products of Municipality of Tual by Business Field at 2000 Constant Market Prices 2010-2012
7. Indeks Berantai Produk Domestik Regional Bruto Kota Tual menurut Lapangan Usaha Atas Dasar
Harga Berlaku 2010-2012... 52
Chained Index of Gross Domestic Regional Products of Municipality of Tual by Business Field at Current Market Prices 2010-2012
8. Indeks Berantai Produk Domestik Regional Bruto Kota Tual menurut Lapangan Usaha Atas Dasar
Harga Konstan 2000, 2010-2012... 55
Chained Index of Gross Domestic Regional Products of Municipality of Tual by Business Field Tual at 2000 Constant Market Prices 2010-2012
9 Indeks Implisit Produk Domestik Regional Bruto
Kota Tual menurut Lapangan Usaha 2010-2012... 58
PDRB Menurut Lapangan Usaha 2012 ix
Tabel Halaman
Table P a g e
10. Pendapatan Regional dan Angka-angka Regional Perkapita Kota Tual Atas Dasar Harga Berlaku
2010-2012... 61
Regional Income and Regional Percapita Income of the Municipality of Tual at Current Market Prices 2010-2012
11. Pendapatan Regional dan Angka-angka Regional Perkapita Kota Tual Atas Dasar Harga Konstan 2000
2010-2012... 62
Regional Income and Regional Percapita Income of the Municipality of Tual at 2000 Constant Market Prices 2010-2012
12. Indeks Perkembangan Pendapatan Regional dan Angka- angka Regional Perkapita Kota Tual Atas Dasar
Harga Berlaku 2010-2012... 63
Growth Index of Regional Income and Regional Percapita Income of the Municipality of Tual at Current Market Prices 2010-2012
13. Indeks Perkembangan Pendapatan Regional dan Angka-angka Regional Perkapita Kota Tual Atas
Dasar Harga Konstan 2000, 2010-2012... 64
Growth Index of Regional Income and Regional Percapita Income of the Municipality of Tual at 2000 Constant Market Prices 2010-2012
14. Indeks Berantai Pendapatan Regional dan Angka-angka Regional Perkapita Kota Tual Atas Dasar
Harga Berlaku 2010-2012... 65
x PDRB Menurut Lapangan Usaha 2012
Tabel Halaman
Table P a g e
15. Indeks Berantai Pendapatan Regional dan Angka-angka Regional Perkapita Kabupaten Maluku Tenggara Atas Dasar
Harga Konstan 2000, 2010-2012... 66
PDRB Menurut Lapangan Usaha 2012 1
P E N D A H U L U A N
I N T R O D U C T I O N
1. Pengertian Pendapatan Regional
Pendapatan Regional
merupakan salah satu indikator
makro ekonomi yang diturunkan
dari hasil penghitungan Produk
Domestik Regional Bruto (PDRB).
PDRB ini sendiri dapat dihitung
dengan 3 pendekatan yaitu :
a. Pendekatan Produksi
Produk Domestik Regional
Bruto (PDRB) merupakan jumlah
nilai tambah bruto yang dihasilkan
oleh setiap unit produksi di dalam
suatu daerah dalam jangka waktu
tertentu (biasanya 1 tahun).
Unit produksi atau yang lebih
dikenal dengan Lapangan Usaha /
Sektor Ekonomi dalam
penyajian-nya dikelompokkan menjadi 9
(sembilan) Lapangan Usaha or
Sektor Ekonomi yaitu :
1. Definition of Regional Income
Regional Income is one of macro-economics indicator which is derived from the results of calculation of Gross Regional Domestic Product (GRDP). GRDP it self can be calculated from 3 approches, which are:
a. Production Approaches
Gross Regional Domestic Product (GRDP) is the sum of all the value added from every production units in a certain region during a certain length of time (usually a year).
2
PDRB Menurut Lapangan Usaha 2012
1. Sektor Pertanian ;
2. Sektor Pertambangan &
Penggalian ;
3. Sektor Industri Pengolahan ;
4. Sektor Listrik, Gas & Air
Bersih ;
5. Sektor Bangunan ;
6. Sektor Perdagangan, Hotel
& Restoran ;
7. Sektor Pengangkutan & Komunikasi ;
8. Sektor Keuangan,
Persewa-an dPersewa-an Jasa PerusahaPersewa-an ;
9. Sektor Jasa – Jasa.
b. Pendekatan Pendapatan.
Produk Domestik Regional
Bruto (PDRB) merupakan jumlah
balas jasa yang diterima oleh
faktor-faktor produksi yang ikut
serta dalam proses produksi di
suatu daerah/region dalam jangka
waktu tertentu (biasanya 1 tahun).
Balas jasa faktor produksi yang
dimaksud adalah upah & gaji,
sewa tanah, bunga modal dan
Keuntungan.
1. Sector of Agriculture;
2. Sector of Mining and
Quarrying;
3. Sector of Manufacturing
Industries;
4. Sector of Electricity, Gas and
Water Supply;
5. Sector of Construction;
6. Sector of Trade, Hotel and
Restaurant;
7. Sector of Transportation and Communication;
8. Sector of Finance, Ownership
and Business Services;
9. Sector of Services.
b. Income Approaches
PDRB Menurut Lapangan Usaha 2012 3 Semua balas jasa faktor
produksi ini sebelum dipotong
pajak penghasilan dan pajak
langsung lainnya. Jika semua
balas jasa faktor produksi tadi
ditambah dengan penyusutan dan
pajak tidak langsung neto pada
salah satu sektor ekonomi /
lapangan usaha maka akan
disebut Nilai Tambah Bruto.
Sehingga jumlah nilai Tambah
Bruto dari seluruh sektor ekonomi
akan diperoleh Produk Domestik
Regional Bruto.
c. Pendekatan Pengeluaran
Produk Domestik Regional
Bruto (PDRB) merupakan jumlah
pengeluaran / penggunaan yang
mencakup Konsumsi Rumah
Tangga, Konsumsi Lembaga
Swasta Nirlaba, Konsumsi
Pemerintah, Pembentukan Modal
Tetap Domestik Regional Bruto,
Ekspor Neto (Ekspor dikurangi
Impor) dan perubahan stok di
dalam suatu daerah dalam jangka
waktu tertentu (biasanya 1 tahun).
All the recompense of production factors here is included with all income and other direct taxes. If all the recompense of production factors income is added with the value of depreciation and indirect taxes for one of industrial origin or
economics sector then it „s called
Value Added. The sums of value added from all industrial origins will result the value of Gross Regional Domestic Product.
c. Expenditure Approach
4
PDRB Menurut Lapangan Usaha 2012
Dari ketiga pendekatan
sebelumnya secara konsep
jumlah pengeluaran tadi harus
sama dengan jumlah barang dan
jasa akhir yang dihasilkan dan
harus sama pula dengan jumlah
pendapatan yang diterima oleh
faktor-faktor produksinya.
Selanjutnya Produk Domestik
Regional Bruto seperti yang
diuraikan diatas disebut sebagai
PDRB atas dasar harga pasar
karena masih mencakup
komponen pajak tidak langsung
neto. Ada beberapa ukuran
penting lain yang diturunkan dari
hasil penghitungan PDRB yaitu :
1.1. Produk Regional Bruto
adalah Produk Domestik Regional
Bruto ditambah dengan
Pendapatan Neto dari luar
daerah.
Yang dimaksudkan dengan
Pendapatan Neto dari luar daerah
adalah pendapatan atas faktor
produksi milik penduduk Tual
yang ikut serta berproduksi diluar
From those three approaches above, the concept oh the amount of expenditure had to be equal to the amount of final goods and services produced and be the same as the amount of income received by factors of production.
The Gross Regional Domestic Product as described as above then called as GRDP at market prices because it still contains Net Indirect Taxes Component. There are several indicators which are derived from the result of calculation of GRDP, which are:
1.1. Gross Regional Product is Gross Regional Domestic Product added with Net Income from outside the region.
PDRB Menurut Lapangan Usaha 2012 5 wilayah Tual dikurangi dengan
pendapatan yang sama dari faktor
produksi yang bukan milik
Penduduk Tual yang ikut
berproduksi di dalam Wilayah
Tual.
1.2. Produk Regional Neto
adalah Produk Regional Bruto
dikurangi dengan seluruh
penyusutan barang-barang modal
tetap yang digunakan di dalam
proses produksi dalam jangka
waktu tertentu (biasanya 1 tahun).
1.3. Produk Regional Neto Atas
Dasar Biaya Faktor Produksi
adalah Produk Regional Neto atas
dasar harga pasar dikurangi pajak
tak langsung neto. Pajak tidak
langsung neto adalah pajak tidak
langsung yang dipungut
Pemerintah dikurangi dengan
subsidi yang diberikan Pemerintah
kepada produsen. Baik pajak tidak
langsung maupun subsidi,
kedua-duanya dikenakan terhadap
factor income owned by non-residence of Tual which is involved in production process inside the region of Tual.
1.2. Net Regional Product is Gross Regional Product substracted with depreciation of all fixed assets which are involved in production process in certain length of time (usually a year).
1.3. Net Regional Product at
6
PDRB Menurut Lapangan Usaha 2012
barang dan jasa yang diproduksi
atau dijual. Pajak tidak langsung
bersifat menaikkan harga jual
sedangkan subsidi sebaliknya.
Produk Regional Neto atas dasar
biaya faktor produksi inilah yang
disebut Pendapatan Regional.
1.4. Pendapatan Perkapita
adalah produk regional neto atas
dasar biaya faktor produksi dibagi
dengan jumlah penduduk
pertengahan tahun.
Dalam kenyataannya, yang
bisa disajikan disini hanyalah
terbatas pada Pendapatan/
Produk “Domestik” saja.
Keterbatasan penyajian yang
tidak mencapai tahap
Pendapatan/ Produk “Regional”
disebabkan karena kesulitan
dalam memperoleh data
“Pendapatan Neto dari Luar
Region/Daerah “.
Either Indirect Taxes or Subsidies, both of them applied to goods and services which are produced and sold. Indirect Taxes are purposed to raise price, while Subsidies are otherwise.Net Regional Product at Factor Cost of production here which is called the Regional Income.
1.4. Percapita Income is Net Regional Product at Production Factor Cost divided by total mid-year population of the region.
In reality, what can be really presented here is only reached on
the level of “Domestic”
Product/Income. The incapability to present the result of calculation
to the level of “Regional” Product/
Income is mostly caused by the
difficulties to obtain data of “Net
PDRB Menurut Lapangan Usaha 2012 7 Hal ini bukan saja dialami
pada penghitungan Pendapatan
Regional Kota Tual tetapi juga
dialami pada penghitungan
Pendapatan/Produk Regional
Propinsi/Kabupaten pada
umumnya di seluruh Indonesia.
Ada 2 versi penilaian PDRB
yaitu PDRB atas dasar harga
berlaku dan PDRB atas dasar
harga konstan suatu tahun
tertentu. PDRB atas dasar harga
berlaku menggambarkan nilai
tambah barang dan jasa yang
dihitung menggunakan harga
yang berlaku pada setiap tahun
penghitungan.
Sedangkan PDRB atas dasar
harga konstan suatu tahun
tertentu menunjukkan nilai tambah
barang dan jasa tersebut yang
dihitung menggunakan harga
pada suatu tahun tertentu yang
dipakai sebagai tahun dasar,
dimana dalam penghitungan ini
digunakan tahun 2000.
It‟s not only experienced on
Regional Income calculation of Regency of Maluku Tenggara but also in experienced on calculating Regional Income of every Regencies and Provinces in Indonesia.
There are 2 version of the valuation of GRDP, which are : GRDP at current market prices and GRDP at constant market prices of a certain year. GRDP at current market prices describes value added of goods and services which are calculated based on current prices of the year of the calculation.
8
PDRB Menurut Lapangan Usaha 2012
Badan Pusat Statistik
Kabupaten Maluku Tenggara
sejak mulai menyusun angka
PDRB telah menggunakan tahun
1983 dan 1993 sebagai tahun
dasar. Angka PDRB Kota Tual
dihitung dan disajikan dengan
menggunakan tahun 2000
sebagai tahun dasar mulai dari
tahun 2004.
2. Alasan Pemilihan Tahun
2000 sebagai Tahun Dasar
Beberapa alasan untuk
memilih tahun 2000 sebagai tahun
dasar menggantikan tahun 1993
adalah :
a. Pergantian tahun dasar
merupakan sesuatu yang
reguler dilakukan oleh semua
negara yang menghitung
PDB berdasarkan System of National Accounts (SNA).
Tahun 2000 merupakan
tahun dasar yang direkomen-
dasikan PBB karena pada
tahun 2000 tersebut telah
Central Bureau of Statistics of Regency of Maluku Tenggara since began to calculate GRDP had assigned Year 1983 and Year 1993 as base year. GRDP of Municipality of Tual as calculated and presented using Year 2000 as base year since 2004.
2. Reason to Assign Year
2000 as Base Year
There are several reason for choosing year 2000 as base year replacing year 1993 :
PDRB Menurut Lapangan Usaha 2012 9 dikeluarkan SNA yang baru.
b. PDB atas dasar harga
konstan sebaiknya
dimuta-khirkan secara periodik
menggunakan tahun
referen-si yang berakhiran 0 dan 5.
Hal ini didukung oleh
Pimpinan Lembaga-lembaga
Statistik Negara ASEAN
untuk keseragaman dan
keterbandingan antar
negara-negara ASEAN.
c. Kondisi sosial ekonomi
Indonesia pada tahun 2000
menunjukkan keadaan yang
relatif stabil setelah dilanda
krisis ekonomi 1998
dibandingkan dengan
tahun-tahun sebelumnya.
d. BPS telah merampungkan
penyusunan Tabel Input
Output Indonesia 2000. Tabel
I – O dipakai sebagai basis
bagi penyusunan series baru penghitungan PDB baik
secara lapangan usaha
maupun penggunaan.
b. GDP at constant market prices is recommended to be updated periodically using reference year ended by 0 and 5.
It is approved by all Chiefs of Statistics Institues of ASEAN Countries to uniform and to maintain comparisonable between ASEAN countries. c. Social-Economics conditions
of Indonesia during the year of 2000 are relatively stable after the wave of economics crisis on 1998 if compared to those previous years.
10
PDRB Menurut Lapangan Usaha 2012
e. Perubahan struktur ekonomi
dari perekonomian agraris ke
perekonomian yang berbasis
industri dan dampak
deregulasi dan debirokratisasi
menyangkut pelaksanaan
otonomi daerah tidak tampak
dalam tahun dasar 1993.
Beberapa kegiatan baru yang
belum tercakup di tahun 1993
perlu pula diakomodasikan ke
dalam sektor-sektor ekonomi
yang sesuai.
3. Kegunaan Pendapatan
Regional
Pendapatan Regional adalah
salah satu indikator makro yang
dapat menunjukkan kondisi
perekonomian regional setiap
tahun. Manfaat yang bisa
diperoleh dari data ini antara lain
adalah :
1. PDRB (Produk Domestik
Regional Bruto) berlaku,
menunjukkan kemampuan
sumber daya ekonomi yang
dihasilkan oleh suatu daerah.
e. Change in the economics structure of agrarian economy to industrial based economy and the impact of dere-gulation and de-bureaucra-tization concerning the implementation of regional
autonomy doesn‟t appear in
the base year 1993. Several
new activities haven‟t been
included in 1993, also need to be accommodated into economic sectors as appropriate.
3. Advantages of Regional
Income
Regional Income is one of the macroeconomics indicator which can describe the regional economics condition through the year. The advantage which can be obtained from the data of Regional Income such as:
PDRB Menurut Lapangan Usaha 2012 11 2. PRB (Produk Regional
Bruto), menunjukkan
penda-patan yang mungkin dapat
dinikmati penduduk suatu
daerah.
3. PDRB harga konstan (riil),
dapat digunakan sebagai alat
ukur pertumbuhan ekonomi
suatu daerah secara
keseluruhan ataupun sektoral
dari tahun ke tahun.
4. Distribusi PDRB harga
berlaku menurut sektor
ekonomi, menunjukkan
kon-disi struktur perekonomian
dan peranan sektor-sektor
ekonomi dalam suatu daerah/
region. Sektor ekonomi yang
mempunyai peran besar
merupakan basis
perekono-mian daerah tersebut.
5. PDRB harga berlaku menurut
penggunaan, menunjukkan
bagaimana produk barang
dan jasa digunakan untuk
tujuan konsumsi, investasi
dan diperdagangkan dengan
resources provides by certain region.
2. GRP (Gross Regional Product) describes the level of income which can be obtained by all residence of the region.
3. GRDP at constant market prices (real) can be used as a measurement of economics growth either regional or sectoral year by year. 4. Distribution of GRDP at
current market prices, describes the condition of economics structure and contribution of each economics sector on a region. Economic sectors that have the greatest role is the basis of the local economy. 5. GRDP at currrent market
12
PDRB Menurut Lapangan Usaha 2012
pihak luar baik antar pulau
maupun luar negeri.
6. Distribusi PDRB menurut
penggunaan, menunjukkan
peranan kelembagaan di
dalam menggunakan barang
dan jasa yang dihasilkan dari
seluruh sektor ekonomi yang
ada di suatu daerah.
7. PDRB penggunaan atas
dasar harga konstan,
bermanfaat untuk
pengukur-an laju pertumbuhpengukur-an
konsum-si, investasi dan
perdagang-an baik perdagang-antar pulau maupun
luar negeri.
8. PDRB dan PRB perkapita
atas dasar harga berlaku,
menunjukkan nilai PDRB dan
PRB perkepala atau per satu
orang penduduk.
9. PDRB dan PRB perkapita
atas dasar harga konstan,
berguna untuk mengetahui
pertumbuhan nyata ekonomi
perkapita.
6. Distribution of GRDP by expenditure, describes the contribution of institutions in the use of goods and services produced of all economic sectors in a region.
7. GRDP by expenditure at constant market prices are useful to measure consumption growth, investment and inter-regional and international trade. 8. GRDP and GRP Percapita at
current prices shows the value of average GRDP and GRP received by each residence of the region. 9. GRDP and GRP percapita at
PDRB Menurut Lapangan Usaha 2012 13
4. Penyajian Angka Indeks
Seperti halnya semua
pendekatan penghitungan PDRB,
PDRB Kota Tual Menurut
Lapangan Usaha juga disajikan
dalam dua versi penilaian yaitu
PDRB atas dasar harga berlaku
dan PDRB atas dasar harga
konstan 2000.
Angka PDRB juga diturunkan
menjadi indikator-indikator yang
disajikan dalam persen yaitu:
a. Distribusi persentase PDRB
diperoleh dengan membagi
nilai tambah bruto tiap-tiap
sektor ekonomi atau nilai
nominal tiap-tiap komponen
penggunaan dengan nilai
total PDRB pada suatu tahun
dikalikan 100. Hal ini
menunjukkan peranan sektor
ekonomi pada suatu region
atau peranan kelembagaan
didalam menggunakan
barang dan jasa yang
dihasilkan di suatu region
pada suatu tahun tertentu.
4. Presentation of Indexes
Like all calculation approach of GRDP, GRDP of Municipality of Tual according to the business field are also presented in two version GRDP at current market prices and GRDP at 2000 constant market prices.
GRDP also differentiated into indicators which are presented in percentages, such as:
14
PDRB Menurut Lapangan Usaha 2012
b. Indeks perkembangan,
diperoleh dengan membagi
nilai pada masing masing
tahun dengan nilai pada
tahun dasar, kemudian
dikalikan 100.
Hal ini menunjukkan tingkat
perkembangan agregat
produk atau komponen
penggunaan dari tahun ke
tahun terhadap tahun
dasarnya.
c. Indeks berantai, diperoleh
dengan membagi nilai pada
masing-masing tahun dengan
nilai pada tahun sebelumnya,
kemudian dikalikan 100.
Angka ini menunjukkan
ting-kat perkembangan agregat
produk atau komponen
penggunaan untuk
masing-masing tahun terhadap tahun
sebelumnya.
b. Growth Index is obtained by dividing the value on each year with the value on the base year then multiplying it by 100.
This index describes the growth level of overall economics sectors or expenditure components of each year compared to the base year.
c. Chained index is obtained by dividing the value of each year with the value on the previous year then multiplying it by 100.
PDRB Menurut Lapangan Usaha 2012 15 d. Indeks harga implisit,
diperoleh dengan membagi
nilai atas dasar harga yang
berlaku dengan nilai atas
dasar harga konstan untuk
masing-masing tahun,
dikalikan 100.
Angka ini menunjukkan
tingkat perkembangan harga
dari agregat produk atau
komponen penggunaan
terhadap harga pada tahun
dasar. Selanjutnya bila dari
angka indeks implisit ini
dibuatkan indeks berantainya
akan terlihat tingkat
perkembangan harga setiap
tahun terhadap tahun
sebelumnya.
d. Implicit Prices Index are acquired by dividing the current market prices value with the constant market prices value and multiplying it by 100.
16
PDRB Menurut Lapangan Usaha 2012
T I N J A U A N E K O N O M I
E C O N O M I C S R E V I E W
1. Kondisi Umum Ekonomi
Pada tahun 2009-2012, Kota
Tual mengalami kemajuan dalam
pembangunan ekonomi. Hal ini
ditunjukan dengan pertumbuhan
ekonomi dari tahun 2009 hingga
tahun 2012 yang terus mengalami
peningkatan. Apabila diamati
secara rinci, percepatan
pertumbuhan ekonomi tahun 2012
terjadi di sektor-sektor ekonomi
dominan seperti: pertambangan
dan penggalian, industri
pengolahan, bangunan,
perdagangan, hotel dan restoran,
pengangkutan dan komunikasi
serta sektor jasa-jasa, sehingga
hal tersebut menyebabkan
terjadinya percepatan ekonomi
secara umum di Kota Tual.
1. Condition of Economic Public
PDRB Menurut Lapangan Usaha 2012 17 Namun demikian, masih
terdapat sektor-sektor yang
mengalami perlambatan ekonomi.
Sektor-sektor tersebut adalah
sektor listrik, gas dan air bersih
serta keuangan, persewaaan dan
jasa perusahaan, tetapi bukan
berarti sektor tersebut tidak
berpotensi untuk dikembangkan
dan diupayakan, melainkan tetap
berperan sebagai sektor
pendorong dan penggerak
ekonomi di masa yang akan
datang.
Percepatan yang telah
tercipta tersebut selanjutnya
diharapkan dapat dinikmati secara
merata oleh seluruh masyarakat.
Sehingga selain menciptakan
pertumbuhan, yang lebih penting
adalah kemampuan pemerintah
daerah dalam mengalokasikan
anggaran secara tepat, guna
menjamin terciptanya distribusi
hasil-hasil pembangunan secara
adil, serta memanfaatkan hasil
However, these are still sectors experiencing economic slowdown. These sectors are the sectors of electricity, gas and water suplly and, finance, ownership and bussiness services, but it doesn‟t mean that the sector has the potential to be developed and pursued, but will act as a incentive and activator sectors of economy in the future.
18
PDRB Menurut Lapangan Usaha 2012
pertumbuhan ekonomi tersebut
bagi peningkatakan kesejahteraan
masyarakat.
PDRB yang dilengkapi
dengan beberapa data turunan,
merupakan suatu indikator
ekonomi yang digunakan untuk
melihat perkembangan ekonomi,
atau dengan kata lain
kemampuan suatu daerah atau
region untuk mengelola potensi
ekonominya dapat tergambar
dengan penggunaan
indikator-indikator ekonomi makro. Indikator
yang sering digunakan dalam
mengevaluasi pembangunan
sektor ekonomi adalah Produk
Domestik Regional Bruto (PDRB).
Beberapa indikator yang
dapat diturunkan dari nilai PDRB
adalah perkembangan ekonomi,
laju pertumbuhan ekonomi,
struktur ekonomi, inflasi produsen
(indeks implisit), perkembangan
PDRB Perkapita dan pendapatan
mengenai ekonomi makro Kota
Tual.
GRDP are equipped with some of the data derivative, is an economic indicator that is used to look at economic development, or in other words the capability of a region to cultivate its economics potency can be described by its macro econmics indicators. Indicators are often used in evaluating economic development is Gross Regional Domestic Product (GRDP).
PDRB Menurut Lapangan Usaha 2012 19 Sebagai data yang disajikan
secara tahunan, PDRB dapat
menjelaskan perkembangan
kondisi ekonomi makro Kota Tual.
Melalui data tersebut, diperoleh
informasi mengenai perubahan
ekonomi dari tahun ke tahun.
Hasil kajian tersebut selanjutnya
dapat berguna sebagai dasar
dalam menentukan strategi dan
arah kebijakan perencanaan
pembangunan di semua sektor
ekonomi suatu wilayah sesuai
dengan perkembangan waktu.
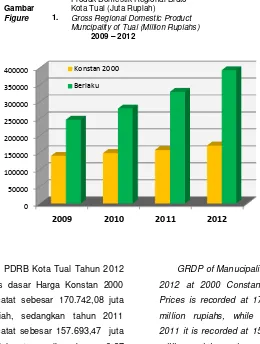
PDRB Kota Tual menurut
Lapangan Usaha Atas Dasar
Harga Berlaku tahun 2012 tercatat
sebesar 392.890,19 juta rupiah.
Bila dibandingkan dengan tahun
2011 yang tercatat sebesar
329.084,20 juta rupiah maka
terdapat kenaikan sebesar
63,805,99 juta rupiah atau 19,39
persen.
As data is presented on a yearly basis, GRDP can explain the development of macro-economic conditions of Municipality of Tual. Through these data, obtained information about economic change from year to year. These results can then be useful as a basis for determining the strategy and direction of planning policy in all sectors of the economiy of an area in accordance with the progress of time.
20
PDRB Menurut Lapangan Usaha 2012
PDRB Kota Tual Tahun 2012
atas dasar Harga Konstan 2000
tercatat sebesar 170.742,08 juta
rupiah, sedangkan tahun 2011
tercatat sebesar 157.693,47 juta
rupiah atau naik sebesar 8,27
persen dari keadaan
perekonomian tahun 2011.
GRDP of Manucipality of Tual 2012 at 2000 Constant Market Prices is recorded at 170.742,08 million rupiahs, while on year 2011 it is recorded at 157.693,47 million rupiahs or increases 8,27 percent compared to economics condition on year 2011.
0 50000 100000 150000 200000 250000 300000 350000 400000
2009 2010 2011 2012
Konstan 2000
Berlaku
Produk Domestik Regional Bruto
Gambar 1.
Kota Tual (Juta Rupiah)
Figure Gross Regional Domestic Product
Muncipality of Tual (Million Rupiahs)
PDRB Menurut Lapangan Usaha 2012 21
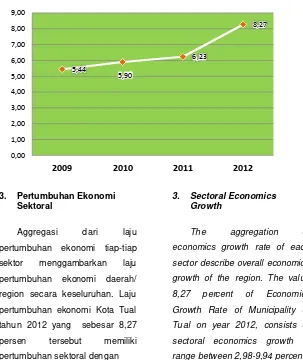
2. Pertumbuhan Ekonomi
Selama kurun waktu empat
tahun terakhir, perekonomian
Kota Tual dapat dikatakan
berkembang dengan baik. Ini
ditunjukan oleh besaran nilai
PDRB atas dasar harga konstan
yang terus meningkat sejak tahun
2009 hingga 2012. Selama
periode tersebut, Kota Tual
mengalami pertumbuhan ekonomi
rata-rata 6,46 persen per tahun.
Laju pertumbuhan PDRB
Kota Tual tahun 2012 atas dasar
harga konstan 2000 adalah
sebesar 8,27 persen, mengalami
percepatan jika dibandingkan
dengan pertumbuhan tahun 2011
sebesar 6,23 persen dan tahun
2010 sebesar 5,90 persen
[Gbr. 2].
2. Economics Growth
During the last four years, the economy of Manucipality of Tual can be said to be progressing well. This is indicated by the value of GRDP at constant prices increased from 2009 to 2012. As long as this period, Municipality of Tual experiencing an average economic growth of 6,46 percent per year.
22
PDRB Menurut Lapangan Usaha 2012
3. Pertumbuhan Ekonomi
Sektoral
Aggregasi dari laju
pertumbuhan ekonomi tiap-tiap
sektor menggambarkan laju
pertumbuhan ekonomi daerah/
region secara keseluruhan. Laju
pertumbuhan ekonomi Kota Tual
tahun 2012 yang sebesar 8,27
persen tersebut memiliki
pertumbuhan sektoral dengan
3. Sectoral Economics Growth
The aggregation of economics growth rate of each sector describe overall economics growth of the region. The value 8,27 percent of Economics Growth Rate of Municipality of Tual on year 2012, consists of sectoral economics growth in range between 2,98-9,94 percent
5,44
5,90
6,23
8,27
0,00 1,00 2,00 3,00 4,00 5,00 6,00 7,00 8,00 9,00
2009 2010 2011 2012
Laju Pertumbuhan Ekonomi
Gambar 2.
Kota Tual (%)
Figure Economics Growth Rate of
Municipality of Tual (%)
PDRB Menurut Lapangan Usaha 2012 23 kisaran antara 2,98 - 9,94 persen
dan secara rata-rata laju
pertumbuhannnya cukup stabil.
Pertumbuhan yang cukup
besar tersebut menunjukkan
bahwa ada beberapa sektor yang
tumbuh cukup pesat sementara
ada sektor lain yang
pertumbuhannya lambat
meski-pun secara agregat pertumbuhan
ekonominya relatif stabil. Secara
rinci Pertumbuhan Ekonomi
Sektoral Kota Tual ada pada
Tabel A.
Sektor Perdagangan, Hotel
dan Restoran meningkat sangat
signifikan pada tahun 2012
sebesar 9,94 persen, sehingga
dapat dikatakan bahwa
pertumbuhan ekonomi yang tinggi
di Kota Tual didorong oleh
pertumbuhan Sektor
Perdagangan. Hal ini dikarenakan
kontribusi (ADHK) sektor ini yang
sebesar 36,51 persen, yang
berarti bahwa kenaikan sebesar
9,94 persen secara riil menambah
nilai PDRB Konstan secara
and averagely the growth rate is quite The wide range of the sectoral economics growth describes that there are some sectors that grew fairly rapidly while the other sectors where growth is slowl although the economics growth as an aggregation is quite stable.The details of Sectoral Economics Growth of Manucipality of Tual are shown on Table A below.
24
PDRB Menurut Lapangan Usaha 2012
signifikan (Rp. 5.635,19 juta).
Sementara itu pertumbuhan
sektor-sektor Primer dan
Sekunder pada tahun 2012 cukup
stabil, jika dibandingkan dengan
tahun 2011 dan cenderung
mengalami percepatan, hanya
Sektor Listrik, Gas dan Air Bersih
dan Sektor Bangunan yang
mengalami perlambatan pada
tahun 2012.
Pertumbuhan sektor-sektor
Tersier mengalami kenaikan.
Sektor Perdagangan, Hotel dan
Restoran bertumbuh 3,81 persen,
Sektor Pengangkutan dan
Komunikasi bertumbuh sebesar
1,17 persen, Sektor Keuangan,
Persewaan dan Jasa Perusahaan
0,28 persen dan Sektor Jasa-jasa
0,35 persen dari Tahun 2011.
Meanwhile, the growth of other Primary and Secondary Sectors on year 2012 is stable if compared to year 2011 and tend to accelerate, only Sector of Electricity and Water Supply and Sector of Construction experienced a slowdown in 2012.
PDRB Menurut Lapangan Usaha 2012 25
Lapangan Usaha
2011 2012
Laju Pertumbuhan
Peri-ngkat
Laju Pertumbuhan
Peri-ngkat
[1] [2] [3] [4] [5]
1 Pertanian 6,72 4 8,24 4
2 Pertambangan &
Penggalian 8,41 2 9,11 3
3 Industri Pengolahan 8,82 1 9,03 2 4 Listrik & Air Bersih 5,74 7 6,11 7
5 Bangunan 7,57 3 7,52 5
6 Perdag, Hotel & Restoran 6,13 6 9,94 1 7 Angkutan & Komunikasi 4,04 8 5,22 8
8 Keuangan, Persewaan &
Jasa Perusahaan 2,70 9 2,98 9
9 Jasa-Jasa 6,32 5 6,67 6
Total 6,23 8,27
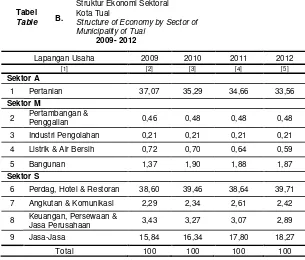
4. Struktur Ekonomi
Struktur Ekonomi Kota Tual
yang ditunjukan oleh Distribusi
Persentase PDRB Menurut
Lapangan Usaha Atas Dasar
Harga Berlaku Tahun 2012 tidak
mengalami perubahan yang
signifikan.
4. Economics Structure
Economics Structure of Municipality of Tual which is described by the Percentage Distribution of GRDP by Industrial Origin at Current Market Prices
2012 doesn‟t change significantly.
Laju Pertumbuhan Ekonomi Sektoral
Tabel
A. Kota Tual
Table Growth Rate of Economy by Sector of
Municipality of Tual
26
PDRB Menurut Lapangan Usaha 2012
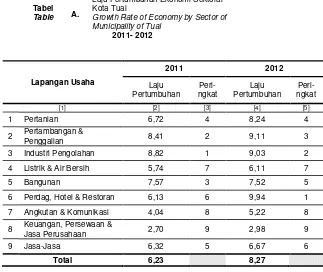
34%
3% 63%
Primer Sekunder Tersier Perekonomian Kota Tual
secara garis besar merupakan
perekonomian yang berbasiskan
pada Sektor-sektor Jasa (Sektor
Tertier), yang memberikan
kontribusi sebesar 63,29 persen
(248.642,87 juta rupiah), dengan
ditumpu oleh Sektor Primer
sebesar 34,04 persen (133.728,98
juta rupiah), sementara kontribusi
Sektor Sekunder hanya sebesar
2,68 persen (10.518,34 juta
rupiah) [Gbr. 3].
The Economy Manucipality of Tual generally an economy based on Sector (Tertiary Sector), which accounted for 63,29 percent (248.642,87 million rupiahs), and supported by Primary Sector at 34,04 percent (133.728,98 million rupiahs), while the contribution of Secondary Sector is only 2,68 percent (10.518,34 million rupiahs [Fig. 3].
Distribusi PDRB Kota Tual
Gambar 3. Menurut Sektor Atas Dasar Berlaku
Figure Distribution of GRDP of Manucipality of Tual
PDRB Menurut Lapangan Usaha 2012 27 Peranan sektor dan sub
sektor ekonomi sangat
mempengaruhi karakteristik
ekonomi suatu daerah. Hal
tersebut terkait dengan potensi
masing-masing sektor atau sub
sektor dalam memberikan
kontribusi bagi perkembangan
atau pertumbuhan ekonomi
daerah. Dimana beberapa sektor
atau sub sektor memiliki potensi
pertumbuhan tinggi, dan
sebaliknya.
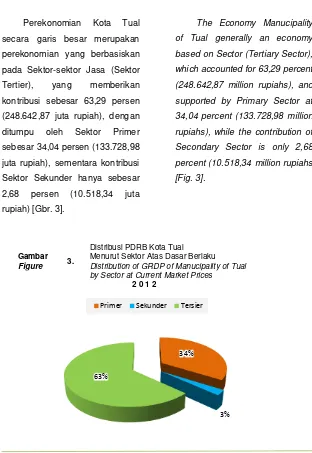
Secara umum, kegiatan
perekonomian dapat juga dibagi
dalam tiga (3) kelompok yaitu
pertanian (agriculture), produksi (manufacturing) dan jasa (services). Gambar 4. di bawah ini menunjukan bahwa selama
empat tahun terakhir telah terjadi
pergeseran kontribusi dalam
pembentukan nilai tambah (added value) barang dan jasa. Dimana sektor jasa sangat mendominasi
perekonomian di Kota Tual.
The role of sector and sub-sector of the economy greatly affects the economic characteristics of a region. This is related to the potential of each sector or sub-sector in contributing to the development or regional economic growth. Where some sectors or sub- sectors have high growth potential and otherwise.
In general, economic activities can be devided into three (3) groups; agriculture, production and serivices. The Picture 4. below shows that over the last four years there has been a shift in contributtion in the formation of value-added of goods and services. Where the service sector dominates the economy in Manucipality of Tual.
28
PDRB Menurut Lapangan Usaha 2012
Sedangkan berdasarkan
klasifikasi sembilan (9) sektor
ekonomi secara Sektoral, Sektor
Perdagangan adalah
penyum-bang terbesar dalam
pere-konomian daerah ini dengan sub
sektor andalannya yakni
Perdagangan Besar dan Eceran.
Pada Tahun 2012 kontribusi
Sektor Perdagangan, Hotel dan
Meanwhile based on the classification of the nine sectors of the economy, Sector of Trade, Hotel and Restaurant donates the biggest contribution to this
region‟s with it‟s main Sub Sector
of Wholesale and Retail Trade . On year 2012, contribution of Sector of Trade, Hotel and Restaurant is about 39,71 percent
0% 10% 20% 30% 40% 50% 60% 70% 80% 90% 100%
2009 2010 2011 2012
37,07 35,29 34,66 33,56
2,76 3,29 3,21
3,15
60,16 61,41 62,12 63,29
Agriculture Manufacture Services Struktur Ekonomi Kota Tual
Gambar
4. Structure of Economics
Figure Municipality of Tual
PDRB Menurut Lapangan Usaha 2012 29 Restoran sebesar 39,71 persen
dengan konstribusi terbesar dari
sub sektor Perdagangan Besar
dan Eceran yakni 39,53 persen.
Sektor Pertanian mempunyai
kontribusi sebesar 33,56 persen
dan didominasi oleh Sub Sektor
Perikanan sebesar 22,22 persen.
Kontribusi sebesar 18,27
persen yang merupakan
kontribusi terbesar ketiga
diperoleh dari Sektor Jasa-jasa
dan 16,64 persen diantaranya
berasal dari Sub Sektor
Pemerintahan Umum.
Sektor Keuangan, Persewaan
dan Jasa Perusahaan pada
posisi keempat memberikan
kontribusi sebesar 2,89 persen,,
dan posisi kelima oleh sektor
Pengangkutan dan Komunikasi
sebesar 2,42 persen.
Sedangkan sektor-sektor
lainnya memberikan kontribusi
sebesar 3,16 persen, dengan
kontribusi terkecil dari Sektor
Industri Pengolahan sebesar 0,21
persen.
with the biggest contribution is came from the Sub Sector of Wholesale and Retail Trade about 39,53 percent.
Sector of Agriculture gives contribution about 33,56 percent and dominated by Sub Sector Fishery at rate of 22,22 percent.
The third biggest contributor at level of 18,27 percent given by the Sector of Services which 16,64 percent of the contribution. came from Sub Sector of General Government.
Sector of Finance, Ownership and Business Services is the fourth position of contributing 2,89 percent, and Sector of Transportation and Communication at fifth position gives 2,42 percent.
Meanwhile, the other sectors totally contributes 3,16 percent with the smallest contribution came from Sector of Manufacturing Industries at rate of 0,21 percent.
30
PDRB Menurut Lapangan Usaha 2012
Lapangan Usaha 2009 2010 2011 2012
[1] [2] [3] [4] [5]
Sektor A
1 Pertanian 37,07 35,29 34,66 33,56
Sektor M
2 Pertambangan &
Penggalian 0,46 0,48 0,48 0,48 3 Industri Pengolahan 0,21 0,21 0,21 0,21 4 Listrik & Air Bersih 0,72 0,70 0,64 0,59
5 Bangunan 1,37 1,90 1,88 1,87
Sektor S
6 Perdag, Hotel & Restoran 38,60 39,46 38,64 39,71 7 Angkutan & Komunikasi 2,29 2,34 2,61 2,42
8 Keuangan, Persewaan &
Jasa Perusahaan 3,43 3,27 3,07 2,89 9 Jasa-Jasa 15,84 16,34 17,80 18,27
Total 100 100 100 100
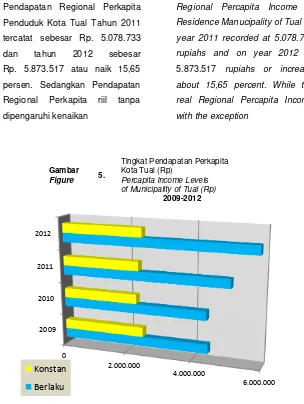
5. Pendapatan Regional Perkapita
Keberhasilan pembangunan Kota
Tual tidak cukup hanya
mem-perhatikan perkembangan PDRB
secara total, tetapi juga dilihat
perkembangan PDRB per kapita
atas dasar harga berlaku dan atas
dasar harga konstan [Gbr. 4].
5. Regional Percapita Income
The Residence Welfare of Manucipality of Tual that can be seen from its level of the Regional Percapita Income tends to constantly increase [Fig. 4].
Struktur Ekonomi Sektoral
Tabel
B. Kota Tual
Table Structure of Economy by Sector of
Municipality of Tual
PDRB Menurut Lapangan Usaha 2012 31 0
2.000.000
4.000.000
6.000.000 2009
2010 2011 2012
Konstan
Berlaku
Pendapatan Regional Perkapita
Penduduk Kota Tual Tahun 2011
tercatat sebesar Rp. 5.078.733
dan tahun 2012 sebesar
Rp. 5.873.517 atau naik 15,65
persen. Sedangkan Pendapatan
Regional Perkapita riil tanpa
dipengaruhi kenaikan
Regional Percapita Income of Residence Manucipality of Tual on year 2011 recorded at 5.078.733 rupiahs and on year 2012 at
5.873.517 rupiahs or increase about 15,65 percent. While the real Regional Percapita Income with the exception
Tingkat Pendapatan Perkapita
Gambar
5. Kota Tual (Rp)
Figure Percapita Income Levels
32
PDRB Menurut Lapangan Usaha 2012
harga barang dan jasa dapat
diketahui dari Pendapatan
Regional Perkapita atas dasar
harga konstan tahun 2000 yang
pada tahun 2012 sebesar
Rp. 2.484.792 atau naik 4,49
persen dibandingkan tahun 2011.
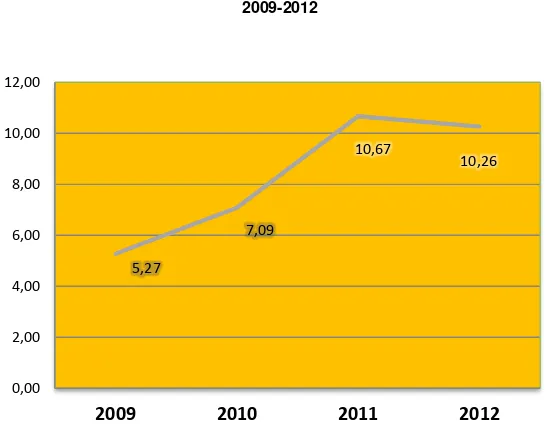
6. Indeks Harga Implisit
Indeks Harga Implisit PDRB
merupakan indikator yang
digunakan untuk mengetahui
tingkat inflasi/deflasi suatu
daerah/region pada suatu periode
tertentu. Indeks Harga Implisit
Kota Tual pada tahun 2012
sebesar 230,11 persen dan tahun
2011 sebesar 208,69 persen.
Dari angka indeks implisit
tersebut dapat dihitung Laju Inflasi
Harga Produsen Barang dan Jasa
di Kota Tual yaitu sebesar 10,67
persen pada tahun 2011 dan
10,26 persen pada tahun 2012.
[Gbr. 5]
of goods and services prices changes can be seen from Regional Percapita Income at 2000 constant market prices which in year 2012 amounted to 2.484.792 rupiahs or increased 4,49 percent compared to 2011.
6. Implicit Price Index
GRDP Implicit Price Index is an indicator for measuring inflation/deflation rate on a region at certain period of time. Implicit Price Index Manucipality of Tual on year 2012 is at 230,11 percent and on year 2011 is at 208,69 percent.
PDRB Menurut Lapangan Usaha 2012 33 Laju Inflasi Harga Produsen Barang dan Jasa
Gambar
6. Kota Tual (%)
Figure Inflation Rate at Goods and Services Producers
Prices of Municipality of Tual (%) 2009-2012
5,27
7,09
10,67
10,26
0,00 2,00 4,00 6,00 8,00 10,00 12,00
34
PDRB Menurut Lapangan Usaha 2012
TABEL-TABEL
TABLES
Tabel Table
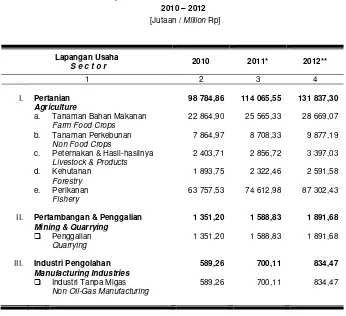
1.
Produk Domestik Regional Bruto Kota Tual
menurut Lapangan Usaha Atas Dasar Harga Berlaku
Gross Domestic Regional Products of Municipality of Tual by Business Field at Current Market Prices 2010 – 2012
[Jutaan / Million Rp]
Lapangan Usaha
S e c t o r 2010 2011* 2012**
1 2 3 4
I. Pertanian 98 784,86 114 065,55 131 837,30
Agriculture
a. Tanaman Bahan Makanan 22 864,90 25 565,33 28 669,07
Farm Food Crops
b. Tanaman Perkebunan 7 864,97 8 708,33 9 877,19
Non Food Crops
c. Peternakan & Hasil-hasilnya 2 403,71 2 856,72 3 397,03
Livestock & Products
d. Kehutanan 1 893,75 2 322,46 2 591,58
Forestry
e. Perikanan 63 757,53 74 612,98 87 302,43
Fishery
II. Pertambangan & Penggalian 1 351,20 1 588,83 1 891,68 Mining & Quarrying
Penggalian 1 351,20 1 588,83 1 891,68
Quarrying
III. Industri Pengolahan 589,26 700,11 834,47 Manufacturing Industries
Industri Tanpa Migas 589,26 700,11 834,47
PDRB Menurut Lapangan Usaha 2012 35 Lanjutan Tabel 1 / Continued Table 1
Lapangan Usaha
S e c t o r 2010 2011* 2012**
1 2 3 4
IV. Listrik, Gas & Air Bersih 1 962,40 2 116,48 2 321,46 Electricity, Gas & Water Supply
a. Listrik 1 779,85 1 907,05 2 079,11
Electricity
b. Air Bersih 182,55 209,43 242,35
Water Supply
V. Bangunan / Construction 5 324,91 6 195,19 7 362,41
VI. Perdagangan, Hotel & Restoran 110 460,51 127 142,08 156 011,50 Trade, Hotel & Restaurant
a. Perdagangan 109 949,57 126 558,83 155 316,84
T r a d e
b. H o t e l 120,00 136,60 156,50
H o t e l
c. Restoran 390,94 446,65 538,16
Restaurant
VII. Pengangkutan & Komunikasi 6 550,70 8,589,55 9 510,05 Transport & Communication
a. Pengangkutan 5 214,07 7 106,86 7 886,99
Transport
1. Angkutan Jalan Raya 2 570,69 4 166,47 4 539,62
Road Transport
2. Angkutan Laut 1 908,66 2 120,83 2 424,55
Sea Transport
3. Angkutan Sungai, Danau 344,45 386,45 428,63 dan Penyeberangan
Inland Water Transport
4. Angkutan Udara 0,00 0,00 0,00
Air Transport
5. Jasa Penunjang Angkutan 390,27 433,11 494,19
Service Allied to Transport
36
PDRB Menurut Lapangan Usaha 2012
Lanjutan Tabel 1 / Continued Table 1
Lapangan Usaha
S e c t o r 2010 2011* 2012**
1 2 3 4
VIII Keuangan, Persewaan dan 9 163,74 10 110,73 11 350,43 Jasa Perusahaan
Finance, Ownership and Business Services
a. B a n k 1 977,75 2 185,84 2 414,40
B a n k
b. Lembaga Keu. Tanpa Bank 257,97 290,65 319,21
Non Bank Financial Institution
c. Sewa Bangunan 6 842,02 7 539,01 8 510,00
Building Rental
d. Jasa Perusahaan 86,00 95,23 106,82
Business Services
IX. Jasa – jasa 45 726,33 58 575,69 71 770,89
Services
a. Pemerintahan Umum 40 453,71 52 733,83 65 376,51
General Government
b. S w a s t a 5 272,62 5 801,86 6 394,38
P r i v a t e
1. Sosial Kemasyarakatan 4 220,79 4 648,07 5 108,87
Social & Community
2. Hiburan & Rekreasi 21,46 24,19 26,93
Amusement & Recreation
3. Perorangan & RT. 1 030,37 1 129,60 1 258,58
Personal & Household
Produk Domestik Regional Bruto
PDRB Menurut Lapangan Usaha 2012 37
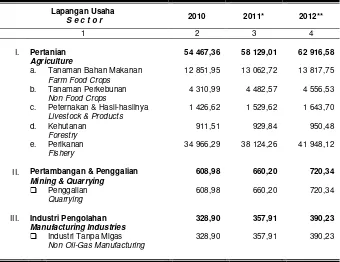
Tabel
Table 2.
Produk Domestik Regional Bruto Kota Tual
menurut Lapangan Usaha Atas Dasar Harga Konstan 2000
Gross Domestic Regional Products of Municipality of Tual by Business of Field at 2000 Constant Market Prices 2010 – 2012
[Jutaan / Million Rp]
Lapangan Usaha
S e c t o r 2010 2011* 2012**
1 2 3 4
I. Pertanian 54 467,36 58 129,01 62 916,58
Agriculture
a. Tanaman Bahan Makanan 12 851,95 13 062,72 13 817,75
Farm Food Crops
b. Tanaman Perkebunan 4 310,99 4 482,57 4 556,53
Non Food Crops
c. Peternakan & Hasil-hasilnya 1 426,62 1 529,62 1 643,70
Livestock & Products
d. Kehutanan 911,51 929,84 950,48
Forestry
e. Perikanan 34 966,29 38 124,26 41 948,12
Fishery
II. Pertambangan & Penggalian 608,98 660,20 720,34
Mining & Quarrying
Penggalian 608,98 660,20 720,34
Quarrying
III. Industri Pengolahan 328,90 357,91 390,23 Manufacturing Industries
Industri Tanpa Migas 328,90 357,91 390,23
38
PDRB Menurut Lapangan Usaha 2012
Lanjutan Tabel 2 / Continued Table 2
Lapangan Usaha
S e c t o r 2010 2011* 2012**
1 2 3 4
IV. Listrik, Gas & Air Bersih 838,20 886,34 940,46
Electricity, Gas & Water Supply
a. Listrik 741,05 781,51 827,08
Electricity
b. Air Bersih 97,15 104,83 113,38
Water Supply
V. Bangunan / Construction 2 666,59 2 868,41 3 084,12
VI. Perdagangan, Hotel & Restoran
53 425,90 56 699,44 62 334,63 Trade, Hotel & Restaurant
a. Perdagangan 53 138,84 56 396,25 62 007,68
T r a d e
b. H o t e l 57,70 61,36 65,43
H o t e l
c. Restoran 229,36 241,84 261,52
Restaurant
VII. Pengangkutan & Komunikasi 3 738,56 3 889,74 4 092,63 Transport & Communication
a. Pengangkutan 3 215,09 3 340,70 3 515,42
Transport
1. Angkutan Jalan Raya 1 514,40 1 615,98 1 680,78
Road Transport
2. Angkutan Laut 1 229,25 1 233,18 1 320,49
Sea Transport
3. Angkutan Sungai, Danau 217,54 225,94 235,59 dan Penyeberangan
Inland Water Transport
4. Angkutan Udara 0,00 0,00 0,00
Air Transport
5. Jasa Penunjang Angkutan 253,90 265,60 278,56
Service allied to Transport
PDRB Menurut Lapangan Usaha 2012 39 Lanjutan Table 2 / Continued Table 2
Lapangan Usaha
S e c t o r 2010 2011* 2012**
1 2 3 4
VIII Keuangan, Persewaan dan 5 840,40 5 998,29 6 177,08 Jasa Perusahaan
Finance, Ownership and Business Services
a. B a n k 1 298,33 1 345,30 1 401,93
B a n k
b. Lembaga Keu. Tanpa Bank 152,97 157,50 162,24
Non Bank Financial Institution
c. Sewa Bangunan 4 330,94 4 435,75 4 551,53
Building Rental
d. Jasa Perusahaan 58,16 59,74 61,38
Business Services
IX. Jasa - jasa 26 527,55 28 190,81 30 086,01
Services
a. Pemerintahan Umum 23 335,09 24 926,24 26 733,39
General Government
b. S w a s t a 3 192,46 3 277,89 3 352,62
P r i v a t e
1. Sosial Kemasyarakatan 2 467,43 2 540,96 2 602,45
Social & Community
2. Hiburan & Rekreasi 14,48 14,96 15,49
Amusement & Recreation
3. Perorangan & RT. 710,55 721,97 734,68
Personal & Household
Produk Domestik Regional Bruto
40
PDRB Menurut Lapangan Usaha 2012
Tabel
Table 3.
Distribusi Persentase Produk Domestik Regional Bruto Kota Tual menurut Lapangan Usaha Atas Dasar Harga Berlaku
Percentage Distribution Gross Domestic Regional Products of Municipality o