CHAPTER IV
RESULT
The data obtained from the medical records of head and neck cancer patients between 2010 and 2014 in Kariadi Central Hospital and Waspada Laboratory Semarang resulting:
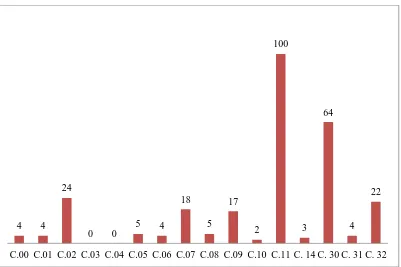
Figure 6. The Incidence of Head and Neck Cancer in Semarang
during 2010- 2014 Where :
C.00 : Malignant Neoplasm of Lip
C.01 : Malignant Neoplasm of Base of Tongue
C.02 : Malignant Neoplasm of Other and Unspecified Parts of Tongue C.03 : Malignant Neoplasm of Gum
C.06 : Malignant Neoplasm of Other and Unspecified Parts of Mouth C.07 : Malignant Neoplasm of Parotid Gland
C.08 : Malignant Neoplasm of Other and Unspecified Major Salivary Glands C.09 : Malignant Neoplasm of Tonsil
C.10 : Malignant Neoplasm of Oropharynx C.11 : Malignant Neoplasm of Nasopharynx
C.14 : Malignant Neoplasm of Other and Ill- defined Sites in The Lip, Oral Cavity and Pharynx
C.30 : Malignant Neoplasm of Nasal Cavity and Middle Ear C.31 : Malignant Neoplasm of Accessory Sinuses
C.32 : Malignant Neoplasm of Larynx
From the figure above, nasopharyngeal cancer, coded with C.11 is the most cases diagnosed in this period. It is followed with malignant neoplasm of nasal cavity and middle ear (C.30). It is similar with the previous research conducted by Onggo Wiliyanto that nasopharyngeal cancer is the most cases diagnosed of head and neck cancer.
Figure 7. Age Distribution of Head and Neck Cancer in Semarang during
Based on the figure above, the age of Head and Neck Cancer patients diagnosed in Semarang between 2010- 2014, distributed mostly in age group 40-44 and followed with age group 45- 49.
4.1 Malignant Neoplasm of Lip (C. 00)
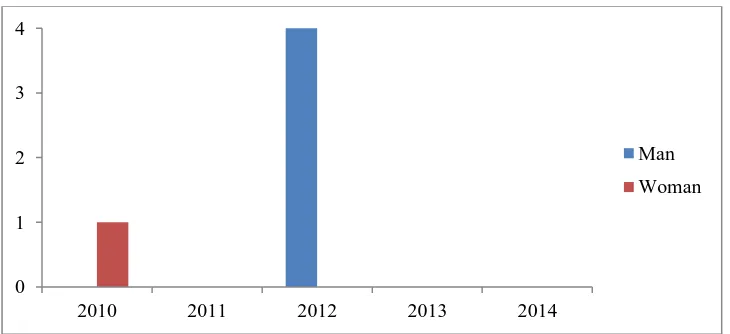
As can be seen from the figure below, the highest cases of lip cancer occurred in 2010 and higher in women. The distributions of age have the similar total case in the age group of 25-29, 35- 39, 65-69 and 70- 74.
Figure 8. The Incidence of Malignant Neoplasm of Lip Based on Sex
in Semarang during 2010- 2014
Figure 9. The Incidence of Malignant Neoplasm of Lip Based on Age
in Semarang during 2010- 2014
0 1 2 3
2010 2011 2012 2013 2014
Male
25-29 30-34 35-39 40- 4
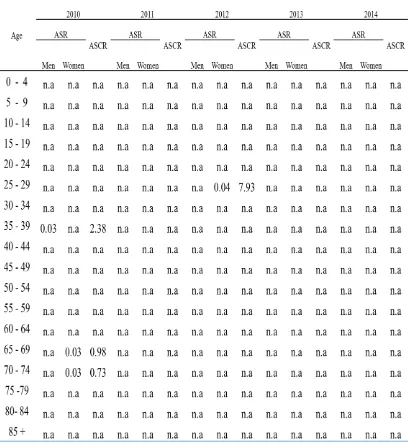
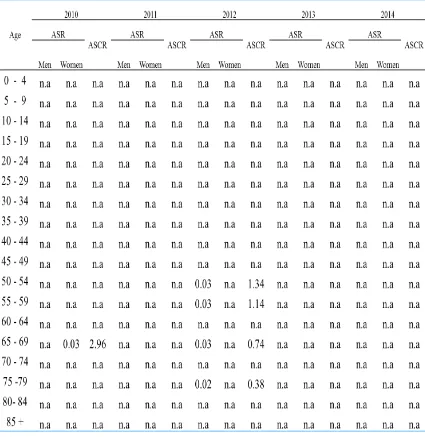
Table 6. ASR and ASCR score of Malignant Neoplasm of Lip in Semarang
during 2010-2014
*n.a. : not available
4.2. Malignant Neoplasm of Base of Tongue (C.01)
As can be seen from the figure below, the highest cases of malignant neoplasm of Base of Tongue occurred in 2010 and higher in men. The distributions of age have the similar total case in the age group of 35- 39, 55-59, 60-64 and 70-74.
Figure 10. The Incidence of Malignant Neoplasm of Base of Tongue
Based on Sex in Semarang during 2010- 2014
Figure 11. The Incidence of Malignant Neoplasm of Base of Tongue
Based on Age in Semarang during 2010- 2014
0 1 2
2010 2011 2012 2013 2014
Table 7. ASR and ASCR score of Malignant Neoplasm of Base of Tongue in
Semarang during 2010-2014
*n.a. : not available
4.3. Malignant Neoplasm of Other and Unspecified Parts of Tongue (C.02)
As can be seen from the figure below, the highest cases of malignant neoplasm of other and Unspecified Parts of Tongue occurred in 2013 and higher in women. The highest distributions of age were in age 35-39
Figure 12. The Incidence of Malignant Neoplasm of Other and Unspecified
Parts of Tongue Based on Sex in Semarang during 2010- 2014
Figure 13. The Incidence of Malignant Neoplasm of Other and Unspecified
Parts of Tongue Based on Age in Semarang during 2010- 2014
0
2010 2011 2012 2013 2014
Table 8. ASR and ASCR score of Malignant Neoplasm of Other and Unspecified
Parts of Tongue in Semarang during 2010-2014
*n.a. : not available
The highest ASR score in 2014 was the women ASR score in age group 35-39. The highest ASCR score occurred in 2014 was also in age group 35-35-39.
4.4 Malignant Neoplasm of Gum (C.03)
4.5. Malignant Neoplasm of Floor of Mouth (C.04)
The data was not available, ASR and ASCR score cannot be determined.
4.6. Malignant Neoplasm of Palate (C.05)
As can be seen from the figure below, the highest cases of malignant neoplasm of other and Unspecified Parts of Tongue occurred in 2013 and higher in men. The distributions of age have the similar total case in the age group of 40- 44, 50-54 and 60-64.
Figure 14. The Incidence of Malignant Neoplasm of Palate Based on Sex
in Semarang during 2010- 2014
Figure 15. The Incidence of Malignant Neoplasm of Palate Based on Age
in Semarang during 2010- 2014
0 1 2
2010 2011 2012 2013 2014
Table 9. ASR and ASCR score of Malignant Neoplasm of Palate in Semarang
during 2010-2014
*n.a. : not available
4.7. Malignant Neoplasm of Other and Unspecified Parts of Mouth (C.06)
As can be seen from the figure below, the highest cases of malignant neoplasm of other and Unspecified Parts of Mouth occurred in 2013 and higher in men. The distributions of age have the similar total case each year in the age group of 0-4, 50-54 and 55-59.
Figure 16. The Incidence of Malignant Neoplasm of other and Unspecified
Parts of Mouth Based on Sex in Semarang during 2010- 2014
Figure 17. The Incidence of Malignant Neoplasm of other and Unspecified
Parts of Mouth Based on Age in Semarang during 2010- 2014
0 1 2 3
2010 2011 2012 2013 2014
Table 10. ASR and ASCR score of Malignant Neoplasm of other and Unspecified
Parts of Mouth in Semarang during 2010-2014
*n.a. : not available
4.8. Malignant Neoplasm of Parotid Gland (C.07)
As can be seen from the figure below, the highest cases of malignant neoplasm of parotid gland occurred in 2013 and higher in men. The highest distribution of age was in group 45- 49.
Figure 18. The Incidence of Malignant Neoplasm of Parotid Gland
Based on Sex in Semarang during 2010- 2014
Figure 19. The Incidence of Malignant Neoplasm of Parotid Gland
Based on Age in Semarang during 2010- 2014
0
2010 2011 2012 2013 2014
Table 11. ASR and ASCR score of Malignant Neoplasm of Parotid Gland in
Semarang during 2010-2014
*n.a. : not available
4.9. Malignant Neoplasm of Other and Unspecified Major Salivary Glands (C.08)
As can be seen from the figure below, the highest cases of malignant neoplasm of other and unspecified major salivary glands occurred in 2012 and higher in men. The highest distributions of age was in group 65- 69.
Figure 20. The Incidence of Malignant Neoplasm of other and Unspecified
Major Salivary Glands Based on Sex in Semarang during 2010- 2014
Figure 21. The Incidence of Malignant Neoplasm of other and Unspecified
Major Salivary Glands Based on Age in Semarang during 2010- 2014
0 1 2 3 4
2010 2011 2012 2013 2014
Table 12. ASR and ASCR score of Malignant Neoplasm of other and Unspecified
Major Salivary Glands in 2010-2014
*n.a. : not available
4.10. Malignant Neoplasm of Tonsil (C.09)
As can be seen from the figure below, the highest cases of malignant neoplasm of other and unspecified major salivary glands occurred in 2010 and higher in men. The highest distributions of age were both in age group 40-44 and 55-59.
Figure 22. The Incidence of Malignant Neoplasm of Tonsil Based on Sex
in Semarang during 2010- 2014
Figure 23. The Incidence of Malignant Neoplasm of Tonsil Based on Age
in Semarang during 2010- 2014
0
2010 2011 2012 2013 2014
Table 13. ASR and ASCR score of Malignant Neoplasm of Tonsil in Semarang
during 2010-2014
*n.a. : not available
4.11. Malignant Neoplasm of Oropharynx (C.10)
As can be seen from the figure below, the incidence of malignant neoplasm of oropharynx was mutual in 2010 and 2014. Both of year showed that this malignancy happened in men. The highest distributions of age were in age group 55-59.
Figure 24. The Incidence of Malignant Neoplasm of Oropharynx Based on
Sex in Semarang during 2010- 2014
Figure 25. The Incidence of Malignant Neoplasm of Oropharynx
Based on Age in Semarang during 2010- 2014
0 0.5 1
2010 2011 2012 2013 2014
Table 14. ASR and ASCR score of Malignant Neoplasm of Oropharynx in
Semarang during 2010-2014
*n.a. : not available
4.12. Malignant Neoplasm of Nasopharynx (C.11)
As can be seen from the figure below, the highest incidence of malignant neoplasm of nasopharynx was in 2013 and higher in men. Both of year showed that this malignancy happened in men. The highest distributions of age were in age group 40-44.
Figure 26. The Incidence of Malignant Neoplasm of Nasopharynx
Based on Sex in Semarang during 2010- 2014
Figure 27. The Incidence of Malignant Neoplasm of Nasopharynx Based on
Age in Semarang during 2010- 2014
0
2010 2011 2012 2013 2014
Table 15. ASR and ASCR score of Malignant Neoplasm of Nasopharynx in
Semarang during 2010-2014
*n.a. : not available
4.13. Malignant Neoplasm of Piriform Sinus (C.12)
The data was not available, ASR and ASCR score cannot be determined.
4.14. Malignant Neoplasm of Hypopharinx (C. 13)
The data was not available, ASR and ASCR score cannot be determined.
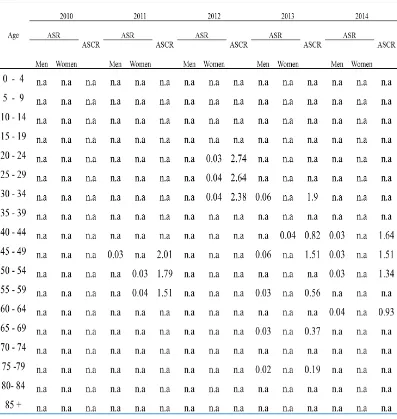
4.15 Malignant Neoplasm of Other and Ill- defined Sites in The Lip, Oral
Cavity and Pharynx (C.14)
As can be seen from the figure below, the highest incidence of malignant neoplasm of other and Ill-defined Sites in The Lip, Oral Cavity and Pharynx was in 2010 and higher in men. The incidence of thus malignancy were mutual in several age group ; 20-24, 45-49 and 80-84.
Figure 28. The Incidence of Malignant Neoplasm of other and Ill-defined
Sites in The Lip, Oral Cavity and Pharynx Based on Sex in Semarang during 2010- 2014
0 0.5 1
2010 2011 2012 2013 2014
Figure 29. The Incidence of Malignant Neoplasm of other and Ill-defined
Sites in The Lip, Oral Cavity and Pharynx Based on Age in Semarang during 2010- 2014
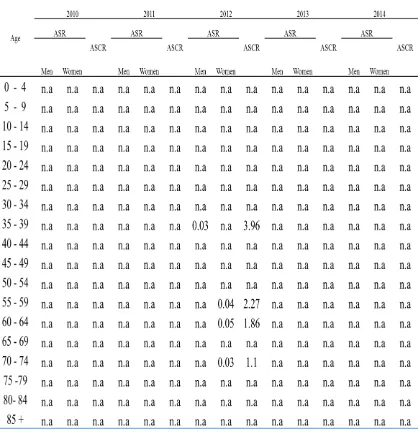
Table 16. ASR and ASCR score of Malignant Neoplasm of other and Ill-defined
Sites in The Lip, Oral Cavity and Pharynx in Semarang during 2010-2014
The highest ASR score in men was 0,03, occurred in 2012 in age group 45-49. The highest ASR score in women was 0,03, occurred in 2010 in age group 20-24. The highest ASCR score was 6.04, occurred in 2012 in age group 45-49.
4.16. Malignant Neoplasm of Nasal Cavity and Middle Ear (C.30)
As can be seen from the figure below, the highest incidence of malignant neoplasm of nasal cavity and middle ear was mutual in 2012 and 2013 and higher in men. The highest age distribution was in age group 45- 49.
Figure 30. The Incidence of Malignant Neoplasm of Nasal Cavity and Middle
Ear Based on Sex in Semarang during 2010- 2014
Figure 31. The Incidence of Malignant Neoplasm of Nasal Cavity and Middle
Ear Based on Age in Semarang during 2010- 2014
0
2010 2011 2012 2013 2014
Table 17. ASR and ASCR score of Malignant Neoplasm of Nasal Cavity and
Middle Ear in Semarang during 2010-2014
*n.a. : not available
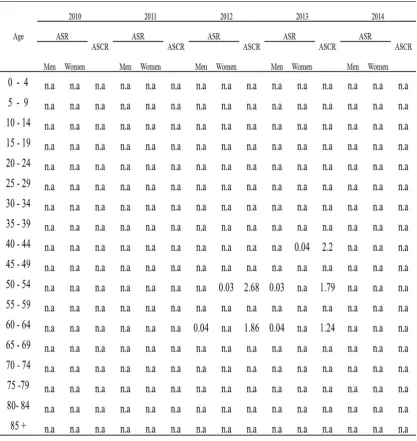
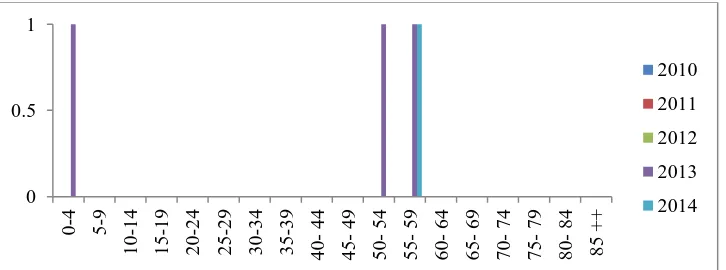
4.17. Malignant Neoplasm of Accessory Sinuses (C.31)
As can be seen from the figure below, the highest incidence of malignant neoplasm of accessory sinuses was in 2010 and higher in women.
Figure 32. The Incidence of Malignant Neoplasm of Accessory Sinuses
Based on Sex in Semarang during 2010- 2014
Figure 33. The Incidence of Malignant Neoplasm of Accessory Sinuses
Based on Age in Semarang during 2010- 2014
0 0.5 1
2010 2011 2012 2013 2014
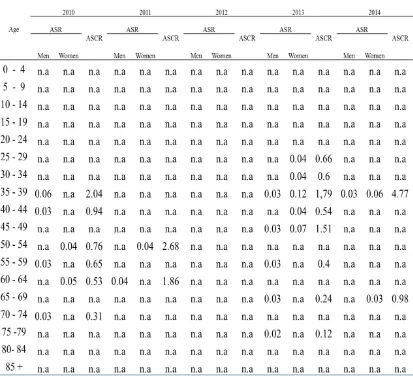
Table 18. ASR and ASCR score of Malignant Neoplasm of Accessory Sinuses in
Semarang during 2010-2014
*n.a. : not available
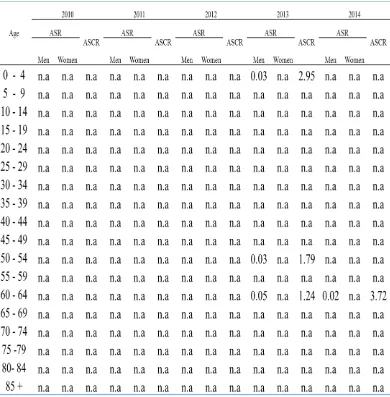
4.18. Malignant Neoplasm of Larynx (C.32)
As can be seen from the figure below, the highest incidence of malignant neoplasm of larynx was in 2014 and all cases happened in men. Meanwhile, most cases distributed in age group 60-64.
Figure 34. The Incidence of Malignant Neoplasm of Larynx Based on Sex in
Semarang during 2010- 2014
Figure 35. The Incidence of Malignant Neoplasm of Larynx Based on Age
in Semarang during 2010- 2014
0
2010 2011 2012 2013 2014
Table 19. ASR and ASCR score of Malignant Neoplasm of Larynx in Semarang
during 2010-2014
*n.a. : not available