24
Aisya Gusnelia, 2014
An Analysis of Phonological Featuresof Autistic Children
Universitas Pendidikan Indonesia | repository.upi.edu | perpustakaan.upi.edu CHAPTER III
RESEARCH METHODOLOGY
This chapter presents the methodology used in this study. As mentioned in
Chapter I, this study seeks to investigate the sound production of Indonesian
autistic children, especially fricative sounds and to identify the kind of
phonological patterns occur in their speech, also whether or not their speech sound
production in the form of single-word production is better than in the form of
spontaneous speech in conversation. The rest of this chapter presents the
predictions, design, data collection, procedures of data analysis, and examples of
data analysis.
3.1.Predictions
This study aims to provide valid and reliable data for the phonological features on
speech production of Indonesian autistic children. Based on the results from the
previous studies, there two predictions which were used in this study:
1. Indonesian autistic children may produce more sounds imperfectly (not only
fricative sounds) and may produce more phonological patterns in their speech
production. This prediction relies on Ingram’s (1986) idea that problems in
sound production and phonological patterns are universal. Therefore, if they
are truly universal, then it would be reasonable to expect to find them
operating not only in the speech of normal children but also in the speech of
children with impairments, especially children with autism.
2. Autistic children will produce sounds better in the form of single-word
production of pronunciation test than in the form of spontaneous speech in
conversation phase. This prediction relies on Tager-Flusberg et al.’s (2005, p.
Aisya Gusnelia, 2014
An Analysis of Phonological Featuresof Autistic Children
Universitas Pendidikan Indonesia | repository.upi.edu | perpustakaan.upi.edu
25 3.2.Research Design
This study primarily applied a descriptive qualitative design supported by some
quantification in the form of how the data were recorded in percentages. A
qualitative research was appropriate to employ because the present study works in
natural settings rather than fully controlled. In particular, this study is a case study
which involved autistic children whose ages range from 9 to 10 years. This design
relies on Denzin & Lincoln’s (2005 in Creswell, 2007, p. 36) notion that, “Qualitative research involves an interpretive, naturalistic approach to the world”. It means that qualitative research, study things in their natural settings, attempting
to make sense of, or interpret phenomena in terms of the meanings people bring to
them. Therefore, this design is in line with the aims of this study which is to
investigate the sound production of autistic children in spontaneous speech and in
single-word production.
3.3.Data Collection
This part consists of the research site and participants, data collection techniques,
and data transcription of the study. Further descriptions can be seen in the
following sections.
3.3.1. Research Site and Participants
This study was conducted at one school for special needs children in SLB Autisma YPPA, Bukittinggi. Four children were recruited as participants and they were directly chosen and assigned by the institution. The chosen children are confirmed
to meet DSM-IV criteria for diagnosis on autism by the director of the institution.
The purposive sampling was used in this study and the participants who were
purposively chosen were based on the following criteria: boy and girl, autistic
children, ages range from 9 to 10 years old, easily mingle with new people, have
better pronunciation in speech, and have been being students in the selected
Aisya Gusnelia, 2014
An Analysis of Phonological Featuresof Autistic Children
Universitas Pendidikan Indonesia | repository.upi.edu | perpustakaan.upi.edu
26 The study only involved a small number of participants (four children)
which comprised of three boys and one girl. The decision of not choosing more
participants is intended to avoid sampling error (Oppong, 2013).
3.3.2. Data Collection Techniques
The collection of data and the observation of the participants were conducted from
April 21st to April 29th, 2014. This observation was conducted by paying close
attention to the process of how the participants produced sounds in their speech.
In terms of data collection technique, the data were collected through two
different tasks, namely Conversation phase and the Pronunciation test. In the conversation phase, the voice of participants’ spontaneous speech was recorded
along the session of their class with their teacher in Individual Therapy Class.
This technique relies on Tager-Flusberg’s (2000) notion that “in the field of child language, the richest source of data comes from spontaneous speech samples” (p. 315). Each participant spent two hours with their teacher who worked on oral
language development through conversation and small games.
In addition, the pronunciation test was administered to obtain more data.
All the participants received the same pronunciation test to complete. They were
tested individually and were required to read 188 single words. This test was
administered to participants because the data taken from conversation phase were
limited and were not cover all target phonemes. The process taken to complete
this pronunciation test was also recorded for each participant. Moreover, the time
for participants to complete this test was not limited.
3.3.3. Data Transcription
The recordings of conversation phase and pronunciation test were transcribed and
used as the primary source. This is in line with Atkinson and Heritage (1984 in
Silverman, 1993) who states as follows:
re-Aisya Gusnelia, 2014
An Analysis of Phonological Featuresof Autistic Children
Universitas Pendidikan Indonesia | repository.upi.edu | perpustakaan.upi.edu
27 examined in the context of new findings. (Atkinson & Heritage, 1984 in Silverman, 1993, p. 119)
Prior to the transcription, the recorded speech was transcribed in the form
of orthographic transcription with the assistance of one shadow teacher in the
research site. The involvement of the shadow teacher to assist this data
transcription was intended to minimize transcribing error. The transcriptions were
then compared and any disagreements were resolved through negotiation. If a
disagreement could not be resolved, the particular word under discussion was
discarded by the writer.
For the purpose of analysis, the phonetic transcription was then made by
the writer by following the International Phonetic Alphabet system. In
consideration of the fact that children normally have little difficulty with vowels
(Templin, 1957; Locke, 1969 as cited in Piper, 1984), and because the analysis of
the data showed that participants had no difficulty with vowels, only the
consonant sounds were focused in this study. An example of transcription is
presented below.
Raw Data: Voice Transcription of Conversation (Orthographically)
Teacher : “Lihat ibu nak! Berapa umurmu?” Participant : “Sebuluhtahu.”
Teacher : “Bagus, pandai sekali! Kapan kamu lahir?” Participant : “taga satu febwuayi dua yibu empat.”
Teacher : “Oke, pandai! Berapa umurmu?” Participant : “sebuluhtahu”
Teacher : “Dimana rumahmu?” Participant : “Bintu Kabun.” Teacher : “PINTU KABUN!” Participant : “Bintu Kabun.”
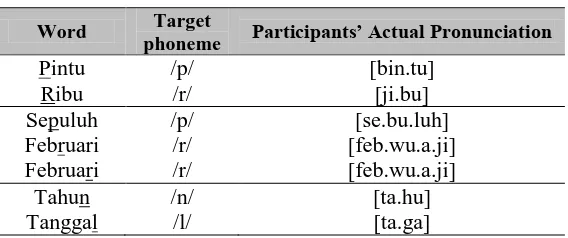
The texts in bold indicate the important words which were then transcribed into
Aisya Gusnelia, 2014
An Analysis of Phonological Featuresof Autistic Children
Universitas Pendidikan Indonesia | repository.upi.edu | perpustakaan.upi.edu
28 Table 3.1 Example of Phonetic Transcription
Word Target
3.4.Procedures of Data Analysis
The data were analyzed by following steps. First, the data were taken from the results of phonetic transcription of conversation phase and pronunciation test.
Second, the data were classified based on the classes of sound such as plosives,
fricatives, and affricatives to examine how each sound was produced by
participants. Third, any alternations of target sounds which were produced by
participants were collected. Forth, the phonetic environments were examined by
using theory from Crowley (2005) to discover the preferences of those
alternations. Fifth, the collected data were identified to discover phonological
patterns of participants by using theory from Ingram (1986) and a supported
theory by Bowen (2009). Sixth, the data were examined to discover whether participants’ sound production in the form of spontaneous speech in conversation phase is better than in the form of single-word production in pronunciation test.
The last was drawing conclusion from the whole analysis of the study.
In order to determine the percentage of phonological patterns observed in participants’ speech production, the writer needed to compute numerical data by using a simple scaling composed by Thorsten (1992 in Salma, 2013, p. 35).
P = Note:
Aisya Gusnelia, 2014
An Analysis of Phonological Featuresof Autistic Children
Universitas Pendidikan Indonesia | repository.upi.edu | perpustakaan.upi.edu
29 3.5.Example of Data Analysis
Once the phonetic transcription was complete, the further analysis then was
started. Example of the analysis of the data is exemplified in the table below.
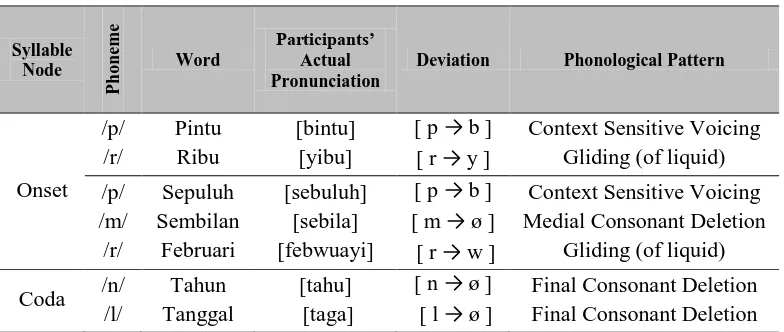
Table 3.2 Example of Data Analysis
Syllable
In order to answer the first question, the data were classified based on the
types of sound and any alternations of the target sounds were discovered. For
additional description, each of the sounds was classified into two categories in
relation to the syllable structure of their occurrences in the word: syllable-onset
and –coda positions. This decision followed the idea of conducting phonological
analysis in children proposed by Ingram & Ingram (2001). They conducted word
shape analysis (syllables) to analyze speech of children which can determine how
well children do in maintaining a number of syllables in target words. In order to
answer the second and the third questions, the phonological patterns of
participants were identified based on all the alternations observed earlier.
After the analysis was applied in all data collection, the distribution of data
which consisted of the percentages was also shown. Furthermore, the entire
analyses were given in the chapter four of this study and the rest of data
Aisya Gusnelia, 2014
An Analysis of Phonological Featuresof Autistic Children
Universitas Pendidikan Indonesia | repository.upi.edu | perpustakaan.upi.edu
30 3.6. Phonetic Symbols and Conventions
The study uses common symbols and technical terms. There are seven important
symbols that are utilized in this study. They are listed as follows:
1. Square brackets [ ] signifies sounds, such as in the pronunciation of word
‘kacang’ is represented by the phonetic realization [ka.ʧaŋ].
2. Arrow → designates change; placed between input of a rule and its output, as
in [ ŋ → n ], which means phoneme /ŋ/ changes into /n/.
3. Slash mark / designates ‘the environment’ in which change occurs.
4. Underscore ___ marks the location of the target segment within a string of
segments.
5. Boundary marker # indicates initial or final position of a segment within a
word.
6. Null Sign ø denotes deletion or omission when it follows an arrow.
7. Braces { } indicate that two rules can be collapsed into one rules; read “either/or.”
3.7.Concluding Remarks
This chapter has discussed the methodology applied in conducting this study. The
predictions, data collection, data analysis framework, and example of data
analysis have been discussed clearly. In order to answer the research questions,
further data analyses and data presentation will be developed and presented in the
Aisya Gusnelia, 2014
An Analysis of Phonological Featuresof Autistic Children
Universitas Pendidikan Indonesia | repository.upi.edu | perpustakaan.upi.edu