IMPROVEMENT EVALUATION ON CERAMIC ROOF EXTRACTION USING
W
ORLDV
IEW-2 IMAGERY AND GEOGRAPHIC DATA MINING APPROACH
V. S. Brum-Bastos a*, B. M. G. Ribeiro b, C. M. D. Pinho c, T. S. Korting d, L. M. G. Fonseca d
a
University of St. Andrews, Department of Geography and Sustainable Development, St. Andrews – Fife, United Kingdom – [email protected]
b
Federal University of Rio Grande do Sul (UFRGS), Graduate Program on Urban and Regional Planning (PROPUR) Porto Alegre – RS, Brazil – [email protected]
c
Federal University of ABC (UFABC), Engineering, Modeling and Applied Social Sciences Center (CECS), São Bernardo do Campo – SP, Brazil – [email protected]
d
National Institute for Space Research (INPE), Image Processing Division (DPI), São José dos Campos – SP, Brazil – (tkorting, leila)@dpi.inpe.br
Commission ThS15
KEY WORDS: Geographical Data Mining, GEOBIA, WorldView-2, Ceramic roof, C4.5, Decision Tree, Classification accuracy.
ABSTRACT:
Advances in geotechnologies and in remote sensing have improved analysis of urban environments. The new sensors are increasingly suited to urban studies, due to the enhancement in spatial, spectral and radiometric resolutions. Urban environments present high heterogeneity, which cannot be tackled using pixel–based approaches on high resolution images. Geographic Object– Based Image Analysis (GEOBIA) has been consolidated as a methodology for urban land use and cover monitoring; however, classification of high resolution images is still troublesome. This study aims to assess the improvement on ceramic roof classification using WorldView-2 images due to the increase of 4 new bands besides the standard “Blue-Green-Red-Near Infrared” bands. Our methodology combines GEOBIA, C4.5 classification tree algorithm, Monte Carlo simulation and statistical tests for classification accuracy. Two samples groups were considered: 1) eight multispectral and panchromatic bands, and 2) four multispectral and panchromatic bands, representing previous high-resolution sensors. The C4.5 algorithm generates a decision tree that can be used for classification; smaller decision trees are closer to the semantic networks produced by experts on GEOBIA, while bigger trees, are not straightforward to implement manually, but are more accurate. The choice for a big or small tree relies on the user’s skills to implement it. This study aims to determine for what kind of user the addition of the 4 new bands might be beneficial: 1) the common user (smaller trees) or 2) a more skilled user with coding and/or data mining abilities (bigger trees). In overall the classification was improved by the addition of the four new bands for both types of users.
* Corresponding author
1. INTRODUCTION
Novel development in remote sensing technologies have enhanced urban land use and land cover mapping over the last two decades, especially due to the availability of high– resolution images (Blaschke, 2010). The sensors aboard new satellites are increasingly suited to urban studies, due to the enhancement in spatial, spectral and radiometric resolutions (Pinho et al., 2012; Ribeiro et al., 2011). As a result, sub–metric objects have been discriminated, which widely benefits urban studies using remote sensing data. The information extracted from these products are of great importance on the development of medium and long–term investments planning, monitoring the increasing demand for infrastructure and social equipment, and supporting public policies in compliance with environmental guidelines and targeted to provide better quality of life to society.
Recent advances in geotechnologies provide resources to propose innovative strategies for urban and environmental management, including remote sensing data and computational resources for processing them, which, together, are able to generate high–quality databases and maps.
Complex urban environments present high heterogeneity, which cannot be tackled using pixel–based approaches on high resolution images. The solely use of spectral information is insufficient to describe different types of settlements due to variation in the structure, material and shape. Hence more refined image analysis methods are being successfully applied for urban studies using high spatial resolution data.
Geographic Object–Based Image Analysis (GEOBIA) has been consolidated as an efficient methodology for urban land use and land cover monitoring. However, even after continuous advances in GEOBIA, classification of high resolution images is still troublesome (Hay & Castilla, 2006). Softwares that perform GEOBIA provide a great number of attributes and different ways to model the semantic network, which make the task of classification lengthy and complex (Korting et al., 2008; Ribeiro & Fonseca, 2013). Determining the most relevant features to be used in classification routines is not always an easy task when conventional exploratory analyses are carried out (e.g., scatter plot, histograms, feature values shown in grey levels, etc.). Research concerning GEOBIA has presented innumerous advances, though some problems related to the feature selection and large amount of data are still unsolved.
Data mining tools can increase the potential for the analysis of remote sensing data (Fayyad et al., 1996) as it enables to discover useful knowledge implicit in the data and to extract patterns from large datasets (Pinho et al., 2008). Thus, the use of data mining methods for attribute selection became very attractive for urban remote sensing due to the hundreds of spectral, texture and geometric attributes that can be used in GEOBIA classification routines. Despite the wide exploration of urban land cover classification based on high resolution imagery, few studies have applied automatic methodologies to define parameters and features for object–based image classification (Bastos et al., 2013; Carvalho et al., 2012; Meneghetti & Kux, 2014; Pinho et al., 2008; Ribeiro & Fonseca, 2013), and presented satisfactory results suggesting that the use of data mining algorithms can provide high classification performance results (e.g., Carvalho et al., 2012; Ribeiro & Fonseca, 2013) and in time saving on building semantic network and on attribute selection (Bastos et al., 2013; Meneghetti & Kux, 2014; Ribeiro & Fonseca, 2013).
Until WorldView-2 launch in October 2009, high resolution images were limited to four spectral bands, which has restricted discrimination of urban targets (Pinho et al., 2011). With eight multispectral bands with 1.85 m of spatial resolution and a panchromatic band with 0.5 m (Figure 1), WorldView-2 is a first attempt to overcome this trade-off (DigitalGlobe, 2012; Ribeiro & Fonseca, 2012).
Figure 1. Spectral interval of Ikonos-2, QuickBird-2 and WorldView-2 multispectral and panchromatic bands. Source: DigitalGlobe (2009; 2012) and GeoEye (2006).
High spectral resolution, along with high spatial resolution, is particularly interesting for urban mapping, since it may assist in the classification of roof materials, such as ceramic tiles (Almeida et al., 2009; Ribeiro, 2010; Souza et al., 2009). Roof constitution acceptably indicates buildings wealth and use, which are essential pieces of information for urban planning and administration (Almeida et al., 2009; Souza et al., 2007). The differentiation between ceramic tile roofs and bare soil is a main issue, because these objects have similar spectral response but are semantically different. Ceramic roofs represent buildings while bare soil indicates an unoccupied area and non-impervious surface (Ribeiro, 2010; Ribeiro & Fonseca, 2012).
Generally, roof constitution is not easily discriminated by automatic classification in high resolution images, for example Ikonos-2 and QuickBird-2 (Leonardi, 2010; Pinho et al., 2012). However, studies indicate that WorldView-2 Yellow and Red-Edge bands help to improve roofs classification, even though not designed for it (Ribeiro, 2010; Ribeiro & Fonseca, 2012). This paper aims to assess the improvement, for different users, on the extraction of ceramic roof on WorldView-2 images due
to the 4 new bands. Our methodology combines GEOBIA, C4.5 data mining algorithm and statistical tests of classification accuracy. Two samples groups were considered: 1) eight multispectral and panchromatic bands, and 2) four multispectral and panchromatic bands, representing previous high-resolution sensors (e.g., Ikonos-2 and QuickBird-2).
2. METHODOLOGY 2.1 Materials
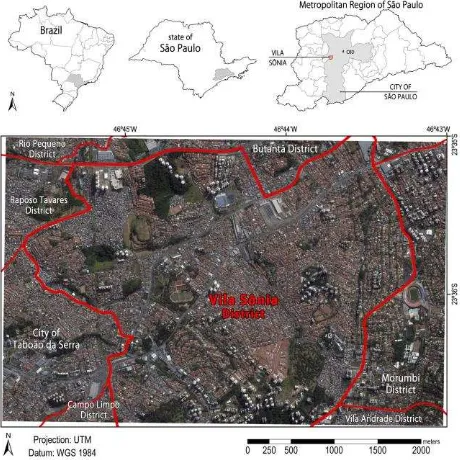
The WorldView-2 image was acquired on December 6, 2009. The 0.5-m panchromatic band and the 2.0-m multispectral bands (coastal, blue, green, yellow, red, red-edge, near-infrared 1 and 2) images are standard geometrically corrected (Standard Ortho Rectified Level 3) and have an 11-bit radiometric resolution and 22.2º off-nadir angle. The scene covers approximately 4.5 km × 3.0 km centred at Vila Sônia, an urban district located in the west fringes of the city of São Paulo, the most populated city of Brazil (Figure 2).
Vila Sônia is a peripheral district, 17 km away from São Paulo CBD (Central Business District). Its urban development dates of 1960s, due to the proximity to Morumbi District. A traditional neighbourhood, settled by Japanese immigrants, Vila Sônia counted, in 2010, 110,409 inhabitants (IBGE, 2011). In the last two decades, the occupancy pattern has been changing from middle class medium sized properties to high standard vertical buildings, mixing residential and commercial areas. The great social gap in this area is evident, with slums and high standard gated communities existing side by side.
Figure 2. Study area location. WorldView-2 image composition R(5) G(3) B(2).
2.2 Methods
The eight WorldView-2 multispectral bands were converted from Digital Numbers (DN) to apparent reflectance, according to Digital Globe guidelines. This procedure rescues spectral absorption features, favouring target discrimination, which is particularly relevant for improvements in automatic classification.
HIS (Hue, Intensity and Saturation), HSV (Hue, Saturation, Value), PC (Principal Components) and Grand Schmidt pan-sharpening were performed on the eight DN multispectral bands. According to visual analysis, Grand Schmidt pan-sharpening performed best and that is why it was the one used for the following steps. The result is a hybrid image with eight spectral bands and spatial resolution equal to 0.5 m.
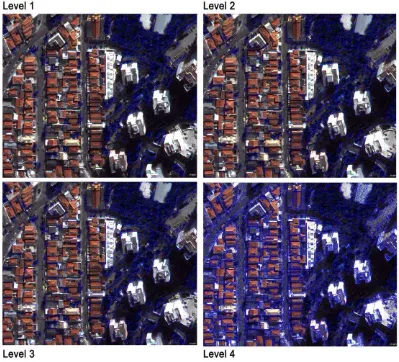
The apparent reflectance, DN numbers and sharpened bands were imported into eCognition 8.0 (Trimble Geospatial, 2011) and the multiresolution segmentation algorithm (Baatz & Schape, 2000) was applied to them, with weight 1 for the
panchromatic band and 0.5 for the others. Due to the diversity of sizes, four segmentation levels were necessary (Figure 3). The following attributes were generated for all objects: mean, standard deviation, contrast to neighbour pixels, border contrast, band ratio among all bands, minimum pixel value, maximum pixel value, mean of outer border, mean of inner border, band mean, skewness and standard deviation to neighbour pixels. We also calculated the ratios between each pair of apparent reflectance band, because it highlights spectral signatures (Schowengerdt, 2007) what may had increase discrimination between classes.
Figure 3. Multiresolution segmentation levels.
We manually collected 1406 samples across the intra-urban land cover classes: BRIGHT OBJECTS (44),TREES (268),ASPHALT (165),LIGHT CERAMIC ROOF (71),DARK CERAMIC ROOF (182), METALLIC ROOF (87), LIGHT CEMENT MATERIAL/OBJECTS (56), DARK CEMENT MATERIAL (81), SWIMMING POOL (45),GRASS AND SHRUBS (127),LIGHT BARE SOIL (49),DARK BARE SOIL (67)and SHADOW (164).The land cover classes were defined considering their occurrence in the study area. For this reason, shadow class had to be considered due to the image characteristics, once it was acquired at offnadir and after 12:00 am, which causes shadows cast by elevated urban objects, particularly buildings. This is a limitation on the use of high spatial resolution images acquired over dense urban areas.
These shaded areas are usually left unclassified or simply classified as shadows, resulting in a significant loss of land features information. GEOBIA is one possible approach to overcome this problem, through the use of algorithms that consider not only the spectral information but also several other image object features, such as adjacency relations, spatial information, shape, texture and spatial context for the classification of shaded areas in this kind of images (e.g., Pinho et al., 2012; Zhou & Troy, 2008; Zhou et al., 2009). In this case, due to the large dimensions of the shadows, covering large areas in the scene, we preferred to define them as an independent class.
Two sample sets were generated: the first with 300 attributes derived from the eight WorldView-2 bands, and the second with
200 attributes derived from Blue, Green, Red and NIR 1 WorldView-2 bands.
We applied the C4.5 algorithm (Quinlan, 1993) to both sample sets; this algorithm generates a decision tree that can be used for classification. The C4.5 decision tree algorithm works in the following way: each node of the decision tree matches an attribute and each arc matches a value range of that attribute. The expected attribute value is defined by the path from the root to each leaf. The most representative attribute is associated with each node. The entropy is calculated to assess how informative a node is. The larger the entropy, the more information is necessary to characterize the data. The goal is to associate with a node the attribute that minimizes the data entropy (Silva et al., 2008).
After associating the attribute with a node, the decision tree algorithm defines a threshold value for each arc. The threshold is computed by nearest neighbour algorithm. Firstly, the algorithm calculates the Euclidian Distance from the training samples to an instance of the data. The instance will be assigned to the class that is closest to it in the space of attributes (Witten & Frank, 1999). The C4.5 algorithm removes unnecessary nodes through the pruning procedure, producing the shortest tree possible (Witten & Frank, 1999). The number of instances in each leaf also controls the size of the tree. The lower the number of instances, the more precise the classification for the training set is.
The minimum number of objects per leaf (MOL) is a parameter of C4.5 that defines the pruning and the final number of leaves of the tree. Therefore, it has substantial influence on the classification accuracy. In addition, high MOL values produce classification trees with less leaves, i.e., smaller trees, which are closer to the semantic networks produced by experts on GEOBIA software for manual classification; while small MOL values produce trees with more leaves, i.e., bigger trees that are not straightforward to implement manually but are more accurate. The choice for a big or small tree relies on the user’s skills to make the implementation, so a variable MOL will allow us to specify for what kind of user the addition of the four new bands might be beneficial: 1) the common user (smaller trees) or 2) a more skilled user with coding and/or data mining abilities (bigger trees).
Using a Monte Carlo simulation we performed 100 interactions for each MOL value ranging from 1 to 100; for each interaction a new subsample set was randomly selected for both sample sets. The confusion matrix was calculated for each iteration, using stratified cross-validation, where 50% of the samples were used for training and 50% for testing. Based on the confusion matrix, the Kappa index (Cohen, 1960) and the user’s accuracy were calculated for each iteration and MOL value for the classes LIGHT CERAMIC and DARK CERAMIC (Story & Congalton, 1986; Foody, 2002).
The overall Kappa values and user’s accuracies for each MOL value, from the sample sets with eight band and four bands, were submitted to the one tailed independent two-sample t-test for equal sample sizes and variances. The t-test was based on the following hypothesis.
H0: μ8bands= μ4bands
H1: μ8bands >μ4bands
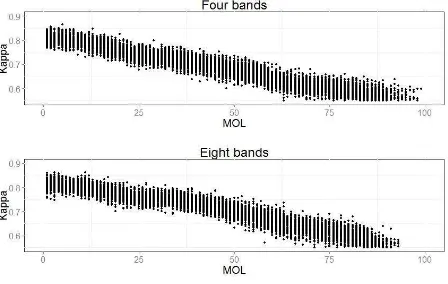
Where μ8bands is the average Kappa, LIGHT CERAMIC user’s accuracy or DARK CERAMICuser’s accuracy for the eight bands sample set and μ4bands is the average Kappa, LIGHT CERAMIC possible to visually distinguish which sample set performed best, because Kappa ranges for each MOL were almost the same for the four bands and eight bands (Figure 4). The decrease in Kappa was expected, once a bigger MOL creates a more generalized classification tree, i.e., it is more likely that pixels from different classes will be allocated in the same class.
Figure 4. Kappa × MOL for each iteration.
User’s accuracies for LIGHT CERAMIC were not really sensitive to MOL value until 25 MOL for four bands, while this interval extends to 50 MOL for eight bands (Figure 5). Although this sensitiveness could be explained by the low number of samples available for this class, the difference between the sensitiveness thresholds indicates a potential improvement on the classification when using eight bands. The more frequent low user’s accuracies for bigger MOL values were expected and can be explained by the same reason as the decrease in Kappa values.
User’s accuracies for DARK CERAMIC decreased for both samples sets for MOL values between 35 and 50 for both sample sets more detailed analysis of all confusion matrices, for each MOL interval, is needed in order to confirm this. We expected more frequent low user’s accuracies for bigger MOL, however this was not a prominent trend for this class, independent of sample set group. This could be explained by the low presence of dark bare soil and the DARK CERAMIC singular spectral features in the red interval, which improves the distinction to soil and LIGHT CERAMIC for both sample sets and independent of the size of the classification tree.
Figure 5. LIGHT CERAMIC user’s accuracy × MOL for each iteration.
Figure 6. DARK CERAMICuser’s accuracy × MOL for each iteration.
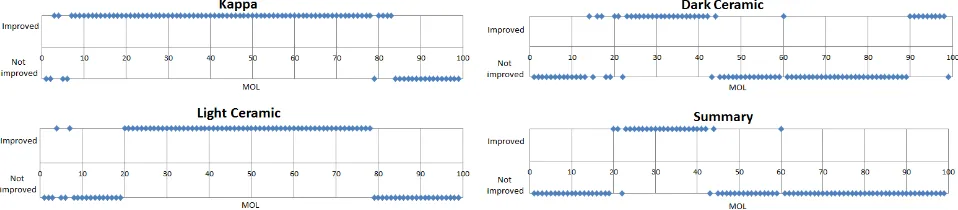
The p-values from t-test indicated, at 95% confidence level, that in average the improvement, due to the addition of the four new bands, is significant only for some MOL intervals for all evaluated indices (Figure 7). The Kappa showed the most extensive improvement ranging from 7 to 79 MOL, which indicates that indeed in overall the classification is improved by the addition of the four new bands for both type of users. However, for the DARK CERAMIC the user’s accuracy improvement ranges from 22 to 43 MOL and for the LIGHT CERAMICthe user’s accuracy improvement ranges from 20 to 79 MOL, that are MOL intervals more related more related to smaller trees and consequentially to user type 1. The improvement on DARK CERAMIC between 90 and 98 was ignored, because although the user’s accuracy can be high for this class in this interval (Figure 6), the Kappa is extremely low
for the same interval (Figure 4), i.e., it would be suitable only for a classification with a single class, what is extremely uncommon.
The Summary graph (Figure 7) shows that between 23 and 42 MOL there is significant improvement in the overall classification (Kappa) and specifically for LIGHT and DARK CERAMIC, i.e., this would be the optimum interval for the use of the new four bands with a significant improvement in the classification. However, as smaller MOL values result in better Kappa values, the lowest possible MOL should be used; for example for MOL=23 the averaged overall Kappa is 0.75. In addition, considering that users type 2 are more inclined towards trees with smaller MOL then 20, the four new bands might be more relevant to users type 1.
Figure 7. Classification performance × MOL according to t-test (p-value= 0.05)
4. CONCLUSIONS
For this study, in overall the classification was improved by the addition of the four new bands for both types of users. However, for DARK CERAMIC and LIGHT CERAMIC extraction the improvement is related to smaller trees and consequentially to user type 1 only.
Although this is a preliminary study, it brings to light some important issues regarding the imagery choice for urban classification; mainly taking into account that the acquisition of an image with eight multispectral bands can cost twice as much as an equivalent four-band image (reference date: June, 2015). At the image purchase it is important to consider who will be manipulating this material, once it is less likely that an user type 2 will benefit from the new bands, i.e., that would be a loss of
resources. However, for an user type 1 this can improve the quality of the final map.
We are aware that the continuous development on high resolution satellites have been improving mapping for urban areas; however this improvements must not put a break on the development of methodologies focused on, for example, making the implementation of long trees feasible for any user. There is a mismatch between the information these images can provide us and what we actually can extract from them, that is why it is important to constantly evaluate this cost-benefit relationship and work to spread the more complex GEOBIA techniques in the most straightforward way possible.
In addition, the problem of dimensionality or U-shaped curve behaviour has been often noted in the literature (Bellman,
1961). It was observed that the addition of attributes may sometimes not improve or even decrease the classification quality, mainly if the number of training samples is small compared to the number of attributes. The use of many attributes to classify a dataset can unnecessarily complicate the models and violates the principle of parsimony. According to this principle, always when possible, a smaller number of variables should be considered, so that the model can be more easily interpreted.
GEOBIA community is in a moment where the focus must be to improve our extraction methodologies to catch up with the satellites technologies available, mainly regarding segmentation, which is still a controversial topic within GEOBIA. This study is not exhaustive and to assess other intra and inter classes’ Counsel of Technological and Scientific Development) and SWB (Science Without Borders) - CAPES (Coordination for the Improvement of Higher Education Personnel) for the financial support during the development of this study, through first and second author’s PhD scholarships; Digital Globe for kindly supplying the WorldView-2 imagery used in the present research; and the researcher MSc. Bożena Wielgoszewska for the fruitful discussions on statistic methods.
REFERENCES
Almeida, C. M.; Souza, I. M. E.; Alves, C. M. D. de; Pinho, C. M. D.; Feitosa, R. Q., 2009. Métodos cognitivos de classificação aplicados a imagens QuickBird para a detecção de áreas residenciais homogêneas (Cognitive Approaches for the Classification of QuickBird Images Applied to the Extraction of Homogeneous Residential Zones). Revista Brasileira de Cartografia, 61 (1), pp. 1-12.
Baatz, M., Schape, A., 2000. Multiresolution segmentation: an optimization approach for high quality multi–scale image segmentation. In: XII AGIT Symposium, Salzburg, Austria, 2000, pp. 12-23. tour. Princeton University Press, Princeton, NJ, USA, 1961.
Blaschke, T., 2010. Object based image analysis for remote sensing. ISPRS Journal of Photogrammetry & Remote Sensing, 65(1), pp. 2-16. DOI: 10.1016/j.isprsjprs.2009.06.004.
Carvalho, M.; Kux, H. J. H.; Florenzano, T., 2012. Urban land cover classification with WorldView–2 images using data mining and Object–Based Image Analysis. In: 4th GEOBIA – International Conference on Geographic Object-Based Image Analysis, Rio de Janeiro, Brazil, pp. 431-436.
Cohen, J., 1960. A coefficient of agreement for nominal scales.
Educational and Psychological Measurement, 20, pp. 37-46. DOI: 10.1177/001316446002000104.
Congalton, R. G., 1991. A Review of Assessing the Accuracy of Classifications of Remotely Sensed Data. Remote Sensing of Environment, 37(1), pp. 35-46. DOI: 10.1016/0034-4257(91)90048-B.
Congalton, R. G.; Green, G. K., 1999. Assessing the Accuracy of Remotely Sensed Data: Principles and Practices. Boca Raton, USA, CRC/Lewis Press.
DigitalGlobe, 2009. QuickBird Data Sheet. DS-QB Rev 12/09. Available at: <http://global.digitalglobe.com/sites/default/files/ QuickBird-DS-QB-Prod.pdf >
DigitalGlobe, 2012. WorldView-2 Data Sheet. DS-QB Rev 6/12. Available at: <http://www.spaceimagingme.com/downloa ds/sensors/datasheets/WorldView2-DS-WV2-Web.pdf >
Fayyad, U.; Piatetsky–Shapiro, G.; Smyth, P., 1996. From data mining to knowledge discovery in databases. American Association for Artificial Intelligence Magazine, 17(3) pp. 37-54. DOI: 10.1609/aimag.v17i3.1230.
Fleiss, J. L.; Cohen, J.; Everitt, B. S., 1969. Large sample standard errors of kappa and weighted kappa. Psychological Bulletin, 72(5), pp. 323-327. DOI: 10.1037/h0028106.
Foody, G. M., 2004. Thematic Map Comparison: Evaluating the Statistical Significance of Differences in Classification Accuracy. Photogrammetric Engineering & Remote Sensing, 70(5), pp. 627-633.
Foody, G. M, 2002. Status of land cover classification accuracy assessment. Remote Sensing of Environment, 80(1), pp. 185-Strengths, Weaknesses, Opportunities and Threats (SWOT). In:
OBIA, 2006: The International Archives of the Photogrammetry, Remote Sensing and Spatial Information Sciences, Salzburg, Austria, Vol. XXXVI-4/C42, pp. 1-3.
IBGE – Brazilian Institute of Geography and Statistics, 2011.
2010 Population Census: Universe results by enumeration area - Characteristics of the population and households. Rev.
Leonardi, F., 2010. Abordagens Cognitivas e Mineração de Dados aplicadas a Dados Ópticos Obitais e de Laser para a Classificação de Cobertura do Solo Urbano (Cognitive Approaches and Data Mining Applied to Orbital Optical and Laser Scanning Data for the Classification of Urban Land Cover). 2010. Master thesis, Remote Sensing, National Institute for Space Research (INPE), São José dos Campos, Brazil. INPE–16708–TDI/1648.
Mas, J.-F.; Pérez-Vega, A.; Ghilardi, A.; Martínez, S.; Loya-Carrillo, J. O.; Vega, E., 2014. A Suite of Tools for Assessing Thematic Map Accuracy. Geography Journal, 2014, Article ID 372349, 10 p. DOI : 10.1155/2014/372349.
Meneghetti, G. T.; Kux H. J. H., 2014. Land cover mapping of Raposa (MA) municipality using WorldView–II images, the InterIMAGE system and data mining. Revista Brasileira de Cartografia, 66 (2), pp. 365-377.
Pinho, C. M. D. de; Fonseca, L. M. G.; Korting, T. S.; Almeida, C. M.; Kux, H. J. H., 2012. Land-cover classification of an intra-urban environment using high-resolution images and object-based image analysis. International Journal of Remote Sensing, 33(19), pp. 5973-5995. DOI: 10.1080/01431161.2012.675451.
Pinho, C. M. D. de; Ummus, M. E.; Novack, T., 2011. Extração de feições urbanas em imagens de alta resolução espacial a partir do estudo do comportamento espectral dos alvos (Extraction of Urban Features from High Resolution Imagery Based on Analysis of the Targets Spectral Profiles). Revista Brasileira de Cartografia, 63(4), pp. 439-448.
Pinho, C. M. D. de; Silva, F. C.; Fonseca, L. M. G.; Monteiro, A. M. V., 2008. Intra–urban land cover classification from high–resolution images using the C4.5 algorithm. In: XXI Congress of ISPRS, Beijing, China, 2008, pp. 695-700.
Quinlan, J. R., 1993. C4.5: Programs for Machine Learning. Morgan Kaufmann Publishers.
Ribeiro, B. M. G., 2010. Avaliação das imagens WorldView–II para o mapeamento da cobertura do solo urbano utilizando o sistema InterIMAGE (Evaluation of WorldView–II imagery for urban land cover mapping using the InterIMAGE system). Master thesis, Remote Sensing, National Institute for Space Research (INPE), São José dos Campos, Brazil. INPE–16761– TDI/1689.
Ribeiro, B. M. G.; Fonseca, L. M. G. 2012.Evaluation of WorldView-2 Imagery for Urban Land Cover Mapping Using the InterIMAGE System. In: 4th GEOBIA – International Conference on Geographic Object-Based Image Analysis, Rio de Janeiro, Brazil, pp. 206-210.
Ribeiro, B. M. G.; Fonseca, L. M. G., 2013. Urban land cover classification using WorldView–2 images and C4.5 algorithm. In: JURSE – Joint Urban Remote Sensing Event, São Paulo, Brazil, pp. 250-253. DOI: 10.1109/JURSE.2013.6550712.
Ribeiro, B. M. G.; Fonseca, L. M. G.; Kux, H. J. H., 2011. Mapeamento da cobertura do solo urbano utilizando imagens WorldView-II e o sistema InterIMAGE. (Urban land cover mapping using WorldView-II images and the InterIMAGE system). Revista Brasileira de Cartografia, 63(Special Edition), pp. 51-63.
Rosenfield, G. H., Fitzpatrick–Lins, K., 1986. A coefficient of agreement as a measure of thematic classification accuracy.
Photogrammetric Engineering & Remote Sensing, 52(2), pp. 223-227.
Rossiter, D. G., 2014. Technical Note: Statistical methods for accuracy assessment of classified thematic maps. University of Twente, Enschede, Netherlands.
Schowengerdt, R. A., 2007. Remote sensing: models and methods for image processing. 3rd ed. Academic Press, San Diego, USA.
Souza, I. M. E.; Alves, C. D.; Almeida, C. M.; Pinho, C. M. D. de, 2007. Caracterização socioeconômica do espaço residencial construído utilizando imagens de alta resolução espacial e análise orientada a objeto (Socio-economic Assessment of Residential Areas Using High Spatial Resolution Images and Object-Based Analysis). Geografia, 16, p. 119-142.
Souza, I. M. E.; Alves, C. D.; Almeida, C. M.; Pinho, C. M. D. de, 2009. Uso de imagens de alta resolução espacial e análise orientada a objeto para caracterização socioeconômica do espaço residencial construído (High Spatial Resolution Images and Object-Based Image Analysis for the Socio-economic Characterization of Residential Areas). In: XIV SBSR - Brazilian Symposium on Remote Sensing, São José dos Campos, Brazil, p. 875-882.
Story, M.; Congalton, R. G., 1986. Accuracy assessment: a user's perspective. Photogrammetric Engineering & Remote Sensing, 52(3), pp. 397-399.
Trimble Geospatial, 2011. eCognition Developer 8.0. Sunnyvale, CA, USA. learning tools and techniques with java implementations. Morgan Kaufman, San Francisco, USA.
Zhou W.; Troy A., 2008. An object-oriented approach for analysing and characterizing urban landscape at the parcel level.
International Journal of Remote Sensing, 29(11), pp. 3119-3135. DOI: 10.1080/01431160701469065.
Zhou W.; Huang G.; Troy A.; Cadenasso M. L., 2009. Object-based land cover classification of shaded areas in high spatial resolution imagery of urban areas: a comparison study. Remote Sensinfg of the Environment, 113(8), pp.1769-1777. DOI: 10.1016/j.rse.2009.04.007.