COMPARISON OF PIXEL-BASED AND OBJECT-ORIENTED LAND COVER CHANGE
DETECTION METHODS
Zhenlei Xie a, Ruoming Shi a, Ling Zhu a, *, ShuPeng b, Xu Chen a
a
School of Geomatics and Urban Information, Beijing University of Civil Engineering and Architecture, Beijing, China [email protected]
b
National Geomatics Centre of China, Beijing, China - [email protected]
KEY WORDS: Land Cover, Change Detection, Pixel-based, Segmentation scale, Object-oriented, 30m resolution
ABSTRACT:
Change detection method is an efficient way in the aim of land cover product updating on the basis of the existing products, and at the same time saving lots of cost and time. Considering the object-oriented change detection method for 30m resolution Landsat image, analysis of effect of different segmentation scales on the method of the object-oriented is firstly carried out. On the other hand, for analysing the effectiveness and availability of pixel-based change method, the two indices which complement each other are the differenced Normalized Difference Vegetation Index (dNDVI), the Change Vector (CV) were used. To demonstrate the performance of pixel-based and object-oriented, accuracy assessment of these two change detection results will be conducted by four indicators which include overall accuracy, omission error, commission error and Kappa coefficient.
* Corresponding author
1. INTRODUCTION
Detecting regions of change in images of the same scene taken at different times is of widespread interest due to a large number of applications in diverse disciplines (Richard, 2014a). Land use and land cover change are the key issues in the study of global environmental change and sustainable development. Change detection is also a hot issue in geographic condition monitoring. Change detection is the approach that apply a variety of methods of image processing and pattern recognition to multi-temporal remote sensing image in the aim of extracting change information and quantitative analysis of land surface's change characteristics and process (Yingshi, 2003). Change detection algorithms of remote sensing image can be divided into two categories: pixel-based and object-oriented, according to the minimum processing unit (Zhenjian, 2014a).
Considering large range of Land cover products, such as Globe Land30 of China, or the National Land Cover Database (NLCD) of U.S are made on the basis of 30m resolution image, we concentrate on discussing the application of object-oriented change detection method in the medium resolution remote sensing image in this paper by comparing the change detection accuracy of pixel-based with accuracy of object-oriented.
2. PIXEL-BASED CHANGE DETECTION METHODS An image pixel is the atomic analytical unit in these techniques whose spectral characteristics are exploited to detect and measure changes mostly without considering the spatial context (Masroor, 2013a). Most often statistical operators are used for evaluating the individual pixel. The change detection methods of pixel-based have been developed including: (a) image differencing, (b) image rationing, (c) regression analysis, (d) vegetation index differencing, (e) change vector analysis (CVA), (f) principal component analysis (PCA), and (g) tasselled cap transformation (KT).
Considering the characteristic of different methods, we chose the differenced Normalized Difference Vegetation Index (dNDVI) and the Change Vector (CV) that NLCD used to
update 2011version products (Suming, 2013a) as features for Change detection based pixel.
(1)
∑ (2)
Where denotes the ith band of the early data Landsat image, means the ith band of the late data Landsat image.
The CV captures the absolute value of total spectral change between two dates (Suming, 2013a) and likely provides the detailed change information. While CV is easily affected by terrain, atmosphere and phenology, so mountains of false change would like arise. Given that dNDVI is less sensitive to topographic and radiometric effects than individual bands because it is ratio of spectral bands (Suming, 2013a), so we combined this two features to conduct detection.
3. CHANGE DETECTION METHOD OF OBJECT-ORIENTED
Object-oriented method came up with high resolution remote sensing images, which is on the basis of image segmentation technology and is less sensitive to noise and pre-processing. Not only can this method use spectral and texture information of image, but also it can utilize space information (shape, size and location) of image (Yuan, 2015a), that is why it is getting more and more attention.
According to the approach of obtaining the object of different phase images, the existing object-oriented methods can be divided into three approaches (Masroor, 2013a): (a) direct object comparison based, (b) object classification comparison based, (c) multi-temporal object change detection. By stacking bi-temporal images, multi-temporal object change detection can obtain image objects that have same geometric properties at two times and exploit the geometrical, spectral, and derived features to create change trajectories (Masroor, 2013a). So it has been The International Archives of the Photogrammetry, Remote Sensing and Spatial Information Sciences, Volume XLI-B7, 2016
widely used. The emergence of commercial software represented by eCognition has greatly facilitated the application of the object-oriented method.
3.1 Principle of multi-resolution segmentation
The multi-resolution segmentation algorithm of eCognition software is a bottom-up algorithm and consecutively merges pixels or existing image objects according to the mutual-best-fitting approach (Baatz, 2002).
Essentially, the procedure identifies singe image object of pixel in size and merges them with their neighbours, based on relative homogeneity criteria. This homogeneity criterion is a combination of spectral and shape criteria. In this circumstance, homogeneity is used as a synonym for minimized heterogeneity
( ) (Yuqi, 2013).
(3)
Where represents weight of spectral heterogeneity, means weight of shape heterogeneity. Growth of spectral heterogeneity and shape heterogeneity is respectively defined as:
∑ [ ( )] (4)
( ) (5)
Where and represent the number of pixels in each of the first two neighbouring objects, and means standard deviation of spectral features of two objects. represents the number of pixels containedin the object obtained by merging the neighbouring object, means standard deviation of spectral heterogeneity of object obtained by merging the neighbouring object, represents the heterogeneity weight of band k ∑ , m represents the number of band in image.
The shape heterogeneity is composed of compactness and smoothness, means weight of compactness and ( ) weight of smoothness. Growth of compactness heterogeneity and smoothness heterogeneity is respectively defined as:
√
(
√
√ ) (6)
(7)
Where and represent the perimeter of the two objects before merging. and respectively mean the perimeter of minimum inscribed rectangular of the two objects before merging. represents the perimeter of the merged object, means the perimeter of minimum inscribed rectangular of merged objects.
When the heterogeneity growth measure of the two neighbouring objects is completed, then it can decide whether or not the two objects will be merged by comparing growth value with the scale parameter.
3.2 Analysis of object-oriented method in 30m resolution Landsat image
For the multi-resolution segmentation of eCognition software which has been widely used, the key point in the application is the determination of optimal segmentation scale for different
kinds of land cover. Compared to high resolution images, 30m resolution Landsat image owns rough spectral information, blurred boundaries between different objects and a large number of mixed pixels.
Given that multi-temporal object change detection stacks bi-temporal images, object integrity is affected, so the optimal segmentation scale is more difficult to determine. Therefore, in the process of object-oriented change detection for 30m resolution image, we adopt the approach of over-segmentation for the multi-temporal object change detection, which means that we use smaller scale for all kinds of classed of Land cover instead of the optimal segmentation scale for each kind of class. This will cause less impact on land cover type which owns better internal homogeneity, while for the land cover type with poor internal homogeneity, it will be broke into several smaller objects which are still able to reflect the advantages of the object. By several experiments, we determined that scale parameter is 30.
4. CHANGE DETECTION EXPERIMENT AND ANALYSIS
4.1 Study area, data and pre-processing
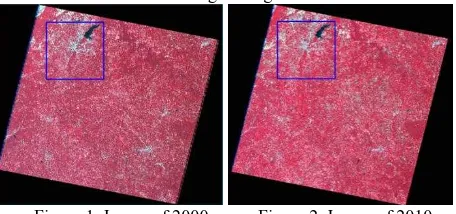
In this paper, we showcase one Landsat path/row (p122r038) is located in Mississippi, USA. The Landsat image pair was acquired on 2000/09/17 (Figure 1) vs. 2010/09/05 (Figure 2) to reduce the seasonal and phonological change. From 2000 year to 2010 year, the major urban layout and the distribution of land cover type have no significant change in this region. However, the small scale change of land cover is still obvious due to human activity. Through the analysis of the study area, the change land cover should be small scale of scattered distribution and there is no reason that large change scale will arise.
Figure 1. Image of 2000 Figure 2. Image of 2010 The Landsat images are pre-processed with geometric correction and radiometric correction. After Landsat images were pre-processed, we subset a study area whose area is 1024 by1024 pixel and downtown of Jackson city is included in this area. To conduct the change detection method of pixel-based and object-oriented, we chose dNDVI and CV as feature to extract change region from the image in this paper. 220 change sample units (3by 3 Landsat pixel kernel) and 190 unchanged sample units were randomly drawn from study area and used to assess the quality of the change detection results in the error matrix.
4.2 Change detection results of pixel-based method 4.2.1 Result used dNDVI as Feature: Through experiment used dNDVI as the feature, the overall accuracy and Kappa coefficient reach the maximum value when threshold of dNDVI was set as (where and respectively mean the average value and standard deviation of all pixels in the study area), which denotes that the pixel whose dNDVI value is greater than or less than should be considered as changed region, while the other pixels were divided into unchanged region.
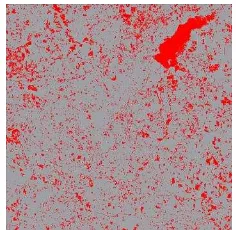
Figure 3. Change detection result of pixel-base method with dNDVI
As can be seen from Figure 3, the red and blue parts indicate the detected changes, while grey parts represent the unchanged section. The result of change detection is consistent with the actual changed type in the Jackson and its surrounding area which is dispersed and scattered as small area, in addition to the large red area in the upper right corner that is displayed as changed area. By comparing the images of 2000/09/17 and 2010/09/05, the large changed area in the upper right corner was actually found to be water body which no large changes occurred in the two phases of image.
Reference Image
U
ser
im
ag
e
Changed pixel
Unchanged
pixel sum user
Comm-ission Changed
pixel 1686 271 1957 0.86 0.14
Unchanged
pixel 294 1439 1733 0.83 0.17
Sum 1980 1710 3690 - -
producer 0.85 0.84 - - -
omission 0.15 0.16 - - -
Overall accuracy is 0.85.
Kappa coefficient is 0.69.
Table 4. Error matrix of pixel-base method with dNDVI 4.2.2 Result used CV as Feature: Through experiment used CV as the feature, the overall accuracy and Kappa coefficient reach the maximum value when threshold of CV was set as , which denotes that the pixel whose CV value is greater than should be considered as changed region, while the other pixel was divided into unchanged region.
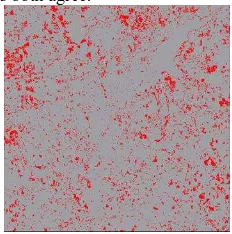
Figure 5. Change detection result of pixel-base method with CV
As shown in the Figure 5, the red parts indicate the detected changes, while grey parts represent the unchanged section. It can be clearly seen from the Figure 5 that more sections in the image were detected as changed area than Figure 3, and there is no obvious aggregation region. Taking into account that CV apply all the bands to conduct change detection, so there may be lots of false changes arising. Compared with results of dNDVI, spurious change of large water body in the up right corner had been eliminated from change detection result.
Reference Image
U
ser
im
ag
e
Changed pixel
Unchanged
pixel sum user
Comm-ission Changed
pixel 1908 399 2307 0.83 0.17
Unchanged
pixel 72 1311 1383 0.95 0.05
Sum 1980 1710 3690 - -
producer 0.96 0.77 - - -
omission 0.04 0.23 - - -
Overall accuracy is 0.87
Kappa coefficient is 0.74
Table 6. Error matrix of pixel-base method with CV As can be seen from the table 6, when the threshold of CV was set as , excessive pixel was considered into changed part, which is corresponding to the qualitative analysis of results and is the main reason for decreasing the overall accuracy and Kappa coefficient.
4.2.3 Comprehensive analysis of pixel-based method of combined dNDVI with CV: From the change detection results of dNDVI and CV can be seen, although the overall accuracy and Kappa coefficient of result of CV is slightly higher than the result of dNDVI, there is no much difference. To improve confidence of change detection result and reduce spurious change from single feature, intersection operation was applied to the results of pixel-based method of dNDVI and CV, which counts a pixel as a change when two results both agree.
Figure 7. Change detection result of pixel-based method combined dNDVI with CV
As shown in the Figure 7, the red parts indicate the detected changes, while grey parts represent the unchanged section. The pixel should be considered into changed part when both twoconditions were met at the same time: (1) whose dNDVI value is greater than or less than ; (2) whose CV value is greater than .
Number of changed pixel dNDVI CV
dNDVI 732987 578948
CV 931753
Table 8. Numberof changed pixel
Reference Image
Table 9. Error matrix of Change detection result of pixel-based method combined dNDVI with CV
4.3 Change detection results of object-oriented method Comparing to the pixel-based method, multi-temporal object change detection directly apply multi-resolution segmentation algorithm to stacked multi-temporal images to produce spatially corresponding objects (Masroor, 2013a). Therefore homogeneous segmented object is the basic unit to conduct
Figure 10. Change detection result of object-oriented method with dNDVI
Table 11. Error matrix of object-oriented method with dNDVI As shown in the Figure 10, the distribution of the detected changes (red area) is similar to result of the pixel-based method with dNDVI. Considering that pixel has been merged into homogeneous object before the process of change detection, the
result shown in the Figure 10 is on the basis of segmented object and tends to avoid the appearance of the scattered pixels, at the same time it reflects the local characteristics of the object. As can be seen from Table 11, the overall accuracy of object-oriented method with dNDVI reaches 0.90 and Kappa coefficient is 0.81. There are total 1980 pixels contained in 220 changed samples, 1850 of which pixels located in the change area, therefore producer accuracy of changed pixel is 0.93; And 130 of 1980 pixels distributed in the unchanged region, the omission error of unchanged pixel reached 0.07. In 190 unchanged samples, 1484 of 1710 pixels located in the unchanged object, the producer accuracy of unchanged pixel is 0.87, and the omission of unchanged pixel is 0.13.
As can be seen from the above analysis, compared to the change detection result of pixel-based method, the accuracy of result of object-oriented with dNDVI has been significantly improved, in which the overall accuracy and the Kappa coefficient has increased about 10%. The analysis and comparison of segmented object is more easily, it is easier to correspond with the actual object and can use the spatial information to judge the type of Land cover.
4.3.2 Result used CV as feature: The overall accuracy and Kappa coefficient reach the maximum value when threshold of CV was set as . From the Figure 12 can be seen, the changed region has significantly reduced with respect to the change detection result of pixel-based with CV.
Figure 12. Change detection result of object-oriented method with CV
Table 13. Error matrix of object-oriented method with CV As can be seen from Table 13, the overall accuracy of object-oriented method with CV reaches 0.90 and Kappa coefficient is 0.79. When the object-oriented method with CV used μ as the threshold, the distribution trend of the detected change (red parts in Figure 12) is still the same as pixel-based method, and detected area is obviously reduced, also the overall accuracy and Kappa coefficient increased about 5%.
4.3.3 Comprehensive analysis of object-oriented method of combined dNDVI with CV: The same intersection operation will be applied to the results of object-oriented method of dNDVI and CV, which counts a object as a change when two results both agree.
Figure 14. Change detection result of object-oriented method combined dNDVI with CV
As shown in the Figure 14, Change detection result of object-oriented method combined dNDVI with CV embodies the characteristic of two indices, which excludes the false change of water bodies in the upper right corner and false changes of CV was restriction for the further.
dNDVI CV
dNDVI 26020 19770
CV - 26996
Table 15. Number of changed object
dNDVI CV
dNDVI 631837 429833
CV - 564244
Table 16. Number of changed pixel
Reference Image
U
ser
im
ag
e
Changed pixel
Unchanged
pixel sum user
Comm-ission Changed
pixel 1763 150 1913 0.92 0.08
Unchanged
pixel 217 1560 1777 0.88 0.12
Sum 1980 1710 3690 - -
producer 0.89 0.91 - - -
omission 0.11 0.09 - - -
Overall accuracy=0.90
Kappa=0.80
Table 17. Error matrix of Change detection result of object-oriented method combined dNDVI with CV
From the error matrix of Table 17, compared with result of single feature, the overall accuracy and Kappa coefficient have not significantly improved, which is similar to the change detection result of pixel-based method.
Comparing Figure 7 and Figure 14, result of object-oriented method presents a more regional distribution of changed area, given that homogeneous object is taken as the unit in the process of change detection. From accuracy evaluated results (shown in table 9 and table 17), object-oriented method got a better accuracy than pixel-based method. From quantitative and qualitative analysis, it shows that it is feasible to use object-oriented method in the process of change detection for 30m resolution.
5. CONCLUSION
Based on the data source of the large range land cover product, this paper respectively carries out change detection of pixel-based and object-oriented method for the 30m resolution Landsat image by using the same indices. The results demonstrate that object-oriented method has a good feasibility on the 30m resolution Landsat image, which improve both the accuracy of change detection and regional distribution.
Using two different indices to conduct the process of change detection at the same time, on the one hand, it can eliminated some kinds of spurious change and makes the changed area with high confidence. On the other hand, this approach will contained advantage of single feature and cause commission error. Therefore, according to study area of different land cover type, we should combine multi-indices to improve the confidence of change detection result and try our best to take advantage of characteristic of different index to avoid commission error. Moreover, we only chose one pair image from same month in this paper which is not enough to avoid false changes caused by phenology or seasonal changes. For some area, it is a good idea for improving accuracy by using two pair images from different season.
REFERENCES
Baatz, M., 2002, Multiresolution segmentation: an optimization approach for high quality multi-scale image segmentation. http://www.ecognition.cc/download/baatz_schaepe.pdf.
Masroor, H., 2013a. Change detection from remotely sensed images: From pixel-based to object-based approaches. ISPRS Journal of Photogrammetry and Remote Sensing, 80,pp. 90-106.
Min, Y., 2015a. Change detection from high-resolution remotely sensed images based on cosegmentation. Journal of Nanjing University, 51(5), pp. 1039-1048.
Niemeyer, I., 2008a. Change detection using object feature. In: Blaschke, T., Object-based image analysis: Spatial Concepts for knowledge-driven remote sensing applications, springer, Heidelberg, Berlin, pp. 185-201.
Richard, R., 2014a. Image change detection algorithm: a systematic survey. IEEE Transactions on Image Processing, 14(3), pp. 294-307.
Suming, J., 2013a. A comprehensive change detection method for updating the National Land Cover Database to circa 2011.Remote Sensing of Environment, 132, pp. 159-175.
Yingshi, Z., 2003a. Remote Sensing Analysis Principles and Methods. Science Press, Beijing.
Yuqi, T., 2013. Object-oriented change detection with multi-feature in urban high-resolution remote sensing imagery. Wuhan University, Wuhan, China.
Zhenjian, Z., 2014a. Change detection of remote sensing images based on multi-scale segmentation and decision tree algorithm over mountainous area: a case study in Panxi region, Sichuan Province. Acta Ecologica Sinica, 34(24), pp. 7222-7232. The International Archives of the Photogrammetry, Remote Sensing and Spatial Information Sciences, Volume XLI-B7, 2016