OBSTACLE CHARACTERIZATION IN A GEOCROWDSOURCED ACCESSIBILITY
SYSTEM
Han Qina, Ahmad O. Aburizaizaa,b, Rebecca M. Ricea, Fabiana Paeza, Matthew T. Ricea
aDepartment of Geography and Geoinformation Science, George Mason University, Fairfax, VA (hqin, aaburiza, rrice7, fpaez, rice)@gmu.edu
bKing Abdulaziz University, Department of Geomatics, Jeddah, Saudi Arabia
Commission II, WG II/4
KEY WORDS: Transitory Obstacles, Accessibility, Geocrowdsourcing, Data Quality, Semantics
ABSTRACT:
Transitory obstacles – random, short-lived and unpredictable objects – are difficult to capture in any traditional mapping system, yet they have significant negative impacts on the accessibility of mobility- and visually-impaired individuals. These transitory obstacles include sidewalk obstructions, construction detours, and poor surface conditions. To identify these obstacles and assist the
navigation of mobility- and visually- impaired individuals, crowdsourced mapping applications have been developed to harvest and analyze the volunteered obstacles reports from local students, faculty, staff, and residents. In this paper, we introduce a training program designed and implemented for recruiting and motivating contributors to participate in our geocrowdsourced accessibility system, and explore the quality of geocrowdsourced data with a comparative analysis methodology.
1. INTRODUCTION
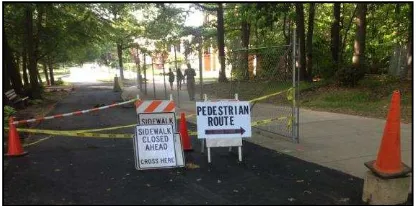
Mapping dynamic geographic phenomena is often difficult, due to the requirements for frequent updates and changes that occur over time. In urban areas, pedestrian corridors and transportation infrastructure are the most in-demand, critical features to map, yet they are frequently impacted by sidewalk obstructions, construction detours, and changing surface conditions (Figure 1).
Figure 1. Transient obstacles in the pedestrian corridors, Fairfax, Virginia.
For individuals with vision or mobility impairments, changes to the pedestrian corridors (even temporary ones) are very difficult, due to the necessity for rerouting, inconvenience, and the increased risks associated with safety hazards. Mapping these areas with high-frequency coverage is essential. Where remote sensing and automated feature extraction is not a realistic approach due to cost or required frequency of updates, a different approach is needed. Rein (2009) provides evidence of the great cost and difficulty associated with improving and maintaining a functional, accessibly multimodal transportation network. Beale et al. (2006), Laakso et al. (2011, 2013), Karimi et al. (2013), and Kasemsuppakorn et al. (2009) provide useful approaches for pedestrian network modeling and applications
for routing disabled individuals. Nuernberger (2008) and Barbeau et al. (2010) show how communication devices can be used to enhance navigation and improve communication with disabled individuals. The primary missing element in these approaches is the ability to capture and map transient events, which is difficult due to their dynamic nature.
Rice at al. (2011, 2012a) present a useful approach for mapping transient obstacle data using open source software, gazetteer-based geoparsing, and geocrowdsourcing. Subsequently, Rice et al. (2012b, 2013a, 2013b, 2014) extend this approach with quality assessment approaches, routing tools, and visualization. Paez (2014) presents a study of training and semantic understanding in geocrowdsourcing systems, and documents approaches for teaching contributors to identify and characterize transient obstacles in a geocrowdsourcing system. Through comparisons to other training systems embedded in OpenStreetMap, Google Map Maker, and the USGS’s The National Map, Paez identifies key strategies and approaches for training and summarizes those approaches. Rice et al. (2014) review the work of Paez (2014) and provide additional insight into the use of training systems and quality assessment of geocrowdsourced data.
permits users to report neighborhood issues to authoritative agencies such as tree falling, power outage, traffic light problems, offended graffiti, and potholes. SeeClickFix1 permits users to vote on problems to elevate the visibility of the report. The initiator can also close a case once the problem is resolved. Other examples of dynamic VGI or VGS applications are obstacle characterization abilities of the data contributors. The following sections of this paper present an overview of the GMU Geocrowdsourcing Testbed and its moderation and quality assessment program, the training and obstacle characterization studies, a short discussion of user motivations, a summary of positional accuracy characterization, and finally, conclusions and future work.
2. THE GMU GEOCROWDSOURCING TESTBED
The GMU Geocrowdsourcing Testbed (GMU-GcT), presented in Rice et al. (2014), was developed as an experimental approach for mapping transient navigation obstacles in the region surrounding the George Mason University Campus in Fairfax, Virginia. The GMU-GcT uses crowdsourced data contributions from members of the public, who identify, document, position, and describe obstacles through a map-based crowdsourcing approach. This system is built on the work of Paez (2014) and other best practices for map-based geocrowdsourcing. The system uses a menu-driven, semi-structured reporting process where end-users provide location information, temporal tags, images, and attribute data for obstacles in the Fairfax, Virginia region (Figure 1). The GMU-GcT has both desktop and mobile contribution tools to facilitate obstacle reporting by the public and provides services such as obstacle-avoidance routing (Qin et al., 2015).3
2.1 Moderation and Quality Assessment in the GMU Geocrowdsourcing Testbed
Many authors have explored data quality issues in geocrowdsourcing, including Haklay (2010) and Girres et al. (2010) who explore the accuracy of crowdsourced features in OpenStreetMap through comparisons with authoritative Ordnance Survey and French IGN data. The assessments in Girres et al. (2010) are noteworthy for the thoroughness of the evaluation in the context of well-known map accuracy and GIS data accuracy characterization methods, such as those published by Guptill et al. (1995), Hunter et al. (1992), and Veregin (1999). Goodchild and Li (2012) suggest different methods for quality assessing geocrowdsourced data. Because of the unofficial nature of the data, the GMU-GcT uses Goodchild and Li’s social approach, where a team of trained moderators checks data contributions for errors. This quality assessment system is discussed in Rice et al. (2014) and Paez (2014). A key to the data quality approach in the GMU-GcT is the ability of end-users to accurately identify, document, and characterize obstacles. While some elements of data contribution, such as map-based obstacle positioning, are
1
http://seeclickfix.com (accessed 3/12/15) 2
https://carmacarpool.com, https://www.waze.com (accessed 3/12/15)
3
http://geo.gmu.edu/vgi (accessed 3/12/15)
objective and easy to analyze for errors, other elements are more difficult. Obstacle characterization in the GMU-GcT requires a shared understanding of obstacle categories between the system administrators and system end-users. This categorical characterization process, as noted by Camponovo et al. (2014) in the context of the Haiti Earthquake response, is problematic. They report that over fifty percent of the messages to the Ushahidi web platform were mischaracterized with regard to emergency need. Foody et al. (2013) develop approaches for assessing the relative accuracies of end-user categorization of land cover. Galloway et al. (2013) tested the ability of young contributors to identify tree species, finding the contributors over-reported rarer classes. Quality assessment for crowdsourced geospatial data is a challenge, as noted by many of the fore-mentioned authors. The approach for quality assessment used in the GMU-GcT is built on the best practices for these approaches, with Goodchild and Li’s moderator-based social quality assessment as the model.
2.2 Training and Obstacle Categorization in the GMU Geocrowdsourcing Testbed
To improve the quality of information contributed to the GMU-GcT, Paez (2014) conducted a thorough review of training strategies in map-based social applications and geocrowdsourcing and found the most effective methods of training to be those that were embedded within the data contribution tools, such as those embedded within Google Map Maker and OpenStreetMap. Based on Paez’s work, training videos are embedded within the GMU-GcT, through the “How it Works” link.4 While effectiveness or success of the training methods can be difficult to assess, Paez (2014) provides a summary and assessment of best practices.
For the GMU-GcT, the primary means of characterizing transient navigation obstacles is through the placement of a map-based location icon, the categorization of the obstacle in question, and categorical assessments of the obstacles expected duration and urgency. While the positioning of obstacles is of high interest (Rice et al., 2015), a critical aspect is the contributor’s obstacle categorization. Potential contributors to the GMU-GcT (which includes a wide range of students, faculty, staff, and local community members) were asked to participate in a training exercise to learn obstacle categorization, and were shown a series of pictures with authoritative obstacle characterizations shown (Figure 2). The general obstacle types shown in Figure 2 and used in the GMU-GcT (sidewalk obstruction, construction detour, entrance/exit problem, poor surface condition, crowd/event) were derived from an end user study conducted in 2013 and reported in Rice et al. (2013a).
4
Figure 2. Training graphic with picture and obstacle type, obstacle duration, and obstacle priority characterization
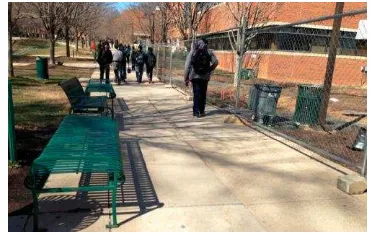
A subsequent training step asked potential contributors to identify the obstacle type from a simple unlabeled picture (Figure 3) using the obstacle types presented in the previous step. While some obstacle pictures were relatively easy to characterize (Figure 3, Figure 4) others were much more complex (Figure 5, Figure 6).
Figure 3. GMU geocrowdsourcing training picture showing crowd/event
Figure 4. High agreement (95%) for categorization of Figure 3 as a crowd/event obstacle by 37 training participants
Figure 5. GMU geocrowdsourcing training picture showing sidewalk obstruction
Figure 6. Significant disagreement for categorization of Figure 5 by 37 training participants.
Figures 7 and 8, similar to Figures 5 and 6, show relatively high levels of disagreement among the forty-six members of a second training cohort in early 2014. In Figure 7, the water hose draped across the sidewalk is interpreted as an obstacle, as are various construction barricades and construction vehicles visible off-screen.
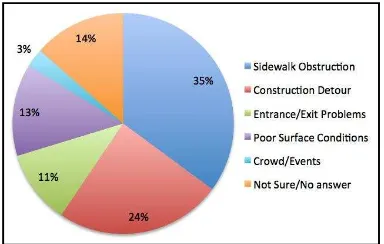
Figures 9 and 10 show relatively low levels of disagreement for the category of the object shown in Figure 9, which may be attributable to the less complex scene. A majority of participants categorized the obstacle in this image as a poor surface condition. Figure 11 shows the frequency of all obstacle category tags in the GMU-GcT as of January 2014.
Figure 7. GMU geocrowdsourcing training picture showing sidewalk obstruction
Obstacle Type
Sidewalk Obstructio Constructio De tour Entrance/Exit Problem Poor Surface Conditio
n
Figure 8. Significant disagreement for categorization of Figure 7 by 46 training participants
Figure 9. GMU geocrowdsourcing training picture
Figure 10. Moderate to low disagreement for categorization of Figure 9 by 46 training participants
Figure 11. Distribution of obstacle types in GMU-GcT, January 2014.
During the course of Paez’s study (Paez, 2014; Rice et al., 2014), 150 potential system contributors were trained in obstacle characterization. A few important results emerged from the training. First, participants recorded some
disagreement in obstacle characterization for complex scenes (Figure 5, Figure 8) where more than one potential obstacle can be seen. Initial training subjects requested the ability to declare more than one category of obstacle for each training image. A resulting change in the GMU-GcT was the allowance for multiple obstacle types for each object. Another change precipitated by feedback from training subjects was the use of broader and simpler duration categorizations, which are now instituted as shown in Figure 2, with durations being low (less than 1 day), medium (1-7 days), and long (greater than 7 days).
Current efforts in the training of participants for the GMU-GcT is the modularization of training materials into short videos, and the embedding of training material directly into the contribution tools, as recommended by end-users and noted in Paez (2014) and Rice et al. (2014).
2.3 User motivation in the GMU Geocrowdsourcing Testbed
The success of many geocrowdsourcing projects depends on the motivations and willingness of participants. For OpenStreetMap, an initial motivation for participation is described by Coast (2006) as resentment over the data pricing and data licensing practices of the Ordnance Survey. Furthermore, Coleman et al. (2009) note that differences in user needs and motivations are based on the different contexts in which they contribute. A study by Pease (2014) underscores the potential problems associated with user motivation in geocrowdsourcing. While typical positional accuracy levels for the GMU-GcT are in the same range as feature position accuracy positions noted by Haklay (2010) and Girres et al. (2010) for OSM data (Rice et al., 2014), Pease noted lower levels positional accuracy, and a higher level of disagreement for obstacle categorizations. In the study by Pease (2014), students were asked to characterize the position and attributes of obstacles along a path. The obstacles had previously been thoroughly characterized by trained moderators and project staff. Pease noted an average positional error of 13.07 meters for obstacle reports, and greater level of disagreement for obstacle categorization than for similar reports collected by the same GMU-GcT from the same area. The differences, according to project staff (Paez, 2014; Rice et al., 2014) were due to the motivation of the study participants. While in general, participation in the GMU-GcT is based on altruism and a desire to correct accessibility problems, the study participants in Pease (2014) were recruited from a general subject pool where extra credit was offered, which was suggested as a reason for their performance.
3. POSITION ACCURACY
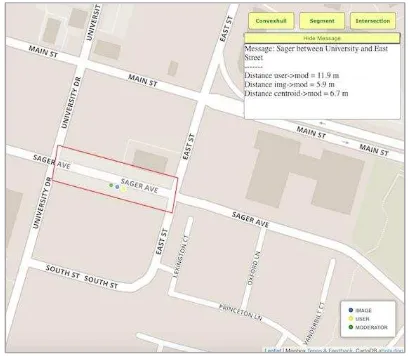
The GMU-GcT uses the positioning of reported obstacles in order to facilitate obstacle avoidance routing on a pedestrian network, which is motivated by the accessibility mapping and accessibility wayfinding work of Golledge (1999), Golledge et al. (2000, 2005, 2006), Church et al. (2003), Jacobson (1998), Pingel (2010) and Rice et al. (2005). Implemented in the system are four methods of evaluating positional accuracy: (1) human-georeferenced geographic coordinates via computer, (2) mobile GPS coordinates from user’s current position, (3) embedded geo-tags in an image of reported obstacle, and (4) convex hulls created from geoparsed text descriptions of the obstacle’s location, based on a comprehensive gazetteer. This work, characterized in Rice et al. (2015), involves the development of metric georeferenced footprints from geoparsed location descriptions (red outline in Figure 12, based on Rice et Sidewalk Obstructio
al., 2011), geo-tagged positions embedded within contributed obstacle images (blue marker in Figure 12), obstacle positioning from a movable location icon (yellow marker in Figure 12) and positioning determined through a social moderation of the report (green marker, Figure 12). This work continues, with recent efforts to use electronic compass data embedded in image headers to validate the positions of obstacles (Rice et al., 2015).
Figure 12. Positional characteristics of an obstacle report
4. CONCLUSION AND FUTURE WORK
The GMU-GcT has been built to gather information about transient navigation obstacles in the local environment. Gathering these obstacles using a geocrowdsourcing system provides many benefits, including the ability for blind, visually-impaired, and mobility-impaired individuals to be informed in advance about unexpected changes to a pedestrian pathway. It will also allow these individuals to re-route, and avoid risks and significant delays. The data quality assessment is done through a social moderation process and based on best practices. The ability of data contributors to characterize and categorize obstacles is important to the system, and has been studied and improved through an iterative process and feedback from end-users and contributors (Paez, 2014; Rice et al., 2014). The GMU-GcT allows for obstacle avoidance routing, and to do so requires obstacle data whose positional characteristics and attributes are well known. Project researchers will continue to improve the system and maintain high quality geographic information. Critical future work will refine the routing elements and active-use elements of the system, including mobile data validation tools and mobile moderation and quality assessment tools. A recent publication by Karimi et al. (2014) offers insights and strategies in a similar project, which will provide opportunities to adopt best practices and workflows from a different geographic setting.
ACKNOWLEDGEMENTS
This material is based upon work supported by the United States Army Corps of Engineers, Engineer Research and Development Center, under BAA #AA10-4733 Contract # W9132V -11-P-0011. Any opinions, findings and conclusions or recommendations expressed in this material are those of the author(s) and do not necessarily reflect the views of the United States Army Corps of Engineers.
5. REFERENCES
Barbeau, S.J., Winters, P.L., Georggi, N.L., Labrador, M.A., Perez, R., 2010. Travel assistance device: utilising global positioning system-enabled mobile phones to aid transit riders with special needs. Intelligent Transport Systems, IET 4, 12– 23.
Beale, L., Field, K., Briggs, D., Picton, P., Matthews, H., 2006. Mapping for wheelchair users: Route navigation in urban spaces. The Cartographic journal 43, 68–81.
Camponovo, M.E., Freundschuh, S.M., 2014. Assessing uncertainty in VGI for emergency response. Cartography and Geographic Information Science 41, 440–455.
Church, R.L., Marston, J.R., 2003. Measuring accessibility for people with a disability. Geographical Analysis 35, 83–96.
Coast, S., 2007. OpenStreetMap. Keynote address, NCGIA Workshop on Volunteered Geographic Information, December 13-17, 2007. University of California, Santa Barbara. http://ncgia.ucsb.edu/projects/vgi/docs/present/Coast_openstree tmap-opendata.pdf
Coleman, D.J., Georgiadou, Y., Labonte, J., 2009. Volunteered Geographic Information: the nature and motivation of produsers. International Journal of Spatial Data Infrastructures Research 4, 332–358.
Foody, G.M., See, L., Fritz, S., Van der Velde, M., Perger, C., Schill, C., Boyd, D.S., 2013. Assessing the Accuracy of Volunteered Geographic Information arising from Multiple Contributors to an Internet Based Collaborative Project: Accuracy of VGI. Transactions in GIS, 17(6), 847–860. doi:10.1111/tgis.12033
Galloway, A.W.E., Tudor, M.T., Haegen, W.M.V., 2006. The reliability of citizen science: a case study of Oregon white oak stand surveys. Wildlife Society Bulletin 34, 1425–1429.
Girres, J.-F., Touya, G., 2010. Quality Assessment of the French OpenStreetMap Dataset. Transactions in GIS 14, 435– 459. doi:10.1111/j.1467-9671.2010.01203.x
Golledge, R.G., 1999. Wayfinding behavior: Cognitive mapping and other spatial processes. JHU Press.
Golledge, R.G., Jacobson, R.D., Kitchin, R., Blades, M., 2000. Cognitive maps, spatial abilities, and human wayfinding. Geographical Review of Japan Series B 73, 93–104.
Golledge, R.G., Rice, M., Jacobson, D., 2005. A Commentary on the Use of Touch for Accessing On-Screen Spatial Representations: The Process of Experiencing Haptic Maps and Graphics. The Professional Geographer 57, 339–349. doi:10.1111/j.0033-0124.2005.00482.x
Golledge, R.G., Rice, M.T., Jacobson, R.D., 2006. Multimodal interfaces for representing and accessing geospatial information, in: Frontiers of Geographic Information Technology. Springer, pp. 181–208.
Goodchild, M. F., 2009. NeoGeography and the nature of geographic expertise. Journal of Location Based Services, 3(2), 82–96. doi:10.1080/17489720902950374
Goodchild, M.F., Li, L., 2012. Assuring the quality of volunteered geographic information. Spatial Statistics 1, 110– 120. doi:10.1016/j.spasta.2012.03.002
Guptill, S.C., Morrison, J.L., Association, I.C., 1995. Elements of spatial data quality. Elsevier Science Oxford.
Haklay, M., 2010. How good is volunteered geographical information? A comparative study of OpenStreetMap and Ordnance Survey datasets. Environment and planning. B, Planning & design 37, 682.
Haklay, M., Weber, P., 2008. Openstreetmap: User-generated street maps. Pervasive Computing, IEEE 7, 12–18.
Hill, L.L., 2006. Georeferencing: the geographic associations of information, Digital libraries and electronic publishing. MIT Press, Cambridge, Mass.
Hunter, G.J., Beard, K., 1992. Understanding error in spatial databases. Australian surveyor 37, 108–119.
Jacobson, R.D., 1998. Cognitive mapping without sight: Four preliminary studies of spatial learning. Journal of Environmental Psychology 18, 289–305.
Karimi, H.A., Kasemsuppakorn, P., 2013. Pedestrian network map generation approaches and recommendation. International Journal of Geographical Information Science 27, 947–962.
Kasemsuppakorn, P., Karimi, H.A., 2009. Personalised routing for wheelchair navigation. Journal of Location Based Services 3, 24–54.
Laakso, M., Sarjakoski, T., Lehto, L., Sarjakoski, L.T., 2013. An information model for pedestrian routing and navigation databases supporting universal accessibility. Cartographica: The International Journal for Geographic Information and Geovisualization 48, 89–99.
Laakso, M., Sarjakoski, T., Sarjakoski, L.T., 2011. Improving accessibility information in pedestrian maps and databases. Cartographica: The International Journal for Geographic Information and Geovisualization 46, 101–108.
Nuernberger, A., 2008. Presenting Accessibility to Mobility-Impaired Travelers (UCTC Dissertation). University of California Transportation Center, Santa Barbara, CA.
Paez, F.I., 2014. Recruitment, Training, and Social Dynamics in Geo-Crowdsourcing for Accessibility (Master of Science). George Mason University, Fairfax, VA.
Pease, P.A., 2014. The Influence of Training on Position and Attribute Accuracy in VGI (Master of Science). George Mason University, Fairfax, VA.
Pingel, T.J., 2010. Strategic elements of route choice. University of California, Santa Barbara.
Qin, H., Rice, R.M., Fuhrmann, S., Rice, M.T., Curtin, K.M., Ong, E., 2015. Geocrowdsourcing and accessibility for
dynamic environments. GeoJournal. DOI: 10.1007/s10708-015-9659-x
Rein, L., 2009. Tysons will need $15 billion for roads, transit, planners say. The Washington Post.
Rice, M., Jacobson, R.D., Golledge, R.G., Jones, D., 2005. Design considerations for haptic and auditory map interfaces. Cartography and Geographic Information Science 32, 381–391.
Rice, M.T., Hammill, W.C., Aburizaiza, A.O., Schwarz, S., Jacobson, R.D., 2011. Integrating User-contributed Geospatial Data with assistive Geotechnology Using a localized Gazetteer, in: Ruas, A. (Ed.), Advances in Cartography and GIScience. Volume 1, Lecture Notes in Geoinformation and Cartography. Springer Berlin Heidelberg, pp. 279–291.
Rice, M.T., Aburizaiza, A.O., Jacobson, R.D., Shore, B.M., Paez, F.I., 2012a. Supporting Accessibility for Blind and Vision-impaired People With a Localized Gazetteer and Open Source Geotechnology. Transactions in GIS 16, 177–190. doi:10.1111/j.1467-9671.2012.01318.x
Rice, M.T., Paez, F.I., Mulhollen, A.P., Shore, B.M., Caldwell, D.R., 2012b. Crowdsourced Geospatial Data: A report on the emerging phenomena of crowdsourced and user-generated geospatial data (Annual No. AA10-4733). George Mason University, Fairfax, VA.
Rice, M.T., Curtin, K.M., Paez, F.I., Seitz, C.R., Qin, H., 2013a. Crowdsourcing to Support Navigation for the Disabled: A Report on the Motivations, Design, Creation and Assessment of a Testbed Environment for Accessibility (US Army Corps of Engineers, Engineer Research and Development Center, US Army Topographic Engineering Center Technical Report, Data Level Enterprise Tools Workgroup No. BAA: #AA10-4733, Contract: # W9132V-11-P-0011). George Mason University, Fairfax, VA.
Rice, M.T., Jacobson, R.D., Caldwell, D.R., McDermott, S.D., Paez, F.I., Aburizaiza, A.O., Curtin, K.M., Stefanidis, A., Qin, H., 2013b. Crowdsourcing techniques for augmenting traditional accessibility maps with transitory obstacle information. Cartography and Geographic Information Science 40, 210–219. doi:10.1080/15230406.2013.799737
Rice, M.T., Paez, F.I., Rice, R.M., Ong, E.W., Qin, H., Seitz, C.R., Fayne, J.V., Curtin, K.M., Fuhrmann, S., Pfoser, D., Medina, R.M., 2014. Quality Assessment and Accessibility Applications of Crowdsourced Geospatial Data: A report on the development and extension of the George Mason University Geocrowdsourcing Testbed (Annual No. BAA: #AA10-4733, Contract: # W9132V-11-P-0011). George Mason University, Fairfax, VA.
Rice, R.M., Aburizaiza, A.O., Rice, M.T., Qin, H., 2015. Position Validation in Crowdsourced Accessibility Mapping. Cartographica: The International Journal for Geographic Information and Geovisualization 49, (in press).
Ruitton-Allinieu, A.-M., 2011. Crowdsourcing of Geoinformation: data quality and possible applications (Master of Science). Aalto University, Espoo, Finland.
Goodchild, M.F. (Eds.), 2013. Crowdsourcing Geographic Knowledge. Springer Netherlands, Dordrecht, pp. 161–173.