AUTOMATIC CREATION OF STRUCTURAL MODELS FROM POINT CLOUD DATA:
THE CASE OF MASONRY STRUCTURES
B. Riveiro a, *, B. Conde-Carnero a, H. González-Jorge b, P. Arias b, J.C. Caamaño a
a
Applied Geotechnologies Group, Dept. Materials Engineering, Applied Mechanics and Construction, University of Vigo, Campus Lagoas-Marcosende, CP 36310 Vigo, Spain – belenriveiro, bconde, jccaam)@uvigo.es
b
Applied Geotechnologies Group, Dept. Natural Resources and Environmental Engineering, University of Vigo, Campus Lagoas-Marcosende, CP 36310 Vigo, Spain (higiniog, parias)@uvigo.es
Commission I, ICWG I/Va
KEY WORDS: Point clouds, Automatic Processing, Watershed segmentation, Structural Models, 3D Modelling, Masonry walls.
ABSTRACT:
One of the fields where 3D modelling has an important role is in the application of such 3D models to structural engineering purposes. The literature shows an intense activity on the conversion of 3D point cloud data to detailed structural models, which has special relevance in masonry structures where geometry plays a key role. In the work presented in this paper, color data (from Intensity attribute) is used to automatically segment masonry structures with the aim of isolating masonry blocks and defining interfaces in an automatic manner using a 2.5D approach. An algorithm for the automatic processing of laser scanning data based on an improved marker-controlled watershed segmentation was proposed and successful results were found. Geometric accuracy and resolution of point cloud are constrained by the scanning instruments, giving accuracy levels reaching a few millimetres in the case of static instruments and few centimetres in the case of mobile systems. In any case, the algorithm is not significantly sensitive to low quality images because acceptable segmentation results were found in cases where blocks could not be visually segmented.
* Corresponding author. This is useful to know for communication with the appropriate person in cases with more than one author.
1. INTRODUCTION
During the last years, the creation and application of 3D models to many documentation, inspection and monitoring tasks has provoked that reverse engineering gained popularity outside of the geomatic domain. Building reconstruction has been one of the most popular fields of research during the last years (Haala et Kada, 2010). Within this field, many efforts have been aimed to façade modelling (Becker, 2009; Pu et Vosselman, 2007) due to the increasing demand of realistic and accurate city models. Most of these approaches deal with reconstructing façade components such as walls, doors or windows, while no attention is paid to blocks forming masonry walls, especially relevant in heritage buildings.
One of the fields where 3D modelling has an important role is in the application of such 3D models to structural engineering purposes. The literature shows an intense activity on the conversion of 3D point cloud data to detailed structural models. Specific applications to structural engineering can be seen in Riveiro et al. (2011a) and Riveiro et al. (2011b) who developed a methodology that allows point clouds acquired by terrestrial laser scanning and photogrammetry, respectively, to be converted into metric images suitable for subsequently stability analysis of masonry arches. Truong-Hong et al (2012) focused in the automatic processing of point clouds in order to automatically build geometric models suitable for structural purposes. Park et al. (2007) showed the application of LiDAR data for accurately measuring deflection of loaded beams. Later, Lee & Park (2011) demonstrated how laser scanning might help to determine beam stresses in combination with Finite Element Modeling (FEM). In general, laser scanning is gaining popularity in the field of structural and civil engineering,
however the process still demands a highly manual intervention during the processing for a suitable conversion.
In the particular case of masonry structures, the structural analyses have been traditionally carried out based on stability analysis using the limit analysis theory, where geometry is essential to build the structural model. Numerical methods such as Finite Element Method (FEM) or Discrete Element Modelling (DEM) have also been used, offering a more realistic as well as detailed approach where the behaviour of masonry and interfaces may be precisely modelled separately.
Masonry is a heterogeneous material that consists of units (stone, bricks, etc.) and joints (mortar, dry, etc.). The huge number of possible combinations generated by the geometry, nature and assembly of units as well as the characteristics of mortars raises doubts about the accuracy of the term “masonry”. Still, masonry can be considered a composite material that consists of units and mortar joints.
However, due to its composite nature, masonry exhibits distinct directional properties due to the mortar joints which act as planes of weakness. In general, the approach towards its numerical representation can focus on the micro-modelling of the individual components, or the macro-modelling of masonry as a composite. Macro-modelling is more practice oriented due to the reduced time and memory requirements as well as a user-friendly mesh generation. This type of modelling is most valuable when a compromise between accuracy and efficiency is needed. Still, much effort has been made recently to incorporate the geometry of masonry in structural analysis, thereby creating a composite material by resorting to ISPRS Annals of the Photogrammetry, Remote Sensing and Spatial Information Sciences, Volume II-3/W5, 2015
homogenization techniques, see Lourenço et al. (2007) for a review.
Using micro-modelling or macro-modelling approaches, masonry walls need to be geometrically characterized and the morphologic analysis of their comprising elements is required. This procedure can be manually done from both projective images using photogrammetry or from laser scanning data as presented in Riveiro et al. (2011a) and Riveiro et al. (2012b), respectively. Nowadays, a new challenge for geomatics consists of providing such geometric models in an automatic manner. The advances in image and laser scanning processing in the last years indicate laser scanning as a promising method to automatically distinguish (in terms of geometry) the components of masonry structures.
In the work presented in this paper, intensity data is used to automatically segment masonry with the aim of isolating masonry blocks and defining interfaces in an automatic manner using a 2.5D approach. When the 3D data is reduced to 2D images (according to the main planes of the structure) the segmentation of the structure can be achieved by using different image processing algorithms, such as color enhancement, thresholding, mathematical morphology, etc. For this particular application (quasy-periodic masonry walls) the watershed segmentation algorithm, combined with a new geometrically-constrained marking procedure, allowed to obtain a robust process.
Even this procedure would also be valid for photographic images, it would require a preprocessing to obtain metric information, so the perspective system of each single image and its external orientation must be computed. Using the most simple photogrammetric approach, based on image rectification through a projective transformation, would require also having auxiliary instrumentation containing control points or scale bars. Even the geometric results could be obtained; the results of segmentation would remain in the 2D space. Overall, the laser scanning is more suitable when surveying large structures.
The methods presented in this work were validated in real case studies where point cloud data was collected through both static and on-the-fly (mobile) laser scanners. After processing the point clouds with the algorithms the results show a good accuracy for the segmentation of the point cloud and for the subsequent dimensional analysis. The algorithms overall present a good robustness, and also show that the errors during segmentation are principally motivated by the low density of the original point clouds.
2. PROPOSED METHOD
To ease the usage of LiDAR data in structural engineering applications, an algorithm focused on automatic processing of point clouds was developed using Matlab software. This algorithm is based in a 2.5D approach by exploiting the attribute of the intensity of laser beam. This algorithm may be summarized in three main tasks: data preparation: raw data to point cloud; data pre-processing: conversion from 3D to 2D space; data processing: Morphological image processing and image segmentation.
2.1 Data preparation: LiDAR raw data to point cloud
The first step consists of exporting the point cloud measured by the scanner to an ASCII file into a Cartesian coordinate system where each point is defined by orthogonal coordinates (X,Y,Z)
and the attribute of intensity. The resolution of the intensity depends on each scanner model.
In the case of point clouds measured by static scanners (TLS), the point cloud is automatically converted from the spherical coordinate system centered in the scanner to the Cartesian one. The TLS Riegl instrument used in for the case studies of this paper is managed through the software Riscan Pro®.
In the case of mobile technology, the creation of the point cloud is not immediate and requires special processing. First, the smooth best estimated trajectory (SBET) is computed, by using the software POSPac MMS 5.4, from the data gathered by the navigation system during the survey. The data from the vehicle are completed with GNSS data from a base station in Braga, located 20 km far from the study case site. The variations in the measured GNSS location at the base station and its surveyed location are recorded and timed during the mission, and applied soon afterwards to the trajectory data. Then, using DASHMap software the raw LiDAR data measured by the Lynx system are processed together with the SBET and is used to calculate a geo-referenced point cloud in 3D space containing the intensity data. masonry structure into an organized point cloud. Raster models are commonly used for geospatial operations due to their easy storage and processing, as well as versatility. Each pixel is coloured by averaging the intensity attribute of all corresponding points from the point cloud. According to Höfle & Pfeiffer (2007), intensity attribute is directly related to the spectral characteristics of materials so the two principal objects in a masonry wall (stone and joint) may be distinguished.
The plane of projection was computed as the plane that best fits the point cloud in the masonry wall. This operation was computed by hyper-planar fitting using orthogonal regression. This model uses least squares where the errors are measured orthogonally to the proposed plane.
Once this plane is obtained, the orthogonal projection of the points forming the 3D point cloud is immediate. Given a point P of the point cloud defined by its Cartesian components (X0, Y0, Z0) and the normal N to the fitted plane (defined by (A, B, C), ISPRS Annals of the Photogrammetry, Remote Sensing and Spatial Information Sciences, Volume II-3/W5, 2015
These equations, together with the implicit equation of the previous fitted plane (equation 3), define the point of intersection Q between the line and the plane.
(3)
The intersection between the fitted plane and the lines corresponding to each point in the point cloud constitutes the 2D point cloud for rasterisation.
In continuation, the next step is defining the intensity attribute for each element in the raster structure. The intensity attribute of an area S of the masonry wall can be modelled as the random field {I(s): s ∈S ⊂ R2}. The set of points of the point cloud covering the element area can be considered as the collection of independent observations at locations s = {s1, s2, … , sn} on the random field, and is denoted by the data vector I(s) = {I(s1), I(s2), …, I(sn)}.
According to the 2.5D approach explained above, the raster representation of the point cloud consists of latticing the continuous domain S and computing a value of intensity (DN) for each raster element (pixel). For a given pixel defined by the region P and the corresponding area |P|, it is possible to estimate the intensity of the pixel averaging the random field in P (equation 5):
(5)
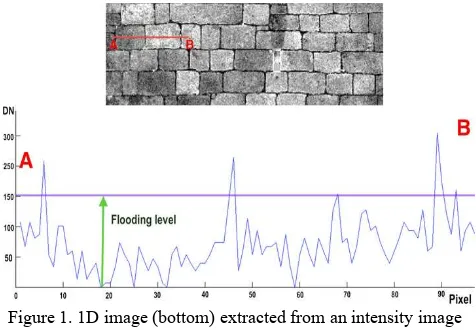
The value of the I(P) (Intensity value in the raster image) is computed by using the observed data (point cloud sample) contained in the region of the pixel. Consequently, the spatial resolution of the results of the classification proposed here will be constrained by the window size for DN prediction: the pixel size. Figure 1 (top) presents the intensity image corresponding to a masonry wall. Digital numbers correspond to infrared spectrum (1550 nm in the Lynx Mobile Mapper and 1540 nm in the Riegl LMS Z-390i ).
Figure 1. 1D image (bottom) extracted from an intensity image of a masonry wall (top), where vertical axis represents the DN of the pixels and horizontal axis the pixels contained in the
segment line AB respectively
2.3 Data processing: Geometrically-constrained marker controlled watershed segmentation
Once the raster structure is built and the digital number (DN) of each pixel is computed, the process involves developing a segmentation strategy that allows differentiating masonry blocks and joints (with mortar or dry joint). The core objective is to isolate masonry blocks to subsequently perform the morphological analysis for each individual stone unit. For that purpose clustering algorithms were tested to perform the image partition into masonry and joint (Thresholding, k-means, region
growing, etc.), However successful results were not found due
to the heterogeneity of masonry texture. The segmentation objective was to distinguish masonry from joints (with mortar or dry), however the micro-relief of the granite causes that many isolated pixels corresponding to masonry show similar intensity values than joints, and so, clustering does not provide useful results.
Based on those unsuccessful results, an approach based on geometrically constrained marker-controlled watershed segmentation is proposed to obtain a correct image partition.
Watershed is an algorithm within the framework of mathematical morphology that allows partitioning an image on the basis of assuming that a graytone image can be viewed as a topographical surface where the graytone of each pixel represents the height of the surface (Meyer, 1994; Gonzalez et al., 2009). Figure 1 illustrates a 1D signal (corresponding to an image row of the intensity image).
The first approach to this method of segmentation was introduced by Beucher & Lantuéjoul in 1979 who considered that if the relieve is flooded (with the sources placed at the regional minima), the level of the flood is the same at the different basins and increases with uniform speed. When two adjacent basins are full and their streams start to merge a barrier is erected to prevent mixing. The structure of all barriers constitutes the watershed line.
Rigorous mathematical definitions of the watershed line were presented in (Meyer, 1993; Meyer, 1994). One of the most common problems encountered when performing a direct watershed transformation is over-segmentation due to noise. The intensity image of granite stone easily gives incorrect results for the segmentation. According to (Gonzalez et al, 2009), an approach to avoid over-segmentation consists of using markers. Several publications present strategies to get an efficient marking map, but, for the case of masonry walls as analysed in this paper, successful results were not found. For this reason, a geometrically constrained marking process was developed.
The original intensity image was used to produce the markers. To reduce noise caused by the texture of the granite components in the intensity image, a median filter (medfilt2 function) followed by a lowpass Gaussian filter (using fspecial function) is applied. The medfilt2 function computes the value of each pixel as the median value of a rectangular neighbourhood centered on the corresponding pixel in the original image.
fspecial function is used to obtain a rotationally symmetric
Gausian lowpass filter whose standard deviation is imposed. Subsequently, this filter is applied to the image where the noise caused by the stone texture and missed pixels is significantly reduced.
Afterwards, directional derivatives to the image (using “Sobel” operator) were computed along the principal directions of masonry joints. The geometry of masonry courses was assumed to follow horizontal rows and the next step consisted of identifying the horizontal joints between adjacent masonry courses. The strategy involved computing the sum of DN, R(i), of all those pixels corresponding to each row in the image (equation 6).
(6)
Where:
i=1,2,…,m, and m are the number of rows in the intensity image.
j is the column index, while n is the number of columns in the intensity image.
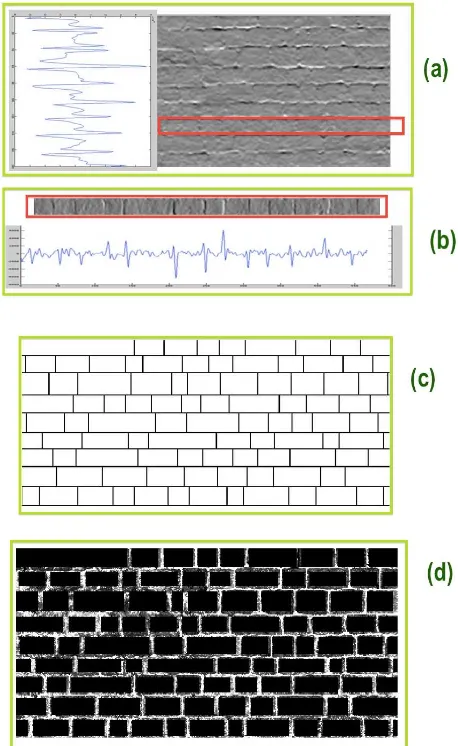
In order to easily identify the rows of pixels that correspond to joints, a gradient of the function F(i) was computed so the peaks of this function denote the presence of joints (Figure 2a). The output of this step was the indexes r(k) that serve for the partition of the original image in a discrete number of sub-images of corresponding masonry courses. k is the number of indexes detected.
The next step has to do with performing the previous operation again while focusing on detecting peaks that enables the identification of the joints between blocks in each course. Note that now each of the sub-images, created from the previous step, correspond to a course. Each sub-image has a number of rows that is the distance between peaks in the previous step, and the number of columns is again n.
(7)
Where: j=1,2,…, n.
k=1,2,…, p, p being the length of r(k).
Figure 2b shows the gradient of the function C(j) where peaks provide the index for the pixels that represent joints between adjacent blocks in the same course.
Using the pixel coordinates provided by the previous steps, a wireframe image denoting the four corners of each stone block is built (Figure 2c). These rectangles are eroded using mathematical morphology operators (Heijmans and Ronse, 1990) so that the markers for each stone are obtained. Figure 2d represents the markers used for the watershed segmentation which are superimposed on the graytone image of the masonry wall.
Finally, a watershed segmentation using the watershed function is carried out to improve the outlining of stone blocks according to the real boundary of the stone instead of using a simplified rectangular shape for each block. Length and height are computed for each ashlar, as well as area and perimeter. Also, the labelling of each pixel after segmentation may be used to colour the original point cloud. This is possible because each point in the point cloud is geometrically related to each pixel of the intensity image, so the results of transformation are directly projectable to the original point cloud in the 3D space. Further details can be seen in Riveiro et al., 2015.
Figure 2 Definition of markers based on geometry for the watershed segmentation. a) detection of joints between masonry
courses in the gradient image; b) detection of joints between adjacent ashlars for each masonry course; c) wireframe denoting
the corners for the markers of each block; d) markers after erosion.
3. RESULTS 3.1 Case studies
To validate the performance of the algorithm presented here, two different masonry constructions were surveyed by laser scanning: the vault of a masonry bridge, and a fortification Medieval Wall. The first one was surveyed using the terrestrial laser scanner in static mode. The second construction was measured using the mobile mapping system by using on-the-fly mode.
3.2 Masonry vault of Cernadeda Bridge using a TLS Cernadela Bridge is a five arch masonry bridge built using granite ashlars. The complete laser scanning survey with the Riegl was presented in Riveiro et al. (2011).
After registering the point cloud of the bridge, the next step is manual selection of the walls of interest. For the investigation presented in this paper, the point cloud of one of its vaults was exported to ASCII in order to automatically map all its voussoirs. This point cloud comprises XYZ coordinates and ISPRS Annals of the Photogrammetry, Remote Sensing and Spatial Information Sciences, Volume II-3/W5, 2015
intensity attribute. After exporting the point cloud from the software that controls the terrestrial laser scanner (RiscanPro®), the point cloud can be imported in any point cloud reader that permits surfing and performing customized point cloud viewers under free licenses terms. This operation needs to be manually controlled by a human operator but does not require any special training in geomatics. Figure 3 (left) shows the point cloud of the vault used to test the algorithm.
The intensity image of this vault was built for a pixel size of 2 cm, which is a spatial resolution that allows differentiating joints in the whole wall (joints had an average thickness of 2-3cm). Note that this low resolution not prevent finding proper results because the segmentation not rely at a single pixel value but it accounts for its neighbourhood. on Note that zones closer to the scanner contain more points that describe the wall morphology more clearly for the human eye. The areas of the vault with a more oblique incidence angle are not so clear for the human eye to see, however the algorithm can distinguish them properly. Figure 4 shows the segmentation results for the vault under study.
Figure 3. Point cloud of the vault (left) and intensity image (right).
Figure 4. Results of the segmentation process; contours for markings to be used in the marker-controlled watershed segmentation (left) and results of watershed segmentation
superimposed to the intensity image of the wall (right).
3.3 Defence wall
The second case study is a mediaeval wall in the city of Guimaraes (Portugal). The masonry structure under study is a stretch 230m long wall with a straight direction. The masonry has a regular course bond.
The survey of the mediaeval Wall of Guimarães was performed using the mobile laser scanning system Lynx Mobile Mapper described in Puente et al. (2013). The wall is located in a street with traffic circulation limited to speed of 30km/h. The survey was conducted in a cloudy day at midday with normal traffic condition (traffic was not stopped during survey). The scanning time in the wall was 237.03 seconds when the vehicle was driven with an average speed of 1.01 m/s. The two LiDAR sensor heads were measured with an acquisition rate of 250 000 points per second, thereby a dense point cloud was registered.
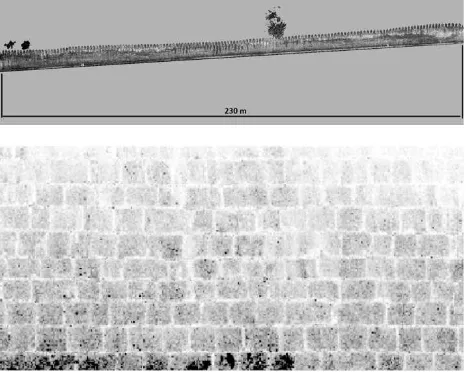
Figure 5 (top) contains points used for the subsequent processing which corresponds to the point cloud collected by a single LiDAR sensor. Because the incidence angle and range may affect the intensity attribute, the data captured by both sensors was used separately. The point cloud corresponding to the masonry wall used for processing contained 7.8 million points.
Figure 5. Point cloud collected with the MLS Lynx Mobile Mapper system to validate the algorithm (top) and an intensity
image created from this point cloud.
It must be noted that the spatial resolution was significantly lower than in the static instrument. This caused intensity images with reduced quality as shown in Figure 5 (bottom). The intensity image of the wall was created with a pixel size of 3 cm.
Figure 6 shows the results of segmentation for the previous sample image. Even the precision of the image may limit the quality of the segmentation, the results were found with enough accuracy for the subsequent structural analysis. The watershed segmentation of the point cloud can be seen in Figure 6, which is very consistent.
3.4 Validation of results
To validate the geometric accuracy of the proposed method, both laser scanners were tested for the same wall stretch in the Mediaeval wall: TLS was used to create images with higher resolution than those created from MLS data. In the images built from MLS point clouds the pixel size was 3cm, while, for TLS images, the resolution was 1cm.
Once the survey images were selected, these sample windows were searched into the original point clouds. Validation was performed in a set of 200 granitic ashlars.
The validation of the measures was performed by an operator with knowledge in masonry structures. The manual process consisted of selecting distances that visually correspond with the averaged length and height of each ashlar. Riscan Pro software was used for both types of point clouds.
!
Figure 6 Segmentation of an intensity image created from MLSdata: watershed segmentation results (top); superimposition of segmented image and original image (bottom).
The differences between automatic measurement and manual measurement in the real geometry are presented in table 1. Mean values were computed in absolute dimensions (µ (cm)), and relatively to the length to be computed (µ (%)).
Diferences TLS MLS
µ (cm) 0,79 2,61
µ (%) 1,48 4,40
σ (cm) 0,82 1,93
Table 1. Differences between results of segmentation and real measurements.
According to these results, the proposed algorithm may be accepted as valid since in both cases the averaged errors are smaller than the resolution of images (ps) whose interval is defined from –ps to + ps. This suggests that the quality of the results generated by the algorithm will depend on the density of the original point cloud.
The results show the validity of the method for quasi-periodic masonry walls, where masonry courses follow a uniform pattern and ashlars have similar heights. This is crucial for the creation of the geometrically-constrained markers, otherwise markers would be automatically created based on the intensity image producing incorrect results (oversegmentation).
The main reason for the inaccuracies comes from the low density of the original point cloud. It is expected that the advances in laser scanning technology guarantee the proper density of point clouds since nowadays MLS is still limited to produce high density point clouds.
During the process of validation, it was observed, as expected, that the algorithm is not smart enough to differentiate fractures from masonry joints, so further developments in this aspect, by
removing outliers, would improve the final application of the algorithm.
When processing flat surfaces the rectangular coordinates are used to create the intensity images without modifying the scale of dimensions. However, to include in the method also curved surfaces, the distances obtained through the segmentation process need to be projected back to the original point cloud where final dimensions are calculated (this is the core idea of our 2.5D approach). Note that each pixel in the 2D image is linked by indexes to all those points of the original point cloud projected in that pixel. Consequently, the precision of the segmented point cloud will be constrained by the pixel size used.
4. CONCLUSIONS
A methodology for the surveying of quasi-periodic masonry walls and subsequent geometric segmentation was developed. The geometric segmentation followed a 2.5D approach by projecting 3D information in a plane and converting the data to a raster image so the processing could be based in digital image processing.
The proposed algorithm is based on improved marker-controlled watershed segmentation. The methodology includes data from both stationary and mobile devices, which provide data regarding the intensity attribute, since it indicates different spectral properties of materials being measured. The key objective of this investigations consisted of differencing masonry and joints by using the intensity attribute.
Geometric accuracy and resolution of point cloud are constrained by the scanning instruments, giving accuracy levels reaching a few millimetres in the case of static instruments and few centimetres in the case of mobile systems. In any case, the algorithm is not significantly sensitive to low quality images because acceptable segmentation results were found in cases where blocks could not be visually segmented.
Finally, it should be noted that this procedure would also be valid for photographic images. However it would require a preprocessing where the perspective system of each single image and its external orientation must be computed. Consequently control points are required to pre-process images.
ACKNOWLEDGEMENTS
This work has been partially supported by the Spanish Ministry of Economy and Competitiveness through the project “HERMES-S3D: Healthy and Efficient Routes in Massive Open-Data based Smart Cities (Ref.: TIN2013-46801-C4-4-R) and by Xunta de Galicia (Grant No. CN2012/269).
REFERENCES
Becker, S. Generation and application of rules for quality dependent façade reconstruction. ISPRS J. Photogramm. Remote Sens. 2009, 64 (6), 640–653.
Beucher, S and Lantuéjoul, C. 1979. Use of watershed in contour detection, Proc. Workshop on Image Processing, CCETT/IRISA, Rennes, France, 2.1-2.12.
Gonzalez, R.C., Woods, R.E., Eddins, S.L. 2009. Digital Image Processing using MATLAB. Gatesmark, LLC.
Haala, M.; Kada, M. An update on automatic 3D building reconstruction. ISPRS J. Photogramm. Remote Sens. 2010, 65 (6), 570–580.
Heijmans, H.J.A.M., and Ronse C. 1990. The Algebraic Basis of Mathematical Morphology I. Dilations and Erosions.
Computer Vision, Graphics, and Image Processing 50, 245-295.
Höfle, B. and Pfeiffer, N. 2007. Correction of laser scanning
intensity data: Data and model-driven approaches. ISPRS
Journal of Photogrammetry & Remote Sensing, 62(6): 415–433.
Lee H.M., and Park, H.S. 2011. Gage-Free Stress Estimation of a Beam-like Structure Based on Terrestrial Laser Scanning.
Computer-Aided Civil And Infrastructure Engineering, 26 (8):
647–658.
Meyer, F. Integrals, gradients and whatershed lines, 1993. Proc. Mathematical morphology and its applications to signal
processing. Barcelona, May 1993: 200-211.
Meyer, F. (1994). Topographic distance and watershed lines. Signal Processing, 38(1): 113 – 125.
Park, H.S. Lee, H.M., Adeli, H. and Lee, I., 2007. A New Approach for Health Monitoring of Structures: Terrestrial Laser Scanning, Computer-Aided Civil and Infrastructure
Engineering, Vol. 22 (1), No. 1, 2007, pp. 19-30.
Pu, S. and Vosselman, G. 2007. Extracting Windows from Terrestrial Laser Scanning. In Proceedings of the ISPRS
Workshop on Laser Scanning 2007 and SilviLaser 2007, Espoo,
Finland, 12–14 September 2007; pp. 320–325.
Puente , I., González-Jorge, H., Riveiro, B., Arias, P. 2013. Accuracy verification of the Lynx Mobile Mapper system.
Optics & Laser Technology, 45: 578–586.
Riveiro, B., Caamaño, J.C., Arias, P., Sanz, E. 2011a. Photogrammetric 3D modeling and mechanical analysis of masonry arches: an approach based on a discontinuous model of voussoirs. Automation in Construction, 20(4): 380-388.
Riveiro, B., Morer, P., Arias, P., De Arteaga, I. 2011b. Terrestrial laser scanning and limit analysis of masonry arch bridges. Construction and Building Materials, 25(4): 1726– 1735.
Riveiro, B., Lourenço, P., Oliveira, D., González-Jorge, H. Arias, P. 2015. Automatic Morphologic Analysis of Quasi-Periodic Masonry Walls from LiDAR. Computer-Aided Civil
and Infrastructure Engineering. DOI: 10.1111/mice.12145. (in
press).
Truong-Hong, L., Laefer, D.F., Hinks, T., Carr, H. 2013. Combining an Angle Criterion with Voxelization and the Flying Voxel Method in Reconstructing Building Models from LiDAR Data. Computer-Aided Civil and Infrastructure Engineering, 28(2): 112–129.