REMOTE SPECTRAL IMAGING USING A LOW COST UAV SYSTEM
C. Tsouvaltsidis a*, N. Zaid Al Salem b, G. Benari a, D. Vrekalic c, and B. Quine a,b
a Department of Earth and Space Science and Engineering, York University, Toronto ON,
(tsouvalc, gbenari, bquine)@yorku.ca (416) 736-2100
b Department of Physics and Astronomy, York University, Toronto ON,
[email protected] (416) 736-2100
c Drones Toronto, Toronto ON, [email protected] (647) 391-0350
* Corresponding author
KEYWORDS: UAV, infrared, spectra, soil, coastline, Argus 1000, low-cost, COTS
ABSTRACT:
The purpose of this scientific survey is to support the research being conducted at York University in the field of spectroscopy and nanosatellites using Argus 1000 micro- spectrometer and low cost unmanned aerial vehicle (UAV) system.
On the CanX-2 mission, the Argus spectrometer observes reflected infrared solar radiation emitted by Earth surface targets as small
as 1.5 km within the 0.9-1.7 µm range. However, limitations in the volume of data due to onboard power constraints and a lack of an
onboard camera system make it very difficult to verify these objectives using ground truth. In the last five years that Argus has been in operation, we have made over 200 observations over a series of land and ocean targets.
We have recently examined algorithms to improve the geolocation accuracy of the spectrometer payload and began to conduct an analysis of soil health content using Argus spectral data. A field campaign is used to obtain data to assess geolocation accuracy using coastline crossing detection and to obtain airborne bare soil spectra in ground truth form. The payload system used for the field campaign consists of an Argus spectrometer, optical camera, GPS, and attitude sensors, integrated into a low-cost, unmanned aerial
vehicle (UAV), which will be presented along with the experimental procedure and field campaign results.
1. INTRODUCTION
The purpose of this scientific survey is to support the research being conducted at York University in the field of spectroscopy and nanosatellites. Specifically, the operation will collect spectral data over various soil types at differing moisture contents (at a later time) and over coastlines using unmanned aerial vehicles (UAV). This is done in order to test algorithms
that determine soil moisture content
(SMC) from spectral imagery and other algorithms designed for the geolocation of data from a spaceborne nadir pointing spectrometer by collecting infrared spectral measurements over coastal areas. The data from the UAV will be used as ground truth to verify the effectiveness of the algorithms developed for the spectral instrument.
1.1 Background
Saari et al (2011) developed an Unmanned Aerial Systems (UAS) that consists of Fabry-Perot Interferometer (FPI) based hyperspectral imager and high resolution false color imager for forest and agriculture applications. The FPI based hyperspectral imager operates in the spectral range 500-900 nm at selectable spectral range from 10 nm to 40 nm. The 5Mpix CMOS image sensor used in the spectral imager prototype an on-chip ADC which provides 12 bit dynamic range per pixel. The Unmanned Arial Vehicle (UAV) imaging system consists of GPS receiver, downwelling irradiance sensor, autopilot, VIS-NIR spectral camera with compact flash memory, and high resolution false color camera with compact flash memory. Their preliminary analysis shows the possibility of generating high resolution Digital Surface Models (DSM) from false color images. Johnson et al (2003) developed a small UAV to collect digital RGB (red-green-blue) and hyperspectral imagery in the spectral
range from 480 nm to 880 nm above San Bernabe Vineyards in California. The high spectral resolution data that they collected in 580 channels were used for examination of canopy reflectance differences as related to crop vigor. The UAV used in this field campaign can support payload of approximately 5 kg and drawing 40 watts of power and can remain aloft for up to 8 hours, with an altitude ceiling of 3000 m.
Hakala et al. (2013) developed a Fabry-Perot interferometer based spectral imaging system which operates in the spectral range 400-1000 nm for applications that require more detailed spectral information about the surface. They investigated a new method based on in-situ irradiance measurement for radiometric correction of UAV imagery that has been collected in variable imaging conditions. vonBueren et al. (2015) developed four optical UAV-based sensors (high spectral resolution spectrometer, RGB camera, converted near-infrared camera and six-band multispectral camera) for precision agricultural applications. They used two different UAV systems QuadKopter and a Falcon-8. The spectrometer (Ocean Optics STS-VIS) operates in the spectral range 338-824 nm with spectral resolution 3 nm, field of view 12° and weight of 216 g. They used a ground-based spectrometer that covers the spectral range from 325 nm to 1075 nm for comparison with all UAV sensors flown in their study.
downwelling solar radiation. It was designed to take nadir measurements from the UAV with 100 mrad angular field of view and operates in the spectra interval 7-24 microns with spectral resolution 0.5 .
Mac Arthur et al. (2014) developed a lightweight spectrometer for environmental monitoring (upwelling and downwelling solar radiation) from a rotary-wing UAV platform. The spectrometer (QE Pro, Ocean Optics) operates in the very near infrared (VNIR) region from 400 nm to 1000 nm while the spectral interval 1000-1700 nm is under development. Chao et al. (2008) developed a small UAV for cooperative remote sensing for real-time water management and irrigation control where three different types of UAV platforms were tested including off-the-shelf Procerus UAV, Xbow UAV with open source software and Parparrazi UAV with both open source software and open source hardware. During summer of 2007 and 2008, Berni et al.(2009) flew UAV platforms over agricultural fields, obtaining thermal imagery in the 7.5–13-μm region (40 cm spatial resolution) and narrow-band multispectral imagery in the 400–800-nm spectral region (20 cm spatial resolution). Wallace et al. (2012) developed a low-cost Unmanned Aerial Vehicle-Light Detecting and Ranging (UAV-LiDAR) system to to provide an unrivalled combination of high temporal and spatial resolution datasets. The aim of this system is to present development of a UAV-borne LiDAR system using lightweight and low-cost sensors, and demonstrate its capability of collecting spatially dense, accurate, and repeatable measurements for forestry inventory applications.
Valencia et al. 2008 used 2.5 meter wingspan with approximately 45 minutes flight autonomy UAV for moisture and salinity map and retrieval. Turner et al. (2011) used a multi-rotor electric powered UAV system for hyper resolution vineyard mapping based on visible, multispectral, and thermal imagery. Archer et al. (2004) used AutoCopter-XL, a small
unmanned helicopter that can fly autonomously or
semiautonomously to measure the soil moisture in the L-Band (1.4-GHz).
1.2 Argus 1000 on CanX-2
The Canadian Advanced Nanospace eXperiment (CanX) is a series of satellites launched by the University of Toronto
Institute for Aerospace Studies’ Space Flight Laboratory
(UTIAS/SFL) since September, 2001 (Rankin, 2005). The CanX program was developed to provide Canada with a continuous supply of highly skilled and experienced space system and microsatellite engineers while at the same time providing a low-cost, quick-to-launch satellite platform upon which to execute scientific and technology demonstration missions (Sarda et al., 2006). Argus 1000 micro-spectrometer is a new generation of miniature remote sensing instruments primarily used to monitor greenhouse gas emissions from space. Launched on the CanX-2 micro-satellite April 28, 2008 (Jagpal et al., 2010), Argus 1000 spectrometer is capable of monitoring ground-based sources and sinks of anthropogenic pollution. The instrument was designed to take nadir observation of the reflected sunlight from Earth's surface and the atmosphere. The nadir viewing geometry mode of Argus is of particular significance as this observation mode provides the highest spatial resolution on the bright land surfaces and is expected to return more useable soundings in regions that are partially cloudy or have significant surface topography. The counts of 138 near infrared channels, corresponding to the spectral range of 0.9-1.7 µm, are logged.
From low Earth orbit, an instantaneous spatial resolution of 1.25 km is achieved (Jagpal, 2011).
Traditionally, the Argus1000 Spectrometer has been used as an atmospheric monitoring spectrometer, collecting data regarding the vertical columns of important atmospheric trace gases such
as carbon dioxide ( ) and water vapour ( ). Other
greenhouse gas species such as nitrous oxide ( ), hydrogen
fluoride (HF), methane ( ) and carbon monoxide (CO) can also be monitored [16]. The instrument can also be used for biological purposes as organic molecules containing aliphatic O-H, C-H, and C-O bonding exhibit absorption bands in the 1.7 µm region (Thoth Technology, 2010).
The capacity of infrared spectroscopy aids in predicting soil properties. These properties are important in assessing soil health and fertility and have direct effects on potential agricultural practices and land degradation.
2. MATERIALS AND METHODS
2.1 UAV Platform
The UAV platform consists of the UAV hardware and the scientific payload. The UAV is comprised of low-cost, easily available commercial off-the-shelf (COTS) components. Its main purpose is to safely fly the scientific payload for a minimum of ten minutes fly time. The platform is controlled by the UAV pilot and has safety features programmed into it, such as a return to home function.
2.1.1 UAV hardware: The main chassis for the UAV is the 3DR-Y6 frame set. This features a diagonal wheelbase of 550 mm which is used to mount the UAV and payload hardware and three arms of 216 mm length each. The system is comprised of battery powered vertical take-off and landing (VTOL) UAV with 6 motors. The 880Kv motors and 30A electronic speed controllers (ESC) were chosen to be able to deliver a strong lift and ability for the UAV to carry the payload without fail during the flight. The arms are constructed from PA66+30GF material which is known to be resistant to breakage in case of crashing, while the diagonal wheelbase is base is constructed from PCB material.
The landing gear used is the AeroXcraft DJI F550 Landing Gear Set. This is a high crash resistant landing gear made from G10 and aluminum construction (AeroXcraft). G10 laminate grades are produced by inserting continuous glass woven fabric impregnated with an epoxy resin binder while forming the sheet under high pressure. This material is used exhibits excellent mechanical and dimensional stability (Polymer Plastics). The landing gear offers .12 m of space to mount equipment and has large aluminum rails for landing.
on-board computer and then confirmed through the accompanying sensors. When the UAV is placed into attitude hold, the science platform is held in nadir-viewing position. The UAV pointing control mechanism is modeled after Quine's work (2001) where a microprocessor controller derives real-time estimates of gondola attitude, employing an extended Kalman filter to combine gyro, magnetometer, tilt-sensor, and shaft-encoder information.
2.1.2 Science Payload: The UAV science payload consists of an Argus 1000 micro-spectrometer and its associated data acquisition system (DAQ) and power system. The Argus 1000 micro-spectrometer measures 45 mm x 50 mm x 80 mm and has a variable integration time from 500 µs to 4.096 seconds. It features a narrow field of view of 0.15°. The data delivered by the instrument is of fixed length parity striped packets of spectra which include sequence number, temperature, array temperature and operating parameters (Thoth Technology, 2011).
The Argus 1000 is mounted in a nadir viewing position in order to mimic spectral data taken from CanX-2. A GoPro camera is placed next to the instrument, also in the nadir facing position in order to ensure its imagery pixels overlap the Argus’ field of
view. The Argus 1000 is controlled and it’s outputs data logged
by a BeagleBone Black. The BeagleBone Black was chosen for its simplicity, light mass, and ease to program and control remotely using an XBee radio module. The data is saved to a micro-SD card. The Argus and DAQ are powered by a Ravpower 15000 mAh portable cell phone charger which outputs 5 V at 2.4 A and can last approximately four hours on a full charge. The full mass of the UAV comes to 2625 g and the detailed mass of each component can be seen in Table 1.
Item Mass (g)
Y6 frame incl. motors, ESCs and propellers 478
F550 Landing Gear 270
BeagleBone Black and power cable 60
GoPro Hero 3+ with Protective Case 300
RAV Power 15000mAh External Battery
330
Kypom 4S 5100mAh Battery 480
Argus1000 Spectrometer 230
Argus1000 Cable 20
DJI NAZA V2 System 95
FPV TX/RX and Cloverleaf Antenna 88
Flytrek Core Flight Logger 4
Misc. Items 270
Total 2625
Table 1. UAV Mass Breakdown
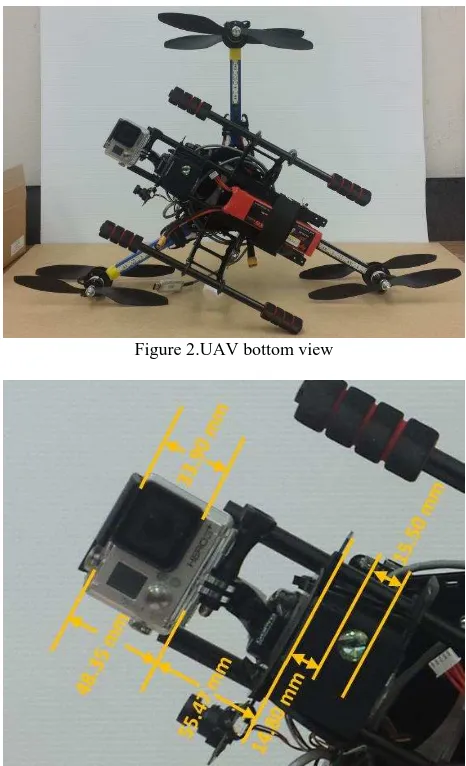
The bottom view of the UAV is showcased in Figure 1. The placement of the GoPro and Argus spectrometer can be viewed, while detailed distance separation between these two components can be seen in Figure 2. This information is used in order to compute the pixel overlap of the Argus and GoPro field of view.
Figure 2.UAV bottom view
Figure 3. Detailed distance separation information
2.2 Field Campaigns
Two field campaigns occurred from mid-November 2014 to April 2015 on days with clear visibility, low winds, and no precipitation. The rules set out in the Canadian Aviation Regulations were adhered to and flight information (contact information, UAV model, description and geographical boundaries of operation) were sent into Transport Canada before each flight. The flights were performed in remote locations across coastline sources and across various surfaces.
For first field campaign, the main spectral targets were shallow water systems with clear coastline boundaries and bare patches of soil just outside of Toronto, Ontario. There was minimal wind and no snow or sleet precipitation occurred. The sky was partially overcast. The Argus 1000 was set with a 1.024 second integration time and high spectral sensitivity setting and while the nadir facing GoPro was programmed to continuously take imagery every 0.5 seconds. The UAV was flown at an altitude of approximately 10 m over the spectral targets.
second integration time and low spectral sensitivity, while the Go Pro still recorded imagery at every 0.5 seconds.
3. FIELD CAMPAIGN RAW DATA
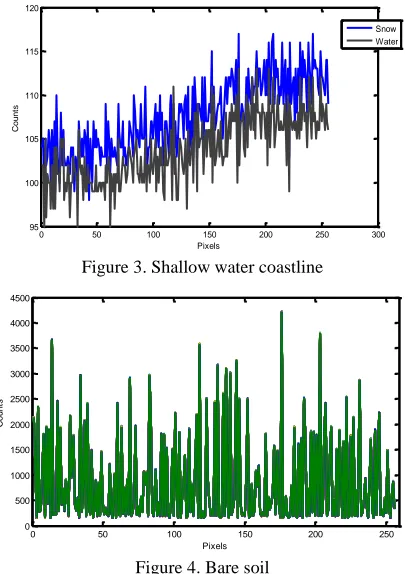
The field campaign was successful in retrieving the raw counts per pixel of the desired surfaces. In Figure 3 the raw counts per pixel are displayed for the coastline data which showcases the snow covered ground and the dark water. The counts per pixel are expected to be higher in the snow covered region as the snow will reflect the sunlight quite well and thus be a brighter course for the spectrometer causing more counts to be registered.
Figure 3. Shallow water coastline
Figure 4. Bare soil stems directly from the instrument’s integration time being lowered. As found previously, different types of surface are true for surfaces with larger albedo values.
Figure 5. Multiple surfaces
Figure 6. Deep water coastline
4. DISCUSSION
4.1 Radiance Conversion
All spectral imagery will need to be changed into corresponding radiance per wavelength values in order to perform detailed spectral analysis, including the confirmation of geolocation algorithms. Radiance conversion can be performed once the Argus 1000 instrument has been calibrated. The instrument must be calibrated in laboratory in order to properly convert the measurement of the detector array on Argus into radiance values. The calibration process involves using a light source, highly reflective screen, and the Argus spectrometer itself to detect a known amount of radiance using the spectrometer. The calibration of the Argus spectrometer involves using a halogen lamp source for validating the test procedure, followed by repeating the process using calibrated light source in order to minimize error in the calibration. The calibration procedure for Argus is based on the radiometric calibration procedure and equations provided in Jagpal (2011) and Kosch et al. (2003).
Figure 7. Block diagram for radiance calibration (Jagpal, 2011)
The spectral emittance of the halogen is a function of
wavelength , and temperature , and is given by
(1)
where = emissivity of the halogen filament
= speed of light
= Planck constant
=Boltzmann’s constant
The wavelength range of the spectrometer is known from the wavelength calibration experiment and converts the pixel numbers on the spectrometer to wavelength values. The spectral emittance can be calculated at each wavelength using this conversion and can then be used to determine the brightness of the spectralon screen. This is done using the following equation:
(2)
where = halogen lamp emitting area
α = screen albedo
= lamp to the screen distance,
= angle between the lamp and the spectrometer.
The power, , received by the instrument at each wavelength can then be calculated using Equation 3.
(3)
where ϕ = spectrometer field of view spectrometer
= spectrometer lens diameter
The amount of energy per count, , can then be determined using the Equation 4.
(4)
where = exposure time setting of the instrument
= number of detector counts at each wavelength
4.2 Comparison with CanX-2 Satellite Data
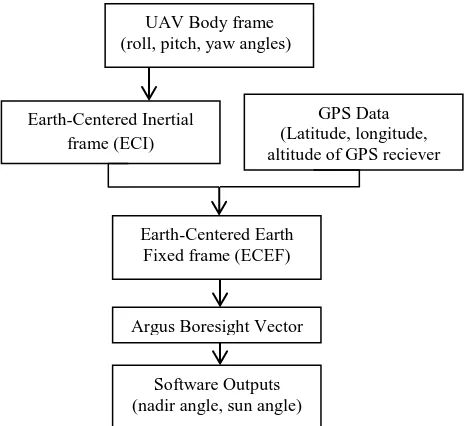
4.2.1 Geolocation Software: Both the UAV and CanX-2 raw data and spectral data will be compared during geolocation using the software designed and provided by Benari. The geolocation software determines how accurately aligned the instrument is to nadir by calculating the angle between the satellite position and instrument boresight vectors. In order to geolocate the data, both of the sets must be converted to the same frame of reference. Benari (2011) states how this is done for the satellite data. Similarly, the UAV body frame data is transformed according to the flowchart in Figure 8.
Figure 8. Flow-chart for UAV geolocation algorithm
GPS measurements allow the path of the UAV to be determined and mapped, an important step in the geolocation of the spectral data. The geolocation process involves determining the nadir and sun angles of Argus, which are required inputs for the coastline detection algorithm. This process begins by converting the roll, pitch, and yaw angles logged by the UAV at regular intervals into a transformation matrix that converts any
vector from the UAV’s body frame to Earth’s inertial frame.
The transformation matrix from the UAV body frame to the inertial frame is a 123 rotation about the roll axis, followed by the pitch axis, and then the yaw axis.
In order to find the nadir angle, the position vector of the UAV is required. This vector is found using the GPS latitude, longitude, and height measurements made at the same times as the attitude measurements. The latitude, longitude, and altitude are converted from the WGS84 frame to the Earth Centred Earth Fixed frame. The nadir angle is then determined by calculating the angle between the position vector from the spacecraft to the centre of Earth (as determined from the GPS data) and the Argus boresight vector.
The sun angle is determined by calculating the vector from the UAV to the Sun using on the algorithm detailed in the Astronomical Almanac. Once the sun vector is known, the sun angle is found by determining the angle between the sun vector and the z-axis of the UAV.
UAV Body frame (roll, pitch, yaw angles)
Earth-Centered Inertial frame (ECI)
GPS Data (Latitude, longitude, altitude of GPS reciever
Earth-Centered Earth Fixed frame (ECEF)
Argus Boresight Vector
Data from the CanX-2 mission will be specifically chosen in order to provide the maximum amount of comparative details. This includes choosing data based on the satellites pointing location, the Argus settings at which the spectra was taken at, amount of packets recorded and time of year. With the UAV and raw spectrometer data from the field campaigns, the geolocation and calibration processes can be performed. The results of these methods will be discussed later.
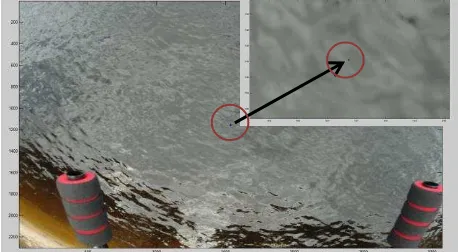
Figure 9. Argus Spectrometer: Dry Sand. Thoth Technology
Figure 10. Argus Spectrometer: Lake. Thoth Technology
The photographs taken by the nadir facing camera on the UAV are time stamped and correlated against the Argus data captured. The pixels captured by the Argus spectrometer are marked in order to relate surfaces to data sets. Figures 9 and 10 are examples of this. In Figure 9, the nadir facing camera has shown a flight over a section of dry sand while in Figure 10 a lake is showcased. In both figures the outline the Argus pixel overlay. The overlay is just viewable by eye as it is only is three pixel wide circle on the surface of the far larger nadir GoPro image.
5. CONCLUSIONS
A low cost, COTS UAV system was built as a scientific tool to perform remote spectral data collection. For areas where hand-collecting spectral imagery is not an option, the UAV provides an opportunity to log data in a quick and efficient manner. The UAV will continue to provide a good platform for remote spectral studies in the future and allow scientists a new method for acquiring remote spectra otherwise not obtainable.
The data collected can be used towards specifying further targets of interest for both continuing UAV and space-based viewing campaigns for data collection. All of the raw data is to be released online as part of a spectral data campaign.
The Argus settings for further UAV campaigns have been noted, as well as which settings allow for non-saturated raw data to be acquired.
ACKNOWLEDGEMENTS
Financial support for this research, including UAV platform development, was provided by the Canadian Space Agency.
D. Vrekalic’s guidance was instrumental in aiding to design a
UAV system that would be rugged enough to perform field work and gentle enough for a beginner to fly. He also provided a safe and effective learning environment for the students involved.
The authors would also like to acknowledge the Lassonde School of Engineering at York University for encouraging excellent work.
REFERENCES
AeroXCraft. DJI F550 Landing Gear Set [F550-LG]:
AEROXCRAFT, Technology with Altitude. (n.d.).
http://www.aeroxcraft.com/landing-gear-c-13/dji-f550-landing-gear-set-p-20.html (March 12, 2015)
Archer, F., Shutko, A. M., Coleman, T. L., Haldin, A., Novichikhin, E., & Sidorov, I. 2004. Introduction, overview, and status of the Microwave Autonomous Copter System (MACS). Geoscience and Remote Sensing Symposium, 2004. IGARSS'04. Proceedings. 2004 IEEE Internationa. Vol. 5, pp. 3574-3576
Benari, G. 2011. “Geolocation Algorithms for Nanosatellite
Applications.” Diss. York University, Toronto.
Berni, J. A. J., et al. 2009. "Remote sensing of vegetation from UAV platforms using lightweight multispectral and thermal imaging sensors." Int. Arch. Photogramm. Remote Sens. Spatial Inform. Sci 38: pp.6.
Chao, Haiyang, et al. 2008."Band-reconfigurable multi-UAV-based cooperative remote sensing for real-time water management and distributed irrigation control." IFAC World Congress, Seoul, Korea.
Hakala, T., Honkavaara, E., Saari, H., Mäkynen, J., Kaivosoja, J., Pesonen, L., & Pölönen, I. 2013. Spectral imaging from
UAVs under varying illumination conditions. UAV-g2013, 4–6
September 2013, Rostock, Germany. Edited by G.
Grenzdörffer, & R. Bill. International Archives of the Photogrammetry, Remote Sensing and Spatial Information Sciences (XL-1/W2). International Society for Photogrammetry and Remote Sensing (ISPRS). doi: 10.5194/isprsarchives-XL-1-W2-189-2013.
Jagpal, Rajinder K. Calibration and Validation of Argus 1000
Spectrometer–A Canadian Pollution Monitor. Diss. York
University, Toronto.
Johnson, L. F., Herwitz, S., Dunagan, S., Lobitz, B., Sullivan, D., & Slye, R. 2003. Collection of ultra high spatial and spectral resolution image data over California vineyards with a small UAV. Proceedings of the 30th International Symposium on Remote Sensing of Environment, Vol. 20, pp.845-849.
Kosch, M. J., Makinen, S., Sigernes, F., Harang, O. 2003.
“Absolute Optical Calibration Using a Simple Tungsten Light Bulb: Experiment”. Proceedings of the 30th Annual European Meeting on Atmospheric Studies. pp. 50-54
Mac Arthur, A., Robinson, I., Rossini, M., Davis, N., & MacDonald, K. 2014. A Dual-Field-of-view Spectrometer System For Reflectance and Fluorescence Measurements
(Piccolo Doppio) and Correction of Etaloning. 5th International
Workshop on Remote Sensing of Vegetation Fluorescence.
Polymer Plastics. G10 FR-4 GLASS EPOXY COMPOSITE
LAMINATE MATERIAL. (n.d.)., from
http://www.polymerplastics.com/composite_g10.shtml (March 12, 2015)
Quine, B. M., Strong, K., Wiacek, A., Wunch, D., Anstey, J. A., & Drummond, J. R. (2002). Scanning the Earth's limb from a high-altitude balloon: The development and flight of a new balloon-based pointing system. Journal of Atmospheric and Oceanic Technology, 19(5), pp.618-632.
Rankin, Daniel, et al. 2005. "The CanX-2 nanosatellite: expanding the science abilities of nanosatellites." Acta Astronautica 57.2, pp. 167-174.
Revercomb, H. E., Smith, W. L., Best, F. A., Giroux, J., LaPorte, D. D., Knuteson, R. O., & Howell, H. B. 1996. Airborne and ground-based Fourier transform spectrometers for meteorology: HIS, AERI, and the new AERI-UAV. International Society for Optics and Photonics. SPIE's 1996 International Symposium on Optical Science, Engineering, and Instrumentation, pp. 106-117.
Saari, H., Pellikka, I., Pesonen, L., Tuominen, S., Heikkilä, J., Holmlund, C., & Antila, T. 2011. Unmanned Aerial Vehicle (UAV) operated spectral camera system for forest and agriculture applications. International Society for Optics and Photonics. SPIE Remote Sensing, pp. 81740H-81740H.
Sarda, K., Eagleson, S., Caillibot, E., Grant, C., Kekez, D., Pranajaya, F., & Zee, R. E. 2006. Canadian advanced nanospace experiment 2: Scientific and technological innovation on a three-kilogram satellite. Acta Astronautica, 59(1), pp. 236-245.
Thoth Technology. 2010. Argus 1000 Owner’s Manual.
Turner, D., A. Lucieer, and C. Watson. 2011. "Development of an Unmanned Aerial Vehicle (UAV) for hyper resolution vineyard mapping based on visible, multispectral, and thermal imagery." Proceedings of 34th International Symposium on Remote Sensing of Environment.
Valencia, E., Acevo, R., Bosch-Lluis, X., Aguasca, A., Rodriiguez-Alvarez, N., Ramos-Perez, I., & Camps, A. 2008. Initial results of an airborne light-weight L-band radiometer. Geoscience and Remote Sensing Symposium, 2008. IGARSS 2008. IEEE International (Vol. 2, pp. II-1176).
von Bueren, S. K., Burkart, A., Hueni, A., Rascher, U., Tuohy, M. P., & Yule, I. J. 2015. Deploying four optical UAV-based
sensors over grassland: challenges and limitations.
Biogeosciences, 12(1), pp.163-175.