AUTOMATIC URBAN ILLEGAL BUILDING DETECTION USING MULTI-TEMPORAL
SATELLITE IMAGES AND GEOSPATIAL INFORMATION SYSTEMS
N. Khalili Moghadam a, *, M. R. Delavar b and P. Hanachee c
a MSc. Student, GIS Dept., School of Surveying and Geospatial Eng., College of Eng., University of Tehran, Tehran, Iran -
b Centre of Excellence in Geomatic Eng. in Disaster Management, School of Surveying and Geospatial Eng., College of Eng.,
University of Tehran, Tehran, Iran - [email protected]
c School of Urban Planning, College of Fine Arts, University of Tehran, Tehran, Iran - [email protected]
KEY WORDS: Automatic illegal building detection, building infractions, multi-temporal satellite images, K-means, Geospatial Information System
ABSTRACT:
With the unprecedented growth of urban population and urban development, we are faced with the growing trend of illegal building (IB) construction. Field visit, as the currently used method of IB detection, is time and man power consuming, in addition to its high cost. Therefore, an automatic IB detection is required. Acquiring multi-temporal satellite images and using image processing techniques for automatic change detection is one of the optimum methods which can be used in IB monitoring. In this research an automatic method of IB detection has been proposed. Two-temporal panchromatic satellite images of IRS-P5 of the study area in a part of Tehran, the city map and an updated spatial database of existing buildings were used to detect the suspected IBs. In the pre-processing step, the images were geometrically and radiometrically corrected. In the next step, the changed pixels were detected using K-means clustering technique because of its quickness and less user’s intervention required. Then, all the changed pixels of each building were identified and the change percentage of each building with the standard threshold of changes was compared to detect the buildings which are under construction. Finally, the IBs were detected by checking the municipality database. The unmatched constructed buildings with municipal database will be field checked to identify the IBs. The results show that out of 343 buildings appeared in the images; only 19 buildings were detected as under construction and three of them as unlicensed buildings. Furthermore, the overall accuracies of 83%, 79% and 75% were obtained for K-means change detection, detection of under construction buildings and IBs detection, respectively.
* Corresponding author.
1. INTRODUCTION
Nowadays we are faced with significant growing trend of urban population. To meet the need for housing of these increased populations, many new buildings need to be constructed every year. Obviously, constructing a new building requires the municipality permission. However, unfortunately some of the constructors do not get building permission which ends in non-rigid buildings. Furthermore, some of the permitted buildings commit building infractions which are against the rules of construction.
Building infractions is an important issue for municipalities which can threaten the building structures in a city (Saremizadeh, 2012). The current method of IB monitoring which is used in Iran is based on presence of human operator. This outdated method is time consuming and causes exorbitant costs for municipalities. Also it sometimes ends in collusion between inspectors and constructors. However, the IBs detection should be considerably cost effective and fast to prevent the continuation of construction. Therefore, existence of an efficient method of IB monitoring is necessary to reduce the costs, time and man power. This method should be automatic and quick.
Accurate, precise and up to date spatially referenced information is required for proper management and planning in IB monitoring and undertaking precautionary measures
required. Acquiring multi-temporal satellite images and using image processing techniques for automatic change detection is one of the optimum methods which can be used in IB monitoring (Bayburt et al., 2008) that has not been popularly implemented in Iran so far.
On one hand, automatic IB monitoring causes significant cost reduction compared to that of currently used methods and on the other hand, it reduces man power and consequently, the collusion between municipal inspectors and constructors. Extensive researches have been undertaken in the area of building detection. However, a few studies have been reported in the field of IB detection. The main deference of the mentioned studies is the method of building change detection. Ahmad (2005) detected the changes in high density urban and rural areas using multi-temporal high resolution IKONOS satellite images. He made the images orthorectified in order to make the image measurements consistent with the ground measurements. Benedek et al. (2010) introduced a probabilistic approach of building extraction in remotely sensed images. They also constructed a flexible hierarchical framework which can create various building appearance models from different elementary feature based modules. Chen et al. (2014) proposed an effective method to extract buildings in high-resolution remote sensing images based on shadow detection. After detection of the shadow regions and according to the positions of the shadows, they developed an adaptive strategy for seed
location and regional growth to accomplish the course detection of buildings. Karantzalos et al. (2015) developed a model based on building detection technique which was able to extract and reconstruct buildings from Unmanned Aerial Vehicles (UAV) aerial imagery and low-cost imaging sensors. Zhu et al. (2015) presented a feature line based method for building detection and reconstruction from oblique airborne imagery. They concluded that low quality model can be refined by the accuracy improvement of mesh feature lines and rectification with feature lines of multi-view images. Singhal and Radhika (2014) proposed a method for detecting the buildings from high resolution colour aerial images using colour invariance property and canny edge detection technique. Kovacs and Sziranyi (2012) developed a method to extract automatically the buildings regardless of shape in order to increase the accuracy of building detection. Xu et al. (2013) proposed an approach to automatically detect and classify changes in buildings from two epochs of airborne laser scanner data which verifies the changes by making rules on the difference image map. Then, they classify changes belonging to buildings in the difference image map to detect IBs. Hermosilla et al. (2011) compared and evaluated two main approaches including threshold-based and object-based classification for automatic building detection and localization using high spatial resolution imagery and LIDAR data. Pang et al. (2014) proposed an automatic method that applies object-based analysis to multi-temporal point cloud data to detect building changes. Their aim was to identify areas that have changed and to obtain from-to-information. Bayburt et al. (2008) detected the IBs around the Istanbul water catchments using pansharpened IKONOS images with 3 months repetition rate in the Greater Istanbul municipality area.
As already mentioned, the urban IB detection has been less investigated compared to land use change detection. Although, some methods have been proposed to detect the IBs, the IBs were not successfully detected in the suburban areas meaning that the results were not satisfactory quantitatively. On the other hand, detection of IBs in the urban areas was not much discussed so far. Therefore, it is decided to present an automatic IB detection method using the city map, multi-temporal satellite images and an up to date municipal property database in the urban areas in this research.
In this research the aim is to present an automatic method of IB detection which is fast enough and cost effective. Therefore, an automatic IB detection method using multi-temporal satellite images and the spatial up to date database has been proposed in this paper. In this method, Buildings under construction are detected automatically. Then, some queries and retrieval capabilities are investigated from the municipal property database to identify the detected buildings as the licensed/illegal ones.
In section 2, the methodology of the research is presented. Section 3 illustrates a case study undertaken in the part of west of Tehran. Finally, section 4 concludes the paper.
2. METHODOLOGY
Building infractions are breaking the laws and regulations of urban development in building construction. Ambiguity in the laws and regulations of building construction is one of the building infractions main reasons (Saremizadeh, 2012). Building infractions can be classified into indoor and outdoor infractions. Parking infractions, non-rigid buildings, changing the architectural maps, changing stairs and elevator dimensions, changing the balcony and terrace dimensions, the non-standard space between the adjacent neighbors, and the supervisor
infractions are some of the indoor infractions. Also, IBs (the building without municipality permission), constructing beyond municipality permission, changing the landuse, building in gas and oil pipelines buffer areas and building in water catchment areas (Bayburt et al., 2008) and power lines buffer areas are some of the outdoor infractions which can be monitored automatically with the presence of human power.
It is possible to monitor outdoor infractions without the physical presence of human operator, using multi-temporal satellite images, automatic change detection and a geospatial information system consisting of the building information. In this research, an automatic method of IB detection, using the change detection techniques has been proposed.
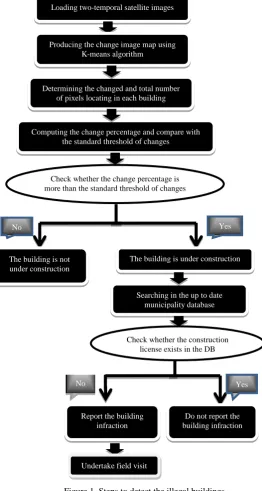
In this paper, several steps were coded in MATLAB software in order to detect the IBs. In the first step, the two satellite images which have been geometrically and radiometrically corrected were loaded to software. In the second step, the images were clustered to two changed and unchanged spatial segments using K-means clustering algorithm by a difference operator. Consequently, a change image map is produced. In the third step, the changed pixels and the total number pixels which located in each polygon were determined using the produced changed image map and the city map in which, the location of each building was determined. In the fourth step, the change percentage for each building was computed separately by calculating the ratio of changed pixels to total number of pixels of each building. Then, a condition was checked that if the computed percentage was more than the standard change threshold, the building was considered as under construction. In the fifth step, after detecting the buildings which were under construction, the software was connected to an up to date database of municipality of Tehran and checked whether the detected buildings had the permission to be constructed or not. If the detected building did not have the construction construction. As we want to detect the changes, two clusters of changed and unchanged, are considered to clustering the whole image.
Data clustering is a data exploration technique that allows objects with similar characteristic to be grouped together in order to facilitate their further processing (Pham et al., 2005). The K-means clustering algorithm is a popular clustering method which is considered as a simple method for estimating the mean (vectors) of a set of K-groups. This method’s aim is to partition unlabeled data into K classes (Hartigan and Wong, 1979; Pham et al., 2005). To use this method requires the number of clusters in the data to be pre-specified (Pham et al., 2005).
A typical version of the K-means algorithm runs in the following steps (Campbell, 2006): firstly, the number of clusters should be determined. Secondly, the initial cluster seeds are chosen randomly or consciously using some available a prior knowledge. These seeds represent the temporary means of the clusters. Choosing the seeds of two clusters is shown in Figure 2.
Figure 1. Steps to detect the illegal buildings
In the next step, the squared Euclidean distance from each object to each cluster is computed and each object is assigned to the closest cluster. Figure 3, shows allocating the objects to the nearest cluster after the computation of the squared Euclidean distance of each object from the seeds clusters.
Then, for each cluster the new centroid is computed and each seed value is replaced with the respective cluster centroid. These new seeds are computed by calculating the mean for all allocated objects of each seeds. Afterwards, the squared Euclidean distance from an object to each cluster is computed, and the object is assigned to the cluster with the smallest squared Euclidean distance. Consequently, the cluster centroids are recalculated based on the new membership assignment. Finally, the previous step is repeated until no pixel moves the clusters meaning that the difference between the new centroid of clusters and the old one should be less than the defined threshold.
If (| New Si - Old Si |< T) => pixel does not move (1)
where New Si = New centroid of cluster i Old Si = Old centroid of cluster i T = The considered threshold
Figure 2. Choosing the cluster seeds
Figure 3. Allocating each object to the nearest cluster
3. CASE STUDY
The study area of this research is a part of west of Tehran metropolitan area which covers 580.125 hectares located between 515521.5 E, 518284 E and 3953093 N, 3955193 N, UTM Zone 39N. Tehran, the capital of Iran, is a mega city having more than eight million inhabitants which is the most populated city of Iran. Considering enormous building constructions, the building infractions will be occurred, meaning that a good sabbatical is provided for IB detection in this city. Obviously, as the currently used method of IB detection (field visiting) is costly, time consuming and insufficient, employing an automatic IB detection is needed. Therefore, we have proposed an automatic IB detection using multi-temporal satellite images.
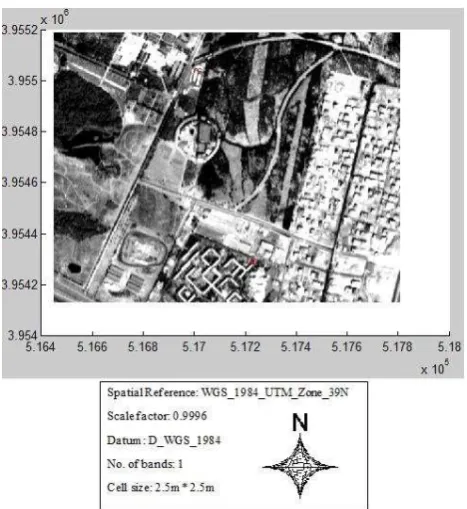
In this research, two-temporal panchromatic satellite images of IRS-P5 with the spatial resolution of 2.5 Meters acquired at June 3, 2010 and October 3, 2010, respectively from the west of Tehran, and the city maps at a scale of 1:2000 were used in order to detect building infractions and building under construction. In addition, an up to date municipal property database that contains the existing buildings of the study area was used to develop a geospatial information system.
The two-temporal images and the city map are shown in Figures 4, 5, and 6, respectively.
Loading two-temporal satellite images
Producing the change image map using K-means algorithm
Determining the changed and total number of pixels locating in each building
Computing the change percentage and compare with the standard threshold of changes
Check whether the change percentage is more than the standard threshold of changes
Yes No
The building is under construction The building is not
under construction
Searching in the up to date municipality database
Check whether the construction license exists in the DB
Yes No
Report the building infraction
Do not report the building infraction
Undertake field visit
Figure 4. The first geo-referenced image of the study area acquired at June 3, 2010
Figure 5. The second geo-referenced image of the study area acquired at October 3, 2010
Finally, all steps namely K-means unsupervised clustering technique, detecting of all changed pixels of each building, comparison of change percentage of each building with standard threshold of changes, and detecting the infracted buildings were coded in MATLAB software to detect IBs of the study area.
Radiometric and geometric pre-processing have been undertaken on the original images. In fact, three main errors can be occurred in a satellite image, namely sensor errors, geometric errors, and radiometric errors (Campbell, 2006). The sensor error is directly depends on the sensor quality. However, the
geometric one is related to the changes between images or map coordinate systems. Also, the radiometric errors depend on atmosphere effects, topographic effects, and changing the angle of image acquisition (Campbell, 2006).
Figure 6. The buildings location in the city map
In this research, sensor error correction was already undertaken. However, for geometric correction, the first image was geo-referenced with the city map with the second degree polynomial method and a bilinear resampling using 19 ground control points (GCPs) with the accuracy of 1.63 Meters. Then, the second image was co-registered with the first image using the mentioned method using 21 GCPs with the accuracy of 1.17 Meters. It should be noted that, the GCPs were homogenously distributed all over the image to correct the images.
The images were radiometrically corrected with the normalization technique which is considered as a relative radiometric correction method. The mentioned method has some advantages in comparison with other ones, namely it does not need the atmospheric data at the image acquisition time (Campbell, 2006).
Change detection in multi-temporal satellite images with supervised and unsupervised methods is applicable. In unsupervised methods, detecting the changed pixels is done without user intervention. Currently, one of the most widely used unsupervised methods is the K-means technique which is implemented in this research.
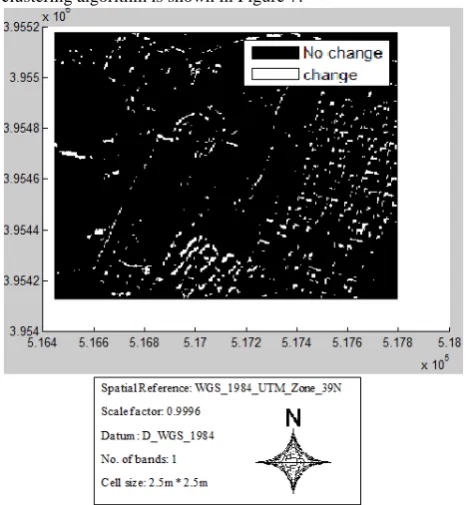
In the implementation of K-means clustering technique as an automatic and unsupervised change detection method, at first, with pixel-to-pixel comparison and using subtract operator, a difference image was produced. Then, the two clusters of changed and unchanged were considered in order to cluster the whole satellite image. As detecting the changes in multi-temporal satellite images was essential in this research, it was decided to consider these two clusters. In the next step, the pixels were clustered in an iterative process until no pixel
moves the clusters. The changed image map using K-means clustering algorithm is shown in Figure 7.
Figure 7. The change image map produced using K-means clustering algorithm
The changed and unchanged pixels are shown with white and black colours in Figure 7, respectively. As it can be seen, the number of unchanged pixels are much more than the changed ones because of a few changes in building construction in the four months period.
Since we used a city map at the scale of 1:2000, the location of each building is specified in the employed geo-referenced coordinate system. Therefore, we could determine the whole pixels locating in each polygon. We determined the number of changed and unchanged pixels of each building by using the city map and the produced change image map using K-means technique. Then, the change percentage for each building was computed by calculating the ratio of changed pixels to total number of pixels of each building. This percentage was calculated for all of the buildings located in the study area.
C.P.i = (1)
where Ci =the number of changed pixels locating in building i Ti = the total number of pixels locating in building i C.P.i = the change percentage of building i
The construction rules are approximately different in every district of the municipality. In fact, in every district of the municipality, the buildings are permitted to be constructed with a specified percentage of the total building area. According to the municipality rules of the study area, buildings construction density is 60% which means that the 40% of the total area of property should be yard. Obviously, construction in the yards is forbidden. Therefore, in order to detect the buildings which are under construction, we considered 40% threshold, meaning that
if the change percentage of a building is more than the threshold, that building is detected as a suspicious point.
If (C.P.i > 40%) => building i is a suspicious point (2) Otherwise => building i is not a suspicious point
This threshold assures us that if any change happens in the yard or in the building of any house, that house is introduced as a suspicious point.
The detected changed building (red colour) is shown in Figure 8.
Figure 8. The detected changed building (Red colour)
The Municipality of Tehran has a comprehensive property database (DB) which contains the total buildings location and information. Each building has its own unique identification numbers (IDs) in the DB, meaning that the information of each building can be easily accessed. On the other hand, we can easily access to the buildings which have applied to get the construction license from the municipality. Thus, the DB was searched to find out whether those suspicious under construction buildings had the construction license or not. Consequently, the illegal buildings were detected by this comparison which means that if an under construction building does not have the construction license, that building is detected as unlicensed and suspected building which has to have a field visit to verify the report.
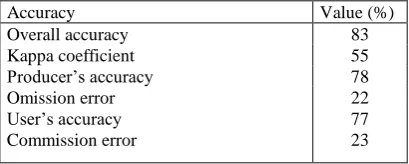
Finally, for the evaluation, the overall accuracies of K-means change detection, detection of under construction buildings and IB detection were computed. The overall accuracy is the mean of clustering accuracy. It is the ratio of correctly classified objects (pixels) to total number of objects (pixels) (Campbell, 2006). This parameter of accuracy assessment is computed using the error matrix.
In addition, the kappa coefficient, producer’s accuracy, user’s accuracy, omission error and commission error were computed for the K-means clustering technique. The kappa coefficient calculates the clustering accuracy compared to a totally random clustering (Campbell, 2006). The producer’s accuracy is the ratio of diagonal element of each cluster to the total value of each column of error matrix. Also, the user’s accuracy is the
ratio of correctly clustered pixels to the total value of each row of error matrix (Campbell, 2006). Furthermore, the omission and commission errors represent the completeness of the DB.
4. CONCOLUSION
An automatic method of IB detection using the multi-temporal satellite images, city map and a property database of buildings in the urban area was proposed in this paper. IB detection is an issue which was discussed mostly in suburban areas. However, we could detect some of the IBs in the urban areas using the city map, the municipality DB and field visit.
The results of the proposed method in this research were compared with the field data and accordingly the overall accuracy and kappa coefficient were computed. In detecting of the IBs, the overall accuracy of 83% and the kappa coefficient of 55% were obtained for K-means clustering algorithm. In this research, different accuracy measures are computed shown in Table 1.
Using K-means clustering algorithm and consideration of the changes percentage threshold, only 19 buildings were detected as under construction from the total number of 343 buildings appeared in the image. It indicates that approximately 6% of all buildings are changed during the four months period. This statistics verifies the fast growth of building construction. With consideration of the municipality statistics, 24 buildings were under construction at the study time. Thus, the buildings under construction were detected automatically using the proposed algorithm with the accuracy of 79% (19 out of 24). On the other hand, only four buildings were unlicensed in reality according to mentioned statistics. However, three buildings were detected as unlicensed buildings in this research with searching in the municipality DB. Therefore, the overall accuracy of 75% (3 out of 4) was obtained in detecting the unlicensed buildings. Furthermore, from the total 230112 pixels of the images, 9456 pixels were detected as changed pixels. It should be noted that, from the total number of change detected pixels, only 1577 pixels were related to the buildings.
The results demonstrated that most of the urban IBs can be detected automatically using the proposed method. However, this method was unable to detect the whole IBs in which, five IBs were undetected based on the available statistics. Therefore, field visit is required to complete the job. In fact the proposed importance for municipality, the satellite images with shorter period should be used in order to more efficiently detect the IBs.
ACKNOWLEDGEMENTS
The support of National Geographical Organization (NGO) for providing the two-temporal panchromatic satellite images and Tehran municipality for the statistics of building construction, the city maps and the municipal property DB is highly appreciated.
REFERENCES
Ahmad, A., 2005, Change detection in high density urban area and rural area using high resolution satellite image, MSc. Thesis, Faculty of Civil Engineering, Atilim University, Ankara, Turkey.
Bayburt, S., Buyuksalih, G., Baz, I., 2008, Detection of changes in Istanbul area with medium and high resolution space images, The International Archives of the Photogrammetry, Remote Sensing and Spatial Information Science. Vol. XXXVII. Part B7. Beijing, pp. 1607-1612.
Benedek C., Descombes, X., and Zerobia, J., 2010, Building detection in a single remotely sensed image with a point process of rectangle, Proc. International Conference on Pattern Recognition (ICPR), Research Report 7143, INRIA, Sophia Antipolis, 5 May, pp. 1-4.
Campbell, J., 2006, Introduction to Remote Sensing, 4th Edition, Guilford Press, 626 p.
Chen, D., Shang, S., and Wu. C., 2014, Shadow-based building detection and segmentation in high resolution remote sensing images, Journal of Multimedia, Vol. 9, No. 1, pp. 181-188.
Hartigan, J. A., Wong, M. A., 1979, Algorithm AS 136: A K-means clustering algorithm, Journal of Royal Statistical Society. Series C (Applied Statistics), Vol. 28, No. 1, pp. 100-108.
Hermosilla, T., Ruiz, L. A., Recio, J. A., and Estornell, J., 2011, Evaluation of automatic building detection approaches combining high resolution images and LIDAR data, International Journal of Remote Senseing, Vol. 3, pp. 1188-1210.
Karantzalos, K., Koutsourakis, P., Kalisperakis, I., and Grammatikopoulos, L., 2015, Model-based building detection from aerial low-cost optical sensors onboard Unmanned Aerial Vehicles, The International Archives of the Photogrammetry, Remote Sensing and Spatial Information Science. Vol. XL-1/W4, pp. 293-297.
Kovacs, A., and Sziranyi, T., 2012, Orientation based building outline extraction in aerial images, ISPRS Annuals of the Photogrammetry, Remote Sensing and Spatial Information Sciences, Vol. 1-7, Melbourne, Australia, pp. 141-146.
Pang, S., Hu, X., Wang, Z., and Lu, Y., 2014, Object-based analysis of airborne LiDAR data for building change detection, International journal of Remote Senseing, Vol. 6, pp. 10733-10749.
Pham, D. T., Dimov, S. S., and Nguyen C. D., 2005, Selection of K in K-means clustering, Manufacturing Engineering Science, Cardiff, UK, Vol. 219 Part C, pp. 103-119.
Saremizadeh, M. F., 2012, Complete sets of rules and regulations relating to the municipality, Municipality of Shiraz, Shiraz, Iran.
Singhal, S., and Radhika, S., 2014, Automatic detection of buildings from aerial images using color invariant features and canny edge detection, International Journal of Engineering Trends and Technology, Vol. 11 No. 8, pp. 393-396.
Xu, S., Vosselman, S., and Elberink, O., 2013, Detection and classification of changes in buildings from airborne laser scanning data, ISPRS Annuals of the Photogrammetry, Remote Sensing and Spatial Information Sciences, Vol. II-5/W2, Antalya, Turkey, pp. 343-348.
Zhu, Q., Jiang, W., and Zhang, J, 2015, Feature line based building detection and reconstruction from oblique airborne imagery, The International Archives of the Photogrammetry, Remote Sensing and Spatial Information Science. Vol. XL-4/W5, pp. 199-204.