before. It demands a parsimonious approach to research, with the aim of enabling robust decisions to be made with the minimum of new information. Our approach to these problems has been to develop generic analytical tools, which in turn are used to foster collaboration through joint model development, testing and application. This collaboration is achieved through a workshop and networking process to establish ‘CLIMEX’- or ‘DYMEX’-Modelling Networks, and to extend the information to the wider com-munity using the world wide web (WWW) (http://www.ento.csiro.au/research/pestmgmt/IPMModellingNetwork/index.htm). In this paper we outline key features of these modelling approaches and illustrate a ‘hypothesis-driven’ approach to climate-matching, using CLIMEX (http://www.ento.csiro.au/research/pestmgmt/climex/climex.htm) that contrasts with the usual, statistically based, pattern-matching of meteorological data without consideration of possible mechanisms that limit the geo-graphical distribution. We illustrate the nature of a generic and modular simulation model built using DYMEX (http://www.ento. csiro.au/research/pestmgmt/dymex/dymexfr.htm), but emphasize the urgency for the scientific community to collect the data necessary to build reliable population models. We summarize results and conclusions from a global change workshop based on the use of both these software tools. They illustrate the advantages of the proposed approach as a means of building col-laborative international research communities, which are able to avoid repetition by contributing their modules into a library of functions for sharing with other users. © 2000 Elsevier Science B.V. All rights reserved.
Keywords: CLIMEX; Risk assessment; Multi-trophic impacts; DYMEX; Modelling workshops; Collaborative networks; Climate change
1. Introduction
There are major gaps between the actual and at-tainable yields of crops, attributable largely to pests, diseases and weeds (Oerke et al., 1994). In global change research, estimates of crop yields using simu-lation models also suffer from major gaps between the observed and predicted yields (Landau et al., 1998). Furthermore, invertebrates, plant pathogens and weeds (referred to collectively here as ‘pests’) are highly
∗Corresponding author.
adapted to change and so are prime targets for risk assessments in global change research.
The Intergovernmental Panel on Climate Change (IPCC) has developed a process for estimating the vulnerability to climate change of regions and indus-tries (Parry and Carter, 1998). Vulnerability is de-termined by the sensitivity of the system to impacts, taking adaptation options into account. This approach recognises that mankind will inevitably implement management responses to change wherever possible, so assessment of risks in the absence of consideration of adaptation is not realistic for a managed system, at least.
Vulnerability=Sensitivity(1−Adaptive management)
where ‘Sensitivity’ is the impacts in the absence of adaptation and ‘Adaptive management’ the response options as determined by the sustainability and ro-bustness of available and putative management tools (Sutherst et al., 1998).
The process described above has proved to be very appropriate for use on pests, diseases and weeds. Sutherst (2000) described a conceptual framework for studying the effects of invasive species under global change. This framework incorporates ap-proaches from the IPCC, and the quarantine pest risk (International Plant Protection Convention, IPPC) and plant pathology communities. Sutherst et al. (2000) applied the IPCC approach in an assessment of the vulnerability to climate change of differ-ent horticultural industries and growing regions in Australia.
The research issues facing global change research-ers, policymakers and managers of pests were reviewed by Sutherst et al. (1996a). In summary, there is less support available for climate change research than is allocated to the solution of problems of im-mediate concern. This is despite the initial need for global change research to understand current prob-lems better. Such research will provide a true baseline as well as an understanding with which to enhance risk assessments and the design of both current and future management options. Other research issues are that risk assessments often involve multiple in-teracting drivers of change, which degrade the value of isolated assessments. Furthermore, outputs relate mostly to the policy-level, which means regional, national or global scales involving industries or re-gions. Policy questions focus on defining impacts and vulnerability, via a combination of regional/industry scale sensitivity analysis and evaluation of adaptation options. Results of risk assessments have to be trans-lated into socio-economic measures in order to be meaningful for policymakers. These demands are not matched by available resources and therefore need a degree of pragmatism if they are to be addressed in the foreseeable future.
The scientific community involved in biological research needs some common data sets, analytical tools and languages to facilitate collaboration. The uncertainty of future global change scenarios and
our inability to conduct large-scale experiments on impacts of global change have forced reliance on models to explore possible impacts. Global research networks are also needed to gain leverage through collaboration and information sharing. The Global Change and Terrestrial Ecosystems Program (GCTE) of the International Geosphere Biosphere Program (IGBP) has a number of crop and soil networks (Ingram et al., 1999) and is developing a pest and disease network (Sutherst et al., 1996b; Scherm et al., 1999). The crop modelling community has already made progress in developing international collabora-tive research groups, which run model comparison exercises in a push to improve the models for use in global change research (Landau et al., 1998; In-gram et al., 1999). The partnership has been assisted by the previous collaborative network built around the use of the DSSAT model (http://agrss.sherman. hawaii.edu/dssat/index.htm). In contrast the pest re-search community faces different challenges with its large number of pest communities that vary greatly in composition in different regions and on different crops, making it less appropriate to focus collabora-tion on particular species. Thus GCTE has focussed effort initially on developing generic approaches to the assessment of risks under global change (Sutherst et al., 1996a; Scherm et al., 1999), while recognising the need to increase effort in experimentation and monitoring activities.
Two modelling tools are discussed here, namely CLIMEX (Sutherst et al., 1999), a tool for modelling species’ responses to climate, and DYMEX (May-wald et al., 1997, 1999), a generic and modular mod-elling toolkit designed for biologists. Both CLIMEX and DYMEX offer the advantage that the models or modules that they create can be readily shared with other users to avoid the need for wasteful repetition of effort.
2. A biological toolkit for global change
Given the range of demands, the variable nature of the available data, and the logistics involved in a detailed simulation modelling analysis, a hierarchy of data and tools is necessary (Sutherst et al., 1996a). The data range from expert opinion through qualitative ob-servations to rigorous, quantitative data on biological processes or states. Software tools range from expert systems through pattern-matching tools for matching climate or vegetation types to very simplified sim-ulation models like CLIMEX or process-based (i.e. mechanistic) population and community models.
Population or ecosystem dynamics models pro-vide the most comprehensive method for quantifying likely future adaptation options but they require an order of magnitude more data and effort than more pragmatic approaches. Their use will therefore be re-stricted to key problems with sufficient resources to collect the necessary data. For most other problems, there is a role for the less sophisticated approaches outlined above. Our proposed hierarchical ‘climate impacts toolkit’ (Sutherst et al., 1996a) is designed to meet the need for a range of analyses, includ-ing climate-matchinclud-ing and process-based modellinclud-ing. CLIMEX (http://www.ento.csiro.au/research/pestmg-mt/climex/climex.htm) and DYMEX (http://www. ento.csiro.au/research/pestmgmt/dymex/dymexfr.htm) are core features of our toolkit and some of their key features are described below.
The application of these two software tools in a ‘Modelling Workshop’ environment is illustrated using the results of the GCTE Global Change Work-shop on modelling global change impacts on pests in Bogor in 1998 (Sutherst et al., 1999). Other exam-ples are used to illustrate particular points where necessary.
els (Worner, 1991; Sutherst et al., 1995; Baker et al., 1996).
The attributes and applications of the CLIMEX modelling software have been extensively documented elsewhere (Sutherst and Maywald, 1985, 1999; Sutherst et al., 1995, 1999; Sutherst, 1998). It uses a combination of ‘growth’ and ‘stress’ indices to describe responses over the full range of climatic conditions that occur in different seasons in different places around the world. Experience with CLIMEX has shown how little biologists know about the role of climate in limiting species’ distributions. Sutherst et al. (1995) and Kriticos and Randall (2000) compared the different ways in which various climate-matching approaches matched climates. Rather than repeat a description of the model here, the opportunity is taken to highlight or elaborate on a number of features and issues related to CLIMEX and climate-matching that are not widely appreciated.
(1) It is often not possible to characterise the climatic requirements of a target species, such as when targeting a collection or release site for a little known biological control agent. CLIMEX provides a climate-matching facility — ‘Match Climates’ — that compares meteorological parameters from dif-ferent locations directly. It also allows the user to select which meteorological variable or period of the year to include when comparing data from different locations. This allows the user to explore a range of hypotheses on the factors limiting a species’ geo-graphical distribution when it is not feasible to model its growth and stress responses using the ‘Compare
Locations/Years’ model. For example, it is possible to
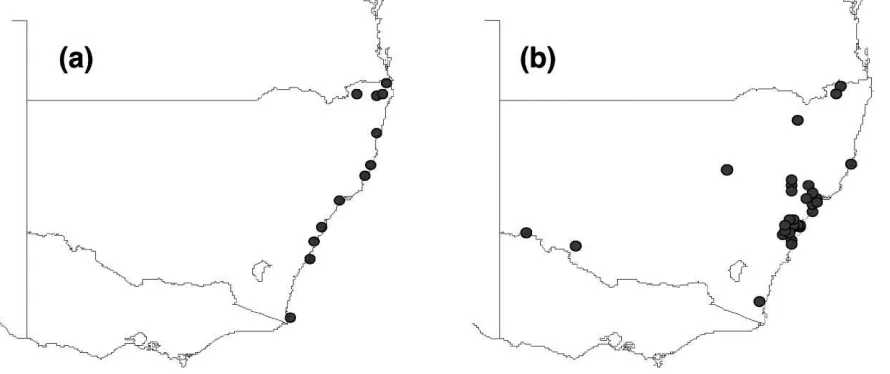
Fig. 1. CLIMEX ‘Match Climates’ index for Mt Tamborine in Queensland, Australia with locations in New South Wales: (a) winter minimum temperature, (b) winter maximum temperature.
using maximum winter temperatures, which would have a different physiological effect (Fig. 1). In the example, a species that can persist at Mt Tamborine in southern Queensland in Australia is projected to be able to colonise quite different regions depending on whether it is limited by minimum temperatures or by a lack of thermal accumulation during winter.
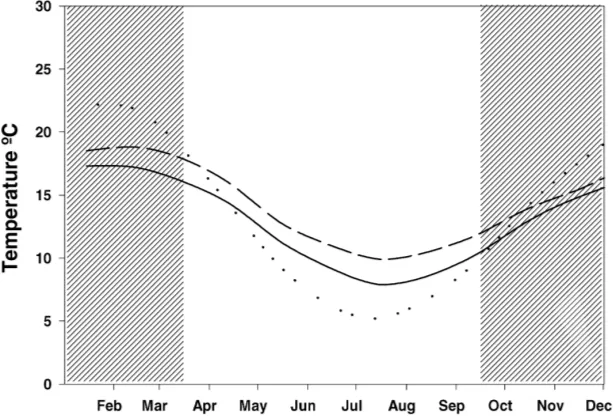
Caution is needed when comparing climates be-cause the CLIMEX ‘Match Climates’ match index does not currently indicate the direction of differences between the target and matched locations. For exam-ple, the winter minimum temperatures of a matched location (Tibooburra, NSW) may be colder than the target location (Mt Tamborine) but have the same match index (0.68) as a warmer location (Port Kem-bla, NSW) as shown in Fig. 2. It is therefore necessary to support the analyses with direct examination of the meteorological data in the context of the particular organism being investigated. CLIMEX provides both graphical and tabular displays to enable the user to do this. The same need for supportive examination of the raw meteorological data arises when match-ing climates close to the edges of the geographical distribution of a species.
(2) CLIMEX provides ‘Compare Locations’ or ‘Compare Years’ functions to model the stressful mechanisms by which climate limits the geographical
distribution of species and the suitable conditions that enable population growth in the favourable season. These functions are suitable for analyses of risks from pests. Fig. 3a shows the estimated limiting effect of heat stress on the geographical distribution of the rice-field rat Rattus argentiventer in Asia. Fig. 3b and c shows the CLIMEX summary index — the annual ecoclimatic index (EI) — of distribution and abun-dance in relation to climate for the rat in Asia. The EI integrates a measure of population growth, the annual growth index (GIA), with the sum of the limiting
fac-tors called ‘stresses’. The analyses were done under current climate and a future climate change scenario with a 2◦C increase in temperature (Sutherst et al.,
Fig. 2. Comparison of winter minimum temperatures of Mt Tamborine (—) with those of two locations, Tibooburra (· · ·) and Port Kembla (- - -) in New South Wales, Australia, each of which has the same value (0.68) for the CLIMEX match index with Mt Tamborine.
results from CLIMEX can be scaled in some cases to reflect economic costs by relating the GI or EI to recorded amounts of pest damage (Sutherst et al., 2000).
(3) CLIMEX is a climate- rather than weather-driven modelling program that is designed to provide in-sights into species’ requirements for climate, as ex-pressed by their geographical distribution, seasonal phenology and relative abundance. It is based on the premise that it is possible to define climates that are conducive to the generation of particular weather patterns, which directly affect populations on a short time-scale. Thus, for example, some plant pathogens require a very specific, short period of leaf wetness that is only described precisely by local weather data with a resolution as short as a few hours. CLIMEX is not designed to predict actual events in a crop us-ing real-time weather data, although it is beus-ing used successfully to deliver weekly forecasts of pest and pathogen development based on thermal accumula-tion in turf in USA (C. Sann, pers. comm.). Rather, CLIMEX indicates, in a more strategic manner on a landscape scale, the average weekly (interpolated from monthly average data with the smoothing that this involves) climatic conditions that are conducive to the generation of the weather required to produce
particular temperature or moisture conditions. It does this by defining the climatic responses of the species, which allow it to exist in its geographical distribu-tion. This resolution is more appropriate for policy and planning questions about issues such as risk as-sessment in integrated pest management (IPM) and quarantine, biological control or climate variability and long-term climate change. It is also more suited to use with data on geographical distributions.
(4) CLIMEX exploits a meteorological database with much higher temporal resolution than any other matching program for both its climate-matching (Match Climates) and its modelling (Com-pare Locations/Years) functions (Sutherst et al., 1995). For example, BIOCLIM users have usually used 7–32 seasonal data points to describe the 30-year aver-age climate of a given location (Booth, 1996). The Compare Locations/Years functions in CLIMEX use weekly, temporally interpolated data from averages of five different variables: maximum and minimum temperatures, 9 a.m. and 3 p.m. RH, and rainfall. This amounts effectively to 260 data points per
lo-cation for the fitting process. Climates are matched
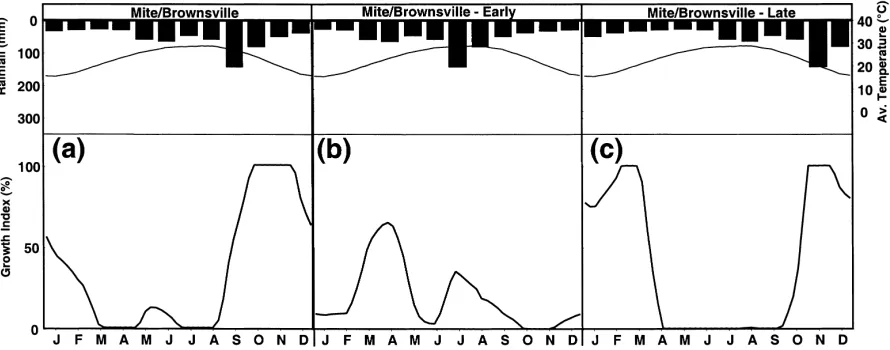
Fig. 4. CLIMEX growth index for the predatory mite (C. peregrinus) in Brownsville: (a) current rainfall pattern, (b) rainfall 2 months earlier, and (c) rainfall 2 months later.
CLIMEX is so robust, because it puts huge, although hidden, demands on the parameter-fitting procedure. Another advantage that it confers is the flexibility to address any climate, including novel climates that may emerge under climate change. In particular, one of the most significant changes in climate that is usu-ally overlooked is the possible change in the seasonal timing of rainfall. A shift forwards or backwards can have very substantial effects on species by disrupting required synchronisation of suitable temperatures and rainfall. For example, the response of a predatory mite species (Coccidoxenoides peregrinus Timber-lake) that has an observed peak in population growth in autumn in Brownsville (USA) is quite different to that when the year’s rainfall is either brought forward or delayed by two months (Fig. 4a–c), as indicated by the CLIMEX weekly growth index (GIW).
(5) CLIMEX parameters reflect the observed ge-ographical distribution of a species and so relate to the sum of all the genetic variation contained in that species, i.e. the distribution is made up of an aggre-gate of biotypes, which may vary to different degrees in their response to climate. Hence it is not always safe to assume that a small sample of the whole pop-ulation — as usually occurs in biological control — will be fully representative of the species. This caveat applies to all approaches based on inferring species’ climatic limits.
1968; Sutherst et al., 1996c; Booth, 1999). Thus, there is a great need for providers of meteorological data sets to include percentiles and extremes in the long-term average data sets currently available.
When designing management strategies to adapt to global change, it is often not feasible to use CLIMEX because it does not describe species’ lifecycles, thus providing no mechanism with which to link the effects of interventions. This task requires a process-based modelling approach, so we now describe one such modelling paradigm that has been applied in global change research on pests, the DYMEX modelling package.
2.2. DYMEX generic and modular modelling toolkit for biologists
The sustainability of available technologies and their robustness under global change need to be as-sessed in order to estimate the likelihood that they will be available for use as management options under global change (Sutherst et al., 1998). Quanti-tative estimates of effectiveness and profitability of those technologies are best obtained using mecha-nistic models. Process-based or mechamecha-nistic models are powerful tools for analysing pest, disease and weed problems. They enable risk assessments and the design of integrated adaptation strategies to be under-taken at scales ranging from fields to regions. They also provide the capability to link host and pest com-ponents, thereby enabling the integration of impacts on crops and on industries. The global community needs common process-based modelling tools and languages to facilitate collaboration. To be effective, such tools need to be transparent, easy to use and preferably self-documenting.
Models are uniquely suited to a number of tasks such as the following:
1. Clarifying mechanisms involved in global change responses, including interactions between compo-nents of the environment (e.g. crops and pests) or between different drivers of global change (e.g. temperature, moisture and CO2).
2. Estimating the sensitivity of a production system to perturbation in situations where an inferential, climate-based approach (i.e. CLIMEX) is consid-ered to be inadequate.
3. Designing and quantifying management options in terms of physical responses of the species or production system to interventions, and economic costs and benefits.
4. Providing a means of quantitative risk assessment that can be applied in different geographical regions and over different time-scales.
A generic modelling package for use in global change research ideally will include at least the fol-lowing features if it is to contribute in the environment in which global change research has to be done. 1. A structure that provides the capability to
assem-ble modules of objects and processes into different combinations to create descriptions of the pop-ulation dynamics of different taxa. Genericness and modularity enable the creation of a library of reusable modules that describe physical and biological processes or ‘attributes’, which are commonly needed to estimate impacts and man-agement options (Reynolds and Acock, 1997). For example, we need a library of modules describing global change drivers and their interactions, to-gether with derived variables such as soil moisture. 2. Descriptions of biological processes and attributes, such as development, survival, fecundity and longevity, which can be associated with different lifecycle stages of plants or animals.
3. A library of commonly used functions, which save time and duplication of effort.
crop, pest and natural enemy, in order to facilitate the analysis of the system’s behaviour under differ-ent scenarios. DYMEX provides a user-friendly tool for biologists to build and use mechanistic models of species’ populations and management options. It is an MS-Windows program, which allows modules to be assembled interactively using icons and dialogs and it has in-built data formatting, graphics and table generating facilities (Maywald et al., 1997, 1999). It was made possible by the advent of object-oriented programming languages. Models consist of a group of linked ‘modules’ which are either built using the ‘Builder’ or introduced into the model from a library of modules that is provided with DYMEX. The com-pleted model is run using a ‘Simulator’, which cur-rently allows the user to conduct sensitivity analyses and optimisations of timing or number of interven-tions for example, with associated costings. DYMEX currently lacks the desirable CLIMEX geographical platform but that is under development at the time of publication.
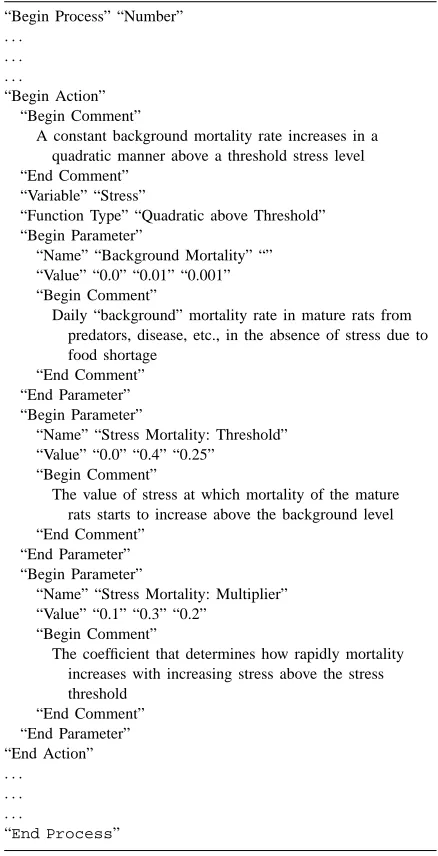
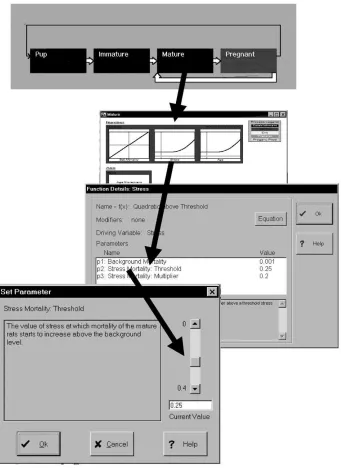
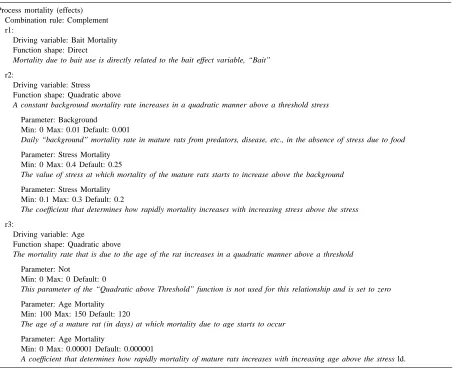
An illustration of a simplified, but multi-component DYMEX model of a rice-brown plant hopper — rice-field rat system is shown in Fig. 5. It was pro-duced during a global change training workshop in Indonesia (Sutherst et al., 1999). GMD files are gen-erated by the DYMEX ‘Builder’ and read by the ‘Simulator’. An extract of a DYMEX ‘generic model description’ (GMD) file illustrating the (hidden) syn-tax that describes a function in the rice-field rat mortality module is shown in Table 1. The ‘Builder’ also creates a self-documenting model description in text format, as shown for the same module in Table 2. A view of the DYMEX simulator dialogue box used to adjust parameter values is shown in Fig. 5.
“Name” “Background Mortality” “” “Value” “0.0” “0.01” “0.001” “Begin Comment”
Daily “background” mortality rate in mature rats from predators, disease, etc., in the absence of stress due to food shortage
“End Comment” “End Parameter” “Begin Parameter”
“Name” “Stress Mortality: Threshold” “Value” “0.0” “0.4” “0.25”
“Begin Comment”
The value of stress at which mortality of the mature rats starts to increase above the background level “End Comment”
“End Parameter” “Begin Parameter”
“Name” “Stress Mortality: Multiplier” “Value” “0.1” “0.3” “0.2”
“Begin Comment”
The coefficient that determines how rapidly mortality increases with increasing stress above the stress threshold
In Australia DYMEX Modelling workshops have already been conducted by interest groups working on Queensland fruit fly (Bactrocera tryoni), light brown apple moth (Epiphyas postvittana), rubbervine
Fig. 5. Hierarchy of dialogue boxes in DYMEX illustrating how model parameter values are changed.
monilifera), wheat stripe rust (Puccinia striiformis)
and diamond-back moth (Plutella xylostella). Mod-elling workshops have also been run on livestock ticks in Africa (http://www.ento.csiro.au/research/
Daily “background” mortality rate in mature rats from predators, disease, etc., in the absence of stress due to food
Parameter: Stress Mortality Min: 0 Max: 0.4 Default: 0.25
The value of stress at which mortality of the mature rats starts to increase above the background
Parameter: Stress Mortality Min: 0.1 Max: 0.3 Default: 0.2
The coefficient that determines how rapidly mortality increases with increasing stress above the stress
r3:
Driving variable: Age
Function shape: Quadratic above
The mortality rate that is due to the age of the rat increases in a quadratic manner above a threshold
Parameter: Not
Min: 0 Max: 0 Default: 0
This parameter of the “Quadratic above Threshold” function is not used for this relationship and is set to zero
Parameter: Age Mortality Min: 100 Max: 150 Default: 120
The age of a mature rat (in days) at which mortality due to age starts to occur
Parameter: Age Mortality
Min: 0 Max: 0.00001 Default: 0.000001
A coefficient that determines how rapidly mortality of mature rats increases with increasing age above the stress ld.
3.1. Integrated impact assessment of rice pests under global change
The first international workshop on modelling global change impacts on pests was a training work-shop held in Bogor, Indonesia in September 1998, under the auspices of the Biotrop-GCTE/Impacts Centre for southeast Asia (IC-SEA) (Sutherst et al., 1999). The workshop was designed to introduce participants from seven countries in the region to global change issues and some analytical tools and approaches that can be used to assess risks and eval-uate adaptation options. Initially, participants used
the CLIMEX model to acquire a regional perspective of the responses of rice pests to climate and climate change (Fig. 3). They then collaborated to develop and apply a simple dynamic ‘RatHopper’ model of the population dynamics and control of two key pests of rice, the rice-field rat (Rattus argentiventer) and the brown plant hopper (BPH) (Nilaparvata lugens) in a rice field. Scenarios were then used to explore likely future directions of IPM in the region, given a number of global change issues.
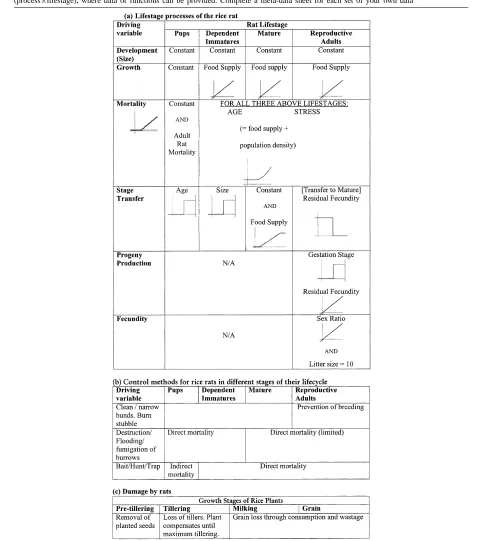
preda-tor on BPH. The grossly simplified representation of rice plants acts as a food source for the pests and pro-vides a means with which to estimate pest effects on yield. The rice dynamics were described using two life stages: seedlings (from planting to flowering) and mature plants (from flowering to harvest) to enable the different types of pest damage to be estimated. The user selects the planting date, temperature is read from a data file and green leaf biomass determines the growth rate on the assumption that water is not lim-iting. Pannicles are produced when the rice reaches a set green leaf biomass, or after a set number of days, whichever occurs first. Feeding of the BPH reduces the growth rate, green leaf biomass and hence pannicle weight. Feeding by the rats reduces the pannicle size and hence yield. The rice is harvested a fixed number of days after seed set. Yield was calculated from the total pannicle mass present at harvesting.
The rat lifecycle was modelled with four life-stages — pups (dependent on the mother), immatures (inde-pendent juveniles), mature rats and pregnant females. The growth and mortality of rats were driven primarily by the availability of food. Scarcity of food increased mortality and inhibited breeding. The available food consisted of rice seeds and green matter as well as a user-adjustable constant “background” food source. The rats’ food supply included rice green matter, but only the removal of seeds by rats was actually mod-elled as damage in the rice crop due to the lack of time in the workshop. The main control measure that was described in the model was baiting.
The BPH was modelled with four life-stages: eggs, nymphs, and both short- (brachypterous) and long-winged (macropterous) reproductive adults. Their development was determined by temperature. When sufficient rice green leaf biomass was avail-able, the nympal bugs developed into short-winged females. Otherwise, long-winged females were pro-duced. Short-winged forms are sessile and stayed within the rice crop, while the long-winged forms migrated out of the crop. Emigration was modelled by using a mortality function. A predator caused mortality of all stages of the BPH. Control measures available within the model included either chemical pesticides or inundative releases of predators.
The predator was assumed to be a generalist such as a coccinelid beetle, with predacious larval and adult stages. It had a considerably longer generation time
than that of the BPH. It was assumed that adequate alternative prey was present at all times when no BPH populations are present. The predator was susceptible to insecticide treatments aimed at control of BPH.
The required minimum and maximum temperatures and rainfall were obtained from either a DYMEX “MetManager” module or from a data file.
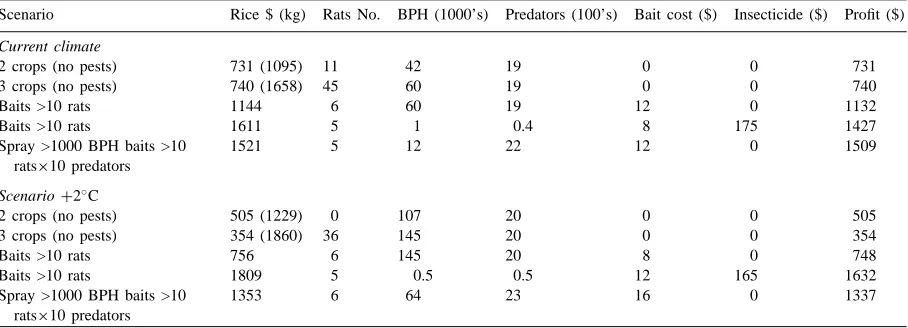
An example of an analysis of the response of the modelled pests to climate change and of one sug-gested policy response (an extra crop per year) that was intended to increase yields is given in Table 3.
As shown above, the simulations indicated that with an increase in temperature of 2◦C, which is within
the range of most global climate models for the next century, the rice yield would increase in Jakarta (no estimate of grain quality was included). However, the numbers of BPH would multiply 2.5-fold in the higher temperatures, while rat numbers would de-crease due to the longer fallow that resulted from the accelerated development of the rice crop. Note that in this version of the model, no account was taken of adverse effects of high temperatures on the rats, as inferred from the analysis of the geographical distri-bution using CLIMEX (Fig. 3c) or on the fertility of rice plants. The analysis allowed the participants to appreciate the feedback effects on populations from different components of the system without any pre-tence that the model was sufficiently realistic to be used as a decision support system.
Spray >1000 BPH baits >10 rats×10 predators
1353 6 64 23 16 0 1337
economic threshold proved to be a relatively robust and effective adaptation to climate change. However, this relies on an appreciation of the correct cause of the changes in pest numbers and seasonal phenology, otherwise changes in pest pressure could not be effec-tively interpreted. It also relies on the use of chemical pesticides, some of which may not be sustainable for environmental reasons or due to the emergence of resistant strains.
The Internet has the potential to communicate infor-mation on the effects of global change on pests to an international audience and also to maintain collabora-tive links between members of an interest group. The report from the rice-pest workshop (Sutherst et al., 1999) is available from the IC-SEA Impacts Cen-tre or the authors, and a summary can be viewed at http://www.icsea.or.id/Trsep98.htm. It illustrates how risks and management strategies can be designed and delivered in socio-economic terms for policymakers, with communication through the Internet, targeting national laboratories in developing countries where wider access is unavailable.
The group of participants now constitute a regional ‘interest group’ with the common aim of developing and applying models to describe the population dy-namics and management of the rice pests. It provides one possible model for a global pest network on global change research. The group collaborated by pooling data and expertise to build a model that belongs to the group, while the DYMEX support team provides
archiving and documentation support to manage the software ‘version control’. However, a major con-straint with the creation of networks is the question of funding the ongoing collaboration, even though it is perceived by participants to be very cost-effective by adding great value to their current activities. This is despite the recognition by agencies such as the World Bank that networks are potentially powerful tools in national development (http://www.vita.org/technet).
4. DYMEX modelling networks and workshops
The IGBP-GCTE global collaborative research pro-gram emphasises the development of global networks and consortia to achieve its aims of relevant collabora-tive research (Ingram et al., 1999). It relies heavily on multidisciplinary workshops to define and implement agendas for global change research. DYMEX-based
Modelling Workshops
Table 4
The workshops ideally last 3–5 days and start with sessions to clarify participants’ expectations of mod-els in general and the objectives of the workshop in particular. This process defines the purpose and vi-sion for the use of the model after the workshop and therefore focusses the model building effort on the group’s needs. These are followed by an introduction to DYMEX software, and agreements on behaviour adapted from Covey (1990) by Sutherst and Maywald (1998), data and model-sharing (Ingram et al., 1999) and other intellectual property issues. This provides the groundwork to enable participants to address the specific modelling issues, which are handled in later sessions. They cover model specifications; including the lifecycles to be described, damage relationships and control methods; identification and collation of data sets for both building the models and validating them against independent data; model formulation and testing; analysis of model behaviour and exploration of management options. A final session addresses fu-ture plans and possible projects, including the option of establishing a collaborative research network.
Research networks are facilitated, not only by shar-ing of software and workshop processes, but also by sharing data and models. In order to make this pos-sible, it helps to have agreed formats for display of meta-data, which summarize the raw data in a form that potential collaborators can see what topics and data are available to the network. GCTE has devel-oped a number of meta-databases to support the crop network in particular (Ingram et al., 1999). These de-scribe data sets that are used to evaluate and to apply simulation models. While suited to crop growth and yield trials, the formats do not lend themselves readily to pest data and so need some modifications. In
addi-mation on each process with a function if available, and secondly, meta-data sheets that describe each data set.
5. Conclusions
The global change community dealing with insects, diseases and weeds needs to address questions on how much these pests reduce crop yields at local, regional and global scales in order to be useful for farmers and policymakers. The questions also need to be answered in socio-economic terms with meaningful time frames and measures of uncertainty attached.
The wide range of needs, users and available data demands a range of tools for global change risk as-sessment and management. Given the time frames in-volved, the short-term priorities should be to identify vulnerable industries and regions, and current man-agement tools and practices that are both sustainable and robust under a range of scenarios. The options available for these tasks vary from expert opinion through modelling of climatic responses to compre-hensive process-based simulation models.
more detailed, multi-variate models of the species’ lifecycle to be built and options for the management of the species to be explored.
CLIMEX differs from all other approaches to climate-matching in that it uses both simulation mod-elling and an inference approach to estimate species’ responses to climate. These features enable useful information to be gleaned on a species’ behaviour in different environments, even when lifecycle data are not available to build a mechanistic model. They also confer the power to interpret responses to novel climates, a need that many statistically based pattern-matching approaches fail to address.
Process-based models, that describe the lifecycles and functioning of species’ populations, necessarily have a niche but vital role to play in applications involving estimates of vulnerability of key taxa, production systems and natural ecosystems of most significance. However, attempts to model populations highlight the dearth of knowledge relating biological processes to high quality meteorological data, other environmental variables and interactions with other species. This information is needed in order to de-fine functions with which to build simulation models. Therefore the global change community needs a ma-jor effort to collect the data that are necessary to build and test population models if it is to move beyond current skills.
The biologically oriented logic, transparency, user-friendly interface, genericness, modularity and self-documenting features of DYMEX are designed to maximise opportunities for sharing and collabora-tion. It could thus provide a cohesive mechanism to build and support global modelling networks. These features also make DYMEX particularly suitable for teaching purposes.
Documentation of models continues to be a source of difficulty for ecologists, whose models are often highly complex. The internally generated documen-tation from software such as DYMEX can contribute towards an improvement of the process as sought by Hoch et al. (1998).
Global change presents a major challenge to mankind but the success of collaborative approaches through initiatives such as GCTE offer great encour-agement for the future ability of science to answer the questions being posed by policymakers. However, a history of biological research that has not been aimed
at building models has left vast volumes of observa-tional data but a dearth of process-related data that is suitable for use in building simulation models. This has led to an urgent need to redress the deficiency by collecting the necessary data for all key species of pests.
Acknowledgements
The organizers of the “Food and Forestry: Global Change and Global Challenges” conference kindly contributed towards funding for one of us (RWS) participating in the conference. Dr. Rick Bottomley assisted with the illustrations.
References
Atzeni, M.G., Mayer, D.G., Spradbery, J.P., Anaman, K.A., Butler, D.G., 1994. Comparison of the predicted impact of a screwworm fly outbreak in Australia using a growth index model and a life-cycle model. Med. Vet. Entomol. 8, 281–291. Baker, R.H.A., Cannon, R.J.C., Walters, K.F.A., 1996. An assessment of the risks posed by selected non-indigenous pests to UK crops under climate change. In: Implications of ‘global environmental change’ for crops in Europe. Aspects Appl. Biol. 45, 323–330.
Basher, R.E., Pittock, A.B., Bates, B., Done, T., Gifford, R.M., Howden, S.M., Sutherst, R.W., Warwick, R., Whetton, P., Whitehead, D., Williams, J.E., Woodward, A., 1998. Australasia. In: Watson, R.T., Zinyowera, M.C., Moss, R.H., Dokken, D.J. (Eds.), The Regional Impacts of Climate Change. An Assessment of Vulnerability. A Special Report of IPCC Working Group II. Cambridge University Press, Cambridge, pp. 105–148.
Booth, T.H., 1996. Matching trees and sites. In: ACIAR Pro-ceedings, No. 63.
Booth, T.H., 1999. Matching germplasm to geography: environmental analysis for plant introduction. In: Greene, S., Guarino, L. (Eds.), Linking Genetic Resources and Geography: Emerging Strategies for Conserving and using Crop Diversity. Crop Science Special Publication No. 27, pp. 63–74. Covey, S.R., 1990. The Seven Habits of Highly Effective People:
Restoring the Character Ethic. Australian Business Library, Melbourne.
Fitzpatrick, E.A., Nix, H.A., 1970. The climatic factor in Australian grassland ecology. In: Moore, R.M. (Ed.), Australian Grasslands. Australian National University Press, Canberra, pp. 3–26.
J., Moore, K.L., Payne, R.W., 1998. Testing winter wheat simulation models’ predictions against observed UK grain yields. Agric. Forest. Meteorol. 89, 85–99.
Luo, Y., TeBeest, D.O., Teng, P.S., Fabellar, N.G., 1995. Simulation studies on risk analysis of rice blast epidemics associated with global climate in several Asian countries. J. Biogeogr. 22, 673– 678.
Maywald, G.F., Sutherst, R.W., Zalucki, M.P., 1997. Generic modelling for integrated pest management. In: McDonald, A.D., McAleer, M. (Eds.), Proceedings of MODSIM’97, Hobart, Vol. 3, pp. 1115–1116.
Maywald, G.F., Sutherst, R.W., Zalucki, M.P., 1999. DYMEX professional. Modelling Natural Systems, CD-ROM. CSIRO, Melbourne.
Nix, H.A., Fitzpatrick, E.A., 1969. An index of crop moisture stress related to wheat and grain sorghum yields. Agric. Meteorol. 6, 321–327.
Oerke, E.C., Dehne, H.W., Schonbeck, F., Weber, A., 1994. Crop production and crop protection. Elsevier, Amsterdam, 808 pp. Parry, M., Carter, T., 1998. Climate Impact and Adaptation
Assessment. Earthscan Publications, UK.
Reynolds, J.F., Acock, B., 1997. Modularity and genericness in plant and ecosystem models. Ecol. Model. 94, 7–16. Scherm, H., Sutherst, R.W., Harrington, R., Ingram, J.S.I., 1999.
Global networking for assessment of impacts of global change on plant pests. Environ. Pollut. 107, 1–9.
Stephens, D.J., Lyons, T.J., Lamond, M.H., 1989. A simple model to forecast wheat yield in Western Australia. J. Roy. Soc. West. Aust. 71, 77–81.
Sutherst, R.W., 1998. Implications of global change and climate variability for vector-borne diseases: generic approaches to impact assessments. Int. J. Parasitol. 28, 935–945.
Melbourne.
Sutherst, R.W., Maywald, G.F., Skarratt, D.B., 1995. Predicting insect distributions in a changed climate. In: Harrington, R., Stork, N.E. (Eds.), Insects in a Changing Environment. Academic Press, London, pp. 59–91.
Sutherst, R.W., Yonow, T., Chakraborty, S., O’Donnell, C., White, N., 1996a. A generic approach to defining impacts of climate change on pests, weeds and diseases in Australasia. In: Bouma, W.J., Pearman, G.I., Manning, M.R. (Eds.), Greenhouse: Coping with Climate Change. CSIRO, Melbourne, pp. 281– 307.
Sutherst, R.W., Ingram, I., Steffen, W., 1996b. Global change impacts on pests, diseases and weeds. Implementation Plan. GCTE Activity 3.2. GCTE Core Office, Canberra.
Sutherst, R.W., Floyd, R.B., Maywald, G.F., 1996c. The potential geographical distribution of the cane toad, Bufo marinus L. in Australia. Conserv. Biol. 10, 294–299.
Sutherst, R.W., Ingram, J., Scherm, H., 1998. Global change and vector-borne diseases. Parasitol. Today 14, 297–299. Sutherst, R.W., Murdiyarso, D., Widayati, A., 1999. Modelling
global change impacts on pests. Biotrop-GCTE IC-SEA Report No. 7. Bogor, Indonesia.
Sutherst, R.W., Collyer, B.S., Yonow, T., 2000. The vulnerability of Australian horticulture to the Queensland fruit fly, Bactrocera (Dacus) tryoni, under climate change. Aust. J. Agric. Res. 51, 467–480.
Worner, S.P., 1991. Use of models in applied entomology: the need for perspective. Environ. Entomol. 20, 768–773. Yonow, T., Sutherst, R.W., 1998. The geographical distribution of