The role of LH pulse frequency in ACTH-induced
ovarian follicular cysts in heifers
A.Y. Ribadu
∗, K. Nakada, M. Moriyoshi,
W.C. Zhang, Y. Tanaka, T. Nakao
Department of Veterinary Obstetrics and Gynaecology, School of Veterinary Medicine, Rakuno Gakuen University, 582 Bunkyodai-Midorimachi, Ebetsu, Hokkaido 069-8501, Japan
Received 7 December 1998; received in revised form 5 January 2000; accepted 20 July 2000
Abstract
The aim of the present study was to induce ovarian cysts experimentally in cattle using ACTH and to closely examine the role of LH pulse frequency in ovarian cyst formation. Five regularly cycling Holstein–Friesian heifers (15–18-month-old) were used. Ovaries were scanned daily using an ultrasound scanner with a 7.5 MHz rectal transducer. Daily blood samples were obtained via tail venepuncture for hormone analyses. Additional blood samples (for FSH and LH pulses) were obtained through an indwelling jugular vein catheters every 15 min for 8 h on Days 2 (early luteal phase; ELP), 12 (mid-luteal phase; MLP) and 19 (follicular phase; FP) of control estrous cycle and on alternate days during follicular cyst (FC) formation and persistence. Cysts were induced using subcutaneous injections of ACTH (Cortrosyn® Z; 1 mg) every 12 h for 7 days beginning on Day 15 of the subsequent estrous cycle. Plasma concentrations of progesterone (P4), estradiol-17b, FSH and
LH were determined by double antibody radioimmunoassay while cortisol concentration was de-termined by enzyme immunoassay (EIA). Ovarian follicular and endocrine dynamics were normal during the control estrous cycles. Ovarian follicular cysts were induced in four of the five heifers. Mean maximum size of cysts was larger (P <0.05) than that of ovulatory follicles (26.78±3.65 versus 14.1±0.90 mm), respectively. Cortisol levels were increased during ACTH treatment. High concentrations of estradiol and low progesterone were observed after cyst formation. LH pulse frequency was significantly reduced (P <0.05) during cyst formation and persistence compared to ELP (7.5±0.75) and FP (6.5±0.58), but was not significantly (P =0.23) different from MLP (2.8±0.29) pulses. Mean LH pulse amplitude and concentrations were not different. Similarly, the mean pulse frequency, amplitude and concentration of FSH were not different between con-trol study and cystic heifers. These results suggest that the LH pulse frequency observed following
∗Corresponding author. Present address: Department of Veterinary Surgery & Reproduction, Faculty of Veteri-nary Medicine, University of Maiduguri, P.M.B. 1069, Maiduguri, Borno State, Nigeria. Tel.:+234-76-342327. E-mail address:[email protected] (A.Y. Ribadu).
ACTH treatment may interact with high estradiol concentration to induce ovarian cyst formation in heifers. © 2000 Published by Elsevier Science B.V.
Keywords:Cattle-ovary; Luteinising hormone (LH); Pulse frequency; Ovarian cysts; ACTH
1. Introduction
Ovarian follicular cysts are an important reproductive disorder which contribute to ex-tended calving interval in dairy cattle. Many factors such as milk production, season, puer-peral stress and nutrition are associated with the development of ovarian follicular cysts, although their exact relationship is not fully understood (Archbald and Thatcher, 1992).
There are several limitations on studies of spontaneous cases of ovarian cysts. It is not feasible to know for how long the cystic structure(s) may have existed before diagnosis. In addition, the circumstances affecting ovarian function at the time of diagnosis may be different to the prevailing conditions at the time of study. It is also difficult to follow clinical cases (once diagnosed) for a long period without treatment as clients request treatment as soon as possible (Ribadu, 1993). It may, therefore, be helpful to induce ovarian cysts experimentally in order to monitor their development closely.
Ovarian cysts have been induced in cattle by a variety of treatments given in late diestrus or proestrus. Such treatments included exogenous estrogens (Wiltbank, 1966; Nadaraja and Hansel, 1976; Carrie’re et al., 1995), a combination of progesterone and estradiol (Erb et al., 1973; Winters et al., 1986; Cook et al., 1990, 1991; Hamilton et al., 1995), antiserum against bovine LH (Nadaraja and Hansel, 1976), testosterone (Fathala et al., 1978) or exogenous adrenocorticotropic hormone (ACTH) (Liptrap and Mc Nally, 1976; Refsal et al., 1987; Kawate et al., 1996).
estrogen production. It could, therefore, be hypothesised that ACTH induces ovarian cysts by decreasing the LH pulse frequency.
The objectives of the present study were to experimentally induce ovarian cysts in heifers using ACTH and to closely monitor cyst formation by ultrasonography and hormone profile with particular reference to the role of LH pulse frequency.
2. Material and method
2.1. Animals and treatment
Five Holstein–Friesian heifers (15–18-month-old) weighing 380–400 kg with normal and regular estrous cycles were used for this study. The heifers were tied in stalls and fed hay, silage, concentrates and minerals licks. Water was provided ad libitum. Animal experi-mentation was performed in conformity with the University Animal Welfare Committee guidelines.
In order to synchronize estrus (for control estrous cycle study), the heifers were adminis-tered 25 mg Dinoprost (Pronalgon F®; Takeda Chemical Co., Ltd., Tokyo, Japan) 11 days apart. Animals were checked for estrous behaviour (restlessness, bellowing, presence of “estrus discharge” and turgidity of the uterus by palpation per rectum) around the time of expected estrus after the second prostaglandin injection. During the control estrous cycle, the heifers did not receive any form of treatment.
Beginning on Day 15 of the subsequent estrous cycle, the heifers were treated with 1 mg ACTH (Cortrosyn® Z; Daiichi Pharmaceutical Co., Ltd., Tokyo, Japan) subcutaneously every 12 h for 7 days.
2.2. Ultrasonography
Ovaries were scanned using a real-time B-mode ultrasound scanner (Echopal, Hitachi Medical Corporation, Tokyo, Japan) equipped with a 7.5 MHz rectal transducer. All ultra-sound examinations were performed by a single operator. The growth and regression of follicles≥5 mm, corpora lutea and cysts were monitored. Daily ovarian ultrasonography was performed through a complete estrous cycle (control) and from Day 14 (Day 0=Day of estrus) until Days 35–48 (ACTH treatment group). Representative images were frozen on the ultrasound screen and printed using an on-line thermal printer (EZU-VP5; Hitachi Medical Corporation, Tokyo, Japan).
Cysts detected by ultrasonography were defined as any follicular structure of 20 mm or greater in diameter which was present for 10 days or more without ovulation and CL formation (Cook et al., 1990; Chavette et al., 1993). The first day of cyst formation was the day a follicle attained 20 mm or more in diameter.
2.3. Blood sampling
(Day 14 of the estrous cycle) until Days 35–48. To assess pulsatile FSH and LH secretion, blood samples were collected through indwelling jugular vein catheters (i.d.: 0.98 mm; o.d.: 1.55 mm; length: 50 cm; Medikit, Tokyo, Japan) every 15 min for 8 h on Days 2 (early luteal phase; ELP), 12 (mid-luteal phase; MLP) and 19 (follicular phase; FP) of the control estrous cycle and on alternate days during cyst formation and persistence (beginning when a dominant follicle has attained a size of 20 mm). In order to avoid clotting inside the catheter, 3 ml heparinised saline solution (20 iu/ml) was flushed into the catheter after each collection. Also, in order to avoid heparinised blood in the sample, 4 ml of blood was drawn and discarded before drawing the next sample.
The blood samples were centrifuged at 1700×g for 20 min. Plasma samples were stored at−20◦C until concentrations of FSH, LH, progesterone, estradiol and cortisol were determined.
2.4. Hormone analysis
Plasma concentration of FSH were measured by a validated radioimmunoassay (Bolt and Rollins, 1983) using antibovineb-subunit antiserum (USDA-5-pool),125I-bFSH (I-2) for radioiodination and USDA-bFSH I-2 as reference standard. Plasma concentrations of LH were measured by a validated RIA (Echternkamp et al., 1976) using anti-ovine LH serum (Ao/LH serum YM #18), USDA-bLH (B-6) for radioiodination and USDA-bLH (B-6) as reference standard. The antiserum to bovine LH was cross-reacted at 0.5% with bovine FSH and 0.4% with bovine TSH. The sensitivities of the assays for FSH amd LH were 0.08 and 0.07 ng/ml, respectively. The intra- and inter-assay coefficients of variation at a mean concentration of 0.25 ng/ml were 10 and 16.6% for FSH and 8.1 and 14.4% for LH at a mean concentration of 0.52 ng/ml, respectively. There was no cross reaction between LH and FSH in the assays, as there was no synchrony in the FSH and LH pulses from the same samples analysed.
Plasma cortisol concentrations were measured by enzyme immunoassay (EIA) as de-scribed by Nakao et al. (1981). The sensitivity of the assay was 0.2 ng/ml. The intra- and inter-assay coefficients of variation of the assay at a mean concentration of 3.4 ng/ml were 8.6 and 13.8%, respectively.
2.5. Statistical analysis
Luteinising hormone and FSH profiles were characterised similar to the method of Brown et al. (1986). Fluctuations in plasma LH and FSH were determined to be pulses if: (1) the values were at least 40% above the LH or FSH concentration immediately preceding the rise and (2) they were followed by at least two successive values that were declining or rep-resented basal levels. Pulse amplitude was determined by subtracting basal values from the highest value associated with the pulse. Basal gonadotropin concentrations were calculated from values not associated with either the ascending or descending portions of a pulse.
Results were subjected to analysis of variance for repeated measures. For FSH and LH pulse frequency, data was first normalised by square root transformation in order to achieve homogeneity of variance. ANOVA was performed on the transformed data. Student’st-test was used to compare the difference between two means. A value ofP <0.05 was considered to be significant.
3. Results
3.1. Control
Daily ultrasound monitoring during a complete estrous cycle revealed normal follicular dynamics in the heifers. Four heifers had two waves of follicular growth per cycle, while one heifer had three waves. The mean length of the estrous cycle was 20.4±0.24. The ovulatory follicle was detected on Day 12.0±0.82 for heifers with two waves per cycle and on Day 15 for the heifer with three waves per cycle. The mean size of the ovulatory follicle (14.1±0.90 mm) was not significantly different (P > 0.05) from the mean maximum diameter of the dominant nonovulatory follicle (13.2±0.41). Mean maximal diameter of corpora lutea (CL) on Day 12 of the estrous cycle was 22.5±0.56 mm. Estrous behaviour were noted in all control heifers around Days 19–20 of the estrous cycle.
3.2. ACTH treatment
Table 1
Plasma progesterone, estradiol and cortisol concentrations during the last 1 week of control estrous cycle (n=5) and during ACTH treatment (n=4) in which ovarian cysts developeda
Day of estrous cycle Progesterone (ng/ml) Estradiol (pg/ml) Cortisol (ng/ml)
Control ACTH Control ACTH Control ACTH
15 9.0±0.82 a 6.5±1.30 a 3.5±1.04 b 8.7±1.23 c 3.1±1.66 d 4.9±1.79 e 16 6.2±1.08 a 6.6±0.54 a 3.4±0.89 b 8.2±1.91 c 1.7±0.35 d 11.4±2.26 e 17 2.2±0.65 a 6.1±0.72 f 3.6±1.07 b 6.6±1.68 c 1.0±0.40 d 14.6±1.93 e 18 0.9±0.44 a 4.5±1.39 f 4.9±1.61 b 5.5±1.52 b 0.6±0.08 d 9.6±1.24 e 19 0.8±0.40 a 4.8±0.20 f 8.8±1.95 b 9.1±1.52 b 1.9±0.50 d 5.6±0.81 e 20 0.6±0.17 a 4.4±0.80 f 7.1±1.39 b 6.5±1.74 b 2.4±0.80 d 10.1±1.94 e 21 0.4±0.16 a 1.4±0.25 a 2.2±0.27 b 6.5±1.94 c 4.9±1.73 d 8.1±1.95 e
aDifferent letters within a row indicate significant differences (P <0.05).
signs and ovulated a dominant follicle (20 mm) on Day 24 from last ovulation. The control estrous cycle length and ovulatory follicle size for this heifer was 20 days and 14.8 mm, respectively. None of the four heifers in which cysts developed exhibited estrous behaviour or nymphomania during ACTH treatment and cyst formation.
After completion of ACTH treatment on Day 21; progesterone concentrations were main-tained at subluteal levels (1.16–2.14 ng/ml) between Days 21 and 23. The hormone profile during the last week of the control estrous cycle and during ACTH treatment in heifers in which cysts developed is presented in Table 1. Plasma progesterone concentration during the last week of the estrous cycle (i.e. Days 15–21) was not significantly different (P >0.05) from similar period after ACTH treatment. However, both estradiol-17band cortisol con-centrations were significantly higher (P < 0.05) during ACTH treatment (Days 15–21) compared to the similar time scale during the control estrous cycle. Estradiol-17b concen-trations fluctuated greatly both within and between heifers. Two of the cystic heifers showed high concentrations with peak amounts of 62.56±15.80 pg/ml, while the remaining two heifers showed a peak of 8.04±0.53 pg/ml. It was also noted that sharp decline in estradiol preceded the initiation of morphological regression of the cysts by about 4 days.
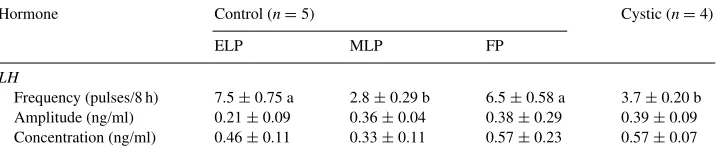
The mean LH pulse frequency, amplitude and concentration during the ELP, MLP and FP of estrous cycle and during follicular cyst formation (FC) is depicted in Table 2. There were
Table 2
Mean LH pulse frequency (number of pulses/8 h), pulse amplitude and concentration (ng/ml) during early luteal phase (ELP), mid-luteal phase (MLP) and follicular phase (FP) of control estrous cycle (n=5) and after cyst formation (n=4)a
Hormone Control (n=5) Cystic (n=4)
ELP MLP FP
LH
Frequency (pulses/8 h) 7.5±0.75 a 2.8±0.29 b 6.5±0.58 a 3.7±0.20 b Amplitude (ng/ml) 0.21±0.09 0.36±0.04 0.38±0.29 0.39±0.09 Concentration (ng/ml) 0.46±0.11 0.33±0.11 0.57±0.23 0.57±0.07
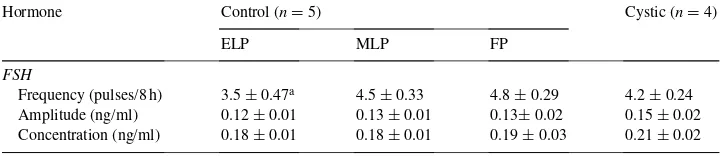
Table 3
Mean FSH frequency (number of pulses/8 h), pulse amplitude and concentration (ng/ml) during early luteal phase (ELP), mid-luteal phase (MLP) and follicular phase (FP) of control estrous cycle (n=5) and after cyst formation (n=4)
Hormone Control (n=5) Cystic (n=4)
ELP MLP FP
FSH
Frequency (pulses/8 h) 3.5±0.47a 4.5±0.33 4.8±0.29 4.2±0.24 Amplitude (ng/ml) 0.12±0.01 0.13±0.01 0.13±0.02 0.15±0.02 Concentration (ng/ml) 0.18±0.01 0.18±0.01 0.19±0.03 0.21±0.02
aMean±S.E.M.
no significant differences (P >0.05) in LH pulse frequency, amplitude and concentration across the days during cyst formation and persistence; hence only a single mean (FC) column is shown in Table 2. LH pulse frequency was significantly reduced (P <0.05) during cyst formation and persistence compared to ELP and FP. It was not significantly (P =0.23) different from MLP pulse frequency (3.72±0.20 versus 2.75±0.29), respectively. The mean LH amplitude and concentration were not different among the different phases of the estrous cycle and during cyst formation.
The mean FSH pulse frequency, amplitude and concentration during the ELP, MLP, FP of the estrous cycle is shown in Table 3. There was no significant difference (P >0.05) in the FSH pulse frequency, amplitude and concentration across the days during cyst formation and persistence, hence only a single mean (FC) column is shown in Table 3. Mean pulse frequency, amplitude and concentration of FSH were not different (P > 0.05) between control and cystic heifers.
In two of the heifers with cysts, cyst regression was followed by the emergence of a follicle that subsequently ovulated and formed a CL. In one heifer, the cyst was maintained at >20 mm despite the occurrence of ovulation and CL formation. In the fourth heifer, however, follicular development leading to ovulation was not observed despite complete cyst regression (<5 mm) at the time of termination of the experiment on Day 48.
4. Discussion
frequency are associated with decreased estradiol production and the demise of the dominant follicle (Ireland and Roche, 1983; Savio et al., 1993; Stock and Fortune, 1993), since dominant follicles are critically dependent on LH for survival (Campbell et al., 1995). Conversely, an increase in LH pulse frequency is required for successful ovulation (Rahe et al., 1980; Roche and Mihm, 1996).
The LH pulse frequency during the control estrous cycle (ELP, MLP and FP) was consis-tent with previous reports (Rahe et al., 1980; Schallenberger et al., 1985; Stock and Fortune, 1993; Cupp et al., 1995). The mean LH pulse frequency in heifers with cysts in this study (3.72±0.20 pulses/8 h) was lower than the frequency (5–7 pulses/8 h) reported in postpar-tum cows with cystic follicles by Savio et al. (1990). A higher mean LH pulse frequency, amplitude and concentration were reported during the FP in cows that developed follic-ular cysts following progesterone/estradiol treatment compared to the cows which failed to develop cysts and controls (Cook et al., 1991). ACTH treatment seemed to modify the pulsatile release of LH either directly at the level of the hypothalamus or indirectly through the suppressive effect of cortisol on LH (Stoebel and Moberg, 1982; Li and Wagner, 1983) and/or adrenal progesterone production (Watson and Munro, 1984).
In the present study, the mean FSH pulse frequency, amplitude and concentration during the control estrous cycle (ELP, MLP and FP) were not different with cystic heifers. These findings supplements earlier reports (Cook et al., 1990; Hamilton et al., 1995) and indicates that changes in the secretory pattern and concentrations of FSH may not be a factor in the etiology of ovarian cysts.
During the control estrous cycle, ovarian follicular development was characterised by two waves per cycle in four heifers and three waves per cycle in the fifth heifer. The wave pattern of follicular growth was consistent with previous reports (Sirois and Fortune, 1988; Savio et al., 1988; Knopf et al., 1989). In the present study, administration of ACTH resulted in alteration in follicular dynamics with subsequent ovarian follicular cyst formation in four out of five heifers. In previous studies, Refsal et al. (1987) reported experimental induction of cysts in two out of five heifers while Liptrap and Mc Nally (1976) obtained cysts in five out of five cows. Kawate et al. (1996) similarly induced ovarian cysts using ACTH in four out of four cows. The growth rate of ovulatory follicles during the control estrous cycle were similar to cystic follicles. Similar findings were reported by Hamilton et al. (1995).
allowing the emergence of a wave of follicular growth culminating in ovulation. The size of the cyst as observed by ultrasonography was >20 mm at the time of decline in estradiol concentration. This indicated that morphological dominance of the cyst (as observed by ultrasonography) may not be equated with functional dominance. A similar observation was made by Savio et al. (1990) who noted that estradiol returned to basal levels 10–15 days before first ovulation, despite the fact that morphologically the cyst was still detectable on ultrasound examination. The increased cortisol concentrations observed following the initiation of ACTH treatment concurred with previous studies (Nadaraja and Hansel, 1976; Refsal et al., 1987).
In conclusion, the results of the present study has shown that LH pulse frequency (but not features of FSH secretion) was reduced during cyst formation and persistence which suggests that alterations in the pulsatile release of LH may interact with high estradiol concentration to cause ovarian follicular cyst formation in heifers.
Acknowledgements
A.Y. Ribadu was supported by a postdoctoral fellowship from Japan Society for the Pro-motion of Science (JSPS), Tokyo, Japan. The authors are grateful to Daiichi Pharmaceutical Co., Ltd., Tokyo, Japan and Takeda Chemical Co., Ltd., Tokyo, Japan for the kind donation of Cortrosyn® Z and Pronalgon F®, respectively.
References
Archbald, L.F., Thatcher, W.W., 1992. Ovarian follicular dynamics and management of ovarian cysts. In: Van Horn, H.H., Wilcox, C.J. (Eds.), Large Dairy Herd Management. Am. Dairy Sci. Assoc., Champaign, IL, pp. 199–208.
Bolt, D.J., Rollins, R., 1983. Development and application of a radioimmunoassay for bovine follicle stimulating hormone. J. Anim. Sci. 56, 146–154.
Brown, J.L., Schoenemann, H.M., Reeves, J.J., 1986. Effect of FSH treatment on LH and FSH receptors in chronic cystic ovarian diseased cows. J. Anim. Sci. 62, 1063–1071.
Campbell, B.K., Scaramuzzi, R.J., Webb, R., 1995. Control of antral follicle development and selection in sheep and cattle. J. Reprod. Fertil. (Suppl.) 49, 335–350.
Carrie’re, P.D., Amaya, D., Lee, B., 1995. Ultrasonography and endocrinology of ovarian dysfunction in heifers with estradiol valerate. Theriogenology 43, 1061–1076.
Carroll, D.J., Pierson, R.A., Combs, D.K., 1990. Variability of ovarian structures and plasma progesterone profiles in dairy cows with ovarian cysts. Theriogenology 34, 349–370.
Chavette, P.M., Archbald, L.F., Risco, C., Tran, T., Sumrall, D., 1993. Effectiveness of prostaglandin F2ain the
initial treatment of bovine ovarian cysts. Theriogenology 40, 745–755.
Cook, D.L., Smith, C.A., Parfet, J.R., Youngquist, R.S., Brown, E.M., Garverick, H.A., 1990. Fate and turnover rate of ovarian follicular cysts in dairy cattle. J. Reprod. Fertil. 90, 37–46.
Cook, D.L., Parfet, J.R., Smith, C.A., Moss, G.E., Youngquist, R.S., Garverick, H.A., 1991. Secretory patterns of LH and FSH during development and hypothalamic and hypophyseal characteristics following development of steroid-induced ovarian follicular cysts in dairy cattle. J. Reprod. Fertil. 91, 19–28.
Cupp, A.S., Stumpf, T.T., Kojima, F.N., Werth, L.A., Wolfe, M.W., Robertson, M.S., Kittock, R.J., Kinder, J.E., 1995. Secretion of gonadotrophins change during the luteal phase of the bovine oestrous cycle in the absence of corresponding changes in progesterone or 17b-oestradiol. Anim. Reprod. Sci. 37, 109–119.
Echternkamp, S.E., Bolt, D.J., Hawk, H.W., 1976. Ovarian and pituitary hormones in blood of progestogen-treated ewes. J. Anim. Sci. 42, 893–900.
Erb, R.E., Monk, E.L., Callahan, C.J., Mollet, T.A., 1973. Endocrinology of induced ovarian follicular cysts. J. Anim. Sci. 37, 310 (abstract).
Farin, P.W., Youngquist, R.S., Parfet, J.R., Garverick, H.A., 1992. Diagnosis of luteal and follicular ovarian cysts by palpation per rectum and linear array ultrasonography in dairy cows. J. Am. Vet. Med. Assoc. 200, 1065–1089. Fathala, M.A., Geissenger, H.D., Liptrap, R.M., 1978. Effects of endometrial damage and prostaglandin F2ain
experimental cystic ovarian follicles in the cow. Res. Vet. Sci. 25, 269–279.
Hamilton, S.A., Garverick, H.A., Keisler, D.H., Xu, Z.Z., Loss, K., Youngquist, R.S., Salfen, B.E., 1995. Characterization of ovarian follicular cysts and associated endocrine profiles in dairy cows. Biol. Reprod. 53, 890–898.
Ireland, J.J., Roche, J.F., 1983. Development of nonovulatory antral follicles in heifers: changes in steroids in follicular fluid and receptors for gonadotropins. Endocrinology 112, 150–156.
Kawate, N., Inaba, T., Mori, J., 1996. Changes in plasma concentrations of gonadotropins and steroidal hormones during the formation of bovine follicular cysts induced by the administration of ACTH. J. Vet. Med. Sci. 58, 141–144.
Knopf, L., Kastelic, J.P., Schallenberger, E., Ginther, O.J., 1989. Ovarian follicular dynamics in heifers: test of two-wave hypothesis by ultrasonically monitoring individual follicles. Domest. Anim. Endocrinol. 6, 111–119. Li, P.S., Wagner, W.C., 1983. In vivo and in vitro studies on the effect of adrenocorticotropic hormone or cortisol
on the pituitary response to gonadotropin releasing hormone. Biol. Reprod. 29, 25–37.
Liptrap, R.W., Mc Nally, P.J., 1976. Steroid concentrations in cows with corticotropin-induced cystic ovarian follicles and the effects of prostaglandin F2aand indomethacin given by intrauterine injection. Am. J. Vet. Res.
37, 369–375.
Nadaraja, R., Hansel, W., 1976. Hormonal changes associated with experimentally produced cystic ovaries in the cow. J. Reprod. Fertil. 47, 203–208.
Nakao, T., Tamura, F., Tsunoda, N., Kawata, K., 1981. Double antibody enzyme immunoassay of cortisol in bovine plasma. Steroids 38, 111–120.
Phogat, J.B., Smith, R.F., Dobson, H., 1999. Effect of adrenocorticotropic hormone (ACTH1–24) on ovine pituitary
gland responsiveness to exogenous pulsatile GnRH and oestradiol-induced LH release in vivo. Anim. Reprod. Sci. 55, 199–203.
Rahe, C.H., Owens, R.E., Fleeger, J.L., Newton, H.J., Harms, P.J., 1980. Patterns of plasma luteinizing hormone in the cyclic cow: dependence upon period of the estrous cycle. Endocrinology 107, 498–503.
Refsal, K.R., Jarvin-Maldano, J.H., Nachreiner, R.F., 1987. Endocrine profiles in cows with ovarian cysts experimentally induced by treatment with exogenous estradiol or adrenocorticotropic hormone. Theriogenology 28, 871–889.
Ribadu, A.Y., 1993. Ultrasonography and endocrinology of ovarian cysts in cattle. PhD Thesis, University of Liverpool, UK.
Ribadu, A.Y., Dobson, H., Ward, W.R., 1993. Ultrasound and the diagnosis and treatment of ovarian cysts. Cattle Pract. 1, 400–413.
Ribadu, A.Y., Ward, W.R., Dobson, H., 1994. Comparative evaluation of ovarian structures by palpation per rectum, ultrasonography and plasma progesterone concentration. Vet. Rec. 135, 452–457.
Roberts, S.J., 1986. Veterinary Obstetrics and Genital Diseases, 3rd Edition. Edwards Brothers, Ann Arbor, MI. Roche, J.F., Mihm, M., 1996. Physiology and practice of induction and control of oestrous in cattle. In: Proceedings
of the XIX World Buiatrics Congress, Vol. 1, pp. 157–163.
Savio, J.D., Keenan, L., Boland, M.P., Roche, J.F., 1988. Pattern of growth of dominant follicles during the estrous cycle of heifers. J. Reprod. Fertil. 83, 663–671.
Savio, J.D., Boland, M.P., Hynes, N., Roche, J.F., 1990. Resumption of follicular activity in the early postpartum period in dairy cows. J. Reprod. Fertil. 88, 569–579.
Savio, J.D., Thatcher, W.W., Badinga, L., de la Sota, R.L., Wolfenson, D., 1993. Regulation of dominant follicle turn over during the estrous cycle in cows. J. Reprod. Fertil. 97, 197–203.
Sirois, J., Fortune, J.E., 1988. Ovarian follicular dynamics during the estrous cycle in heifers monitored by real-time ultrasonography. Biol. Reprod. 39, 308–317.
Sirois, J., Fortune, J.E., 1990. Lengthening of the bovine estrous cycle with levels of exogenous progesterone: a model for studying ovarian follicular dominance. Endocrinology 127, 916–925.
Stock, A.E., Fortune, J.E., 1993. Ovarian follicular dominance in cattle: relationship between prolonged growth of the ovulatory follicle and endocrine parameters. Endocrinology 132, 1108–1114.
Stoebel, D.P., Moberg, G.P., 1982. Effect of adrenocorticotropin and cortisol on luteinizing hormone surge and estrous behaviour of cows. J. Dairy Sci. 65, 1016–1024.
Taya, K., Watanabe, G., Sasamoto, S., 1985. Radioimmunoassay for progesterone, testosterone and estradiol-17b
using125I-iodohistamine radioligands. Jpn. J. Anim. Reprod. 38, 186–197.
Watson, E.D., Munro, C.D., 1984. Adrenal progesterone production in the cow. Brit. Vet. J. 140, 300–306. Wiltbank, J.N., 1966. Modification of ovarian activity in the bovine following injection of oestrogen and
gonadotrophin. J. Reprod. Fertil. (Suppl.) 1, 1–10.