SYSTEMS BASED ON PHOTOGRAMMETRY TO EVALUATION OF BUILT
HERITAGE: TENTATIVE GUIDELINES AND CONTROL PARAMETERS
J. Valença a, *
a ICIST, Polytechnic Institute of Coimbra, Rua Pedro Nunes - Quinta da Nora 3030-199, Coimbra, Portugal - [email protected]
Commission V, Working Group V/2
KEY WORDS: Photogrammetry, Monitoring, Assessment, Precision; Accuracy.
ABSTRACT:
Technological innovations based on close-range imaging have arisen. The developments are related with both the advances in mathematical algorithms and acquisition equipment. This evolution allows to acquire data with large and powerful sensors and the fast and efficient processing of data. In general, the preservation of built heritage have applied these technological innovations very successfully in their different areas of intervention, namely, photogrammetry, digital image processing and multispectral image analysis. Furthermore, commercial packages of software and hardware have emerged. Thus, guidelines to best-practice procedures and to validate the results usually obtained should be established. Therefore, simple and easy to understand concepts, even for non-experts in the field, should relate the characteristics of: (i) objects under study; (ii) acquisition conditions; (iii) methods applied; and (iv) equipment applied. In this scope, the limits of validity of the methods and a comprehensive protocol to achieve the required precision and accuracy for structural analysis is a mandatory task. Application of close-range photogrammetry to build 3D geometric models and for evaluation of displacements are herein presented. Parameters such as distance-to-object, sensor size and focal length, are correlated to the precision and accuracy achieved for displacement in both experimental and on site environment. This paper shows an early stage study. The aim consist in defining simple expressions to estimate the characteristics of the equipment and/or the conditions for image acquisition, depending on the required precision and accuracy. The results will be used to define tentative guidelines considered the all procedure, from image acquisition to final results of coordinates and displacements.
1. INTRODUCTION
In the last decade, distinct technological innovations, based on close-range imaging, have arisen. The developments are related to advances in mathematical algorithms, allowing detailed processing of a large amount of data, and equipment acquisition, which provide powerful and large sensors to collect and store relevant data about objects and surrounding environment. In general, the preservation of cultural heritage have applied these technological innovations very successfully in their different areas of intervention. In particular, considering built heritage, techniques based on processing of digital images has been widely applied, namely, photogrammetry, digital image processing and, more recently, multispectral image analysis (Hemmleb et al., 2006; Kauffmann, 2002; Lerma et al., 2011; Maas and Hampel, 2006; Valença et al., (in press)). Furthermore, commercial packages of software and hardware have emerged, allowing non-specialists to apply the techniques above mention in their daily routines. In addition, the acquisition of such equipment at reasonable costs, increases its area of application in both research and industry sectors. This poses new challenges, which require appropriate responses. Thus, guidelines to best-practice procedures and to validate the results usually obtained should be established. Therefore, simple and easy to understand concepts, even for non-experts in the field, should relate the characteristics of: (i) objects under study; (ii) acquisition conditions; (iii) methods applied; and (iv) equipment applied.
The interventions on built heritage typical consists in conducting a visual inspections to detect damaged areas, and
performing non-destructive tests whenever required, to help establishing a diagnosis and defining an intervention plan. Nowadays, photogrammetry and laser-scanning are used to obtain geometric 3D information of built constructions, and methods based on processing of both RGB and multispectral images allows mapping the state of conservation of façades, applying classification algorithms to support the diagnosis of the state of conservation of built heritage (Crespo et al., 2010; Hemmleb et al., 2005; Kauffmann, 2002; Lerma et al., 2011; Remondino, 2011; Rinaudo et al., 2010 ; Valença et al., 2013b; Valença et al., 2012). Another emergent application of these methods consists in support the definition of maintenance plans, since built heritage requiring long-term preservation. Once again, the limits of validity of the methods and a comprehensive protocol to achieve the required precision and accuracy for structural analysis is a mandatory task, i.e, guidelines should be drawn by multidisciplinary teams of experts in all the fields involved.
Application of close-range photogrammetry to build 3D geometric models and evaluation of displacements are herein presented. Parameters such as distance-to-object, sensor size and focal length, are correlated to the experimental precision and accuracy achieved. This paper shows an early stage analysis, aiming to define simple expressions to estimate the characteristics of the equipment and/or the conditions for image acquisition, depending on the required precision and accuracy. Later on, the results will be used to define tentative guidelines considered the all procedure, from image acquisition to final results of coordinates and displacements.
2. PHOTOGRAMMETRY: PRECISION AND ACCURACY
Relevant structures such as bridge and important buildings need to be continuously assessed in terms of their structural behaviour. In this scope, photogrammetry enables to capture three dimensional information of constructions. Furthermore, photogrammetry can be used in situations where the application of traditional methods is difficult or even unviable, e.g, measure displacement during load tests (Fraser and Riedel, 2000; Jiang et al., 2008; Maas and Hampel, 2006; Valença et al., 2012).
Briefly, the precision of a measurement system is related to their reproducibility and repeatability, i.e the capacity of the method or equipment to repeated measurements under unchanged conditions, obtained the same results (Slama, 1980; Soong, 2004). Accuracy is the difference between the value obtained and the true value or ground-truth. Since it is only possible to achieve absolute truth theoretically, in Section 4 values of relative accuracy were discuss (Slama, 1980; Soong, 2004). In this case it is important to obtain comparative measures with equal to or higher precision than the method under study.
After a good calibration of the set camera-lens, the precision and accuracy achieved relates directly to the following parameters: focal length (f); distance to object (D); sensor size, i.e. the number of lines (L) and columns (C). This parameters allows to compute the the ground size of the pixel (pix).
The ground precision of a project in the image plan can be
σzx = target precision in the image (pixel) D = distance to object
f = focal length
pix = pixel size (mm/pixel)
The final precision is usually given in terms of root mean square (RMS)
In the experimental tests presented in Section 4.2.2, the precision was also experimentally computed, namely, the repeatability of the method: (i) comparing the coordinates of the static targets during the test, when multistation approaches was used; or (ii) repeating ten times the all procedure at initial stage, before starting to apply the load, when single image approaches was applied. Average, RMS and standard deviation precision were computed.
3. METHODS
The methods used to obtain the photogrammetric data showed and analysed in Section 4 can be divided into two distinct groups, according to the photogrammetric model applied, namely, multistation and single image approaches. In terms of case studies, two main groups can be analysed, on site tests and experimental tests. In any case, reach acceptable measurement values require sub-pixel accuracy algorithms as a pre-requisite, specially, since off-the-shelf cameras were used (Maas and Hampel, 2006).
3.1 Multi-station approaches
In the multistation approach, besides the movable targets placed on the structure, static targets, positioning on the structure’s neighbourhood were require. These are used as reference points and ground-truth constraints (Valença et al., 2012). Image acquisition of the network area including both sets, static and movable, targets in all the stages evaluated.
3.2 Single image approach
Since usually in civil engineering problems only displacements in image plan are relevant, a single image approach, applying a homography to obtain the ground coordinates, appears to be a clever alternative (Valença et al., 2013a). This procedure requires painting a regular grid of circular targets in the surface of the specimen. Furthermore, allows greater profitability, particularly in the evaluation of vast experimental campaigns, since the cameras remains fixed during the entire process.
4. CASE STUDIES
The evaluation of the state of conservation of Built Heritage requires the analysis of its structural behaviour. Thus, generating 3D models is required for numerical analysis and, usually, there are no drafts or plans of such constructions. Structural monitoring is another essential task to correctly understand their structural behaviour. In this scope, characterize the geometry at several stages is crucial, allowing displacement assessment.
4.1 Geometric survey of structures
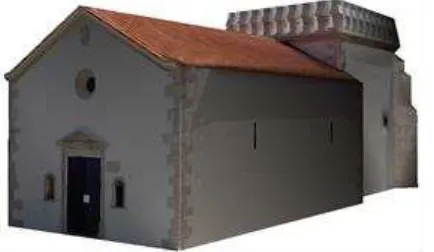
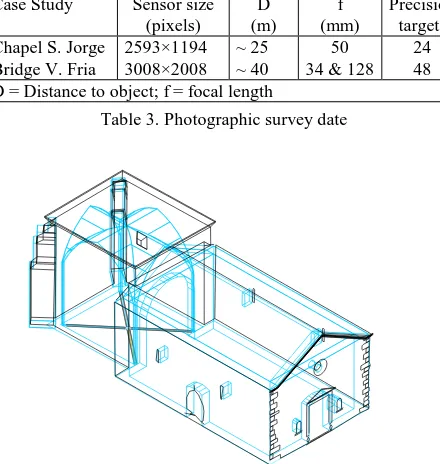
In this section, photogrammetric projects of two constructions have been selected to analyse: Chapel of S. Jorge of Aljubarrota (Fig. 1) and the Stone Bridge of Vila Fria (Fig.2), in Portugal. In both cases, a multistation approach was applied (Valença et al., 2006) and the geometric model obtained was used to build the numerical model for structural analysis. The equipment and condition of the photographic survey is shown in Table 3. In these cases, the major part of the points used were natural targets and just 24 and 48 photogrammetric targets were used in the Chapel of S. Jorge of Aljubarrota and in Stone Bridge of Vila Fria, respectively.
Figure 1. Chapel of S. Jorge of Aljubarrota (3D image-based rendering model).
Figure 2. Stone Bridge of Vila Fria surrounding area had no significant restrictions to the photogrammetric survey. The points used reach a RMS precision of 1.15 pixel. However, the photogrammetric survey proved to be reliable since average difference of 0.35% were achieved when comparing with a topographic survey, the traditional technique commonly used (Fig.4). A structural analysis was performed using the Finite Elements Method.
Case Study Sensor size
Figure 4. Overlapping 3D models generated by photogrammetry and topography of Chapel of S. Jorge
The procedure followed in the Stone bridge of Vila Fria consisted of producing individual projects for each arc, and then assembling the individual projects into a global project. The 800 points used reach a RMS precision of 1.26 pixel. The comparison with the project plans results in average differences of 1.7% and 1.2% for the radius and spans of the arches, respectively. The total span of the bridge shows a variation of 0.7% (Fig.5). The values decrease to 0.14% in the 48 precision targets. A consequent structural analysis, carried out using the Discrete Elements Method, showed that photogrammetry models lead to safer estimates of the failure load, due to the
antisymmetry of the ‘real structure’ (photogrammetric model) relatively to the initial project.
Figure 5. 3D geometric models of the Stone Bridge of Vila Fria
4.2 Displacements fields
The relative displacements are obtained by the direct differences of coordinate between the stages evaluated. The unchanged local coordinate reference system should be defined with great precision, preferably greater than the precision of the monitored points.
4.2.1 Bridge load tests
Photogrammetry was applied to measure vertical displacements in two bridges during load tests: a Steel Footbridge linking the sides of São Roque and Botirões channels in Aveiro’s estuary (Fig.7) and an Iron Bridge in Praia do Ribatejo, over Tejo river (Fig.8), both in Portugal. The equipment and condition of the photographic survey is shown Table 6.
Case Study Sensor size structure composed of 55 modules (1.5 m each) consisting in a grid made of longitudinal, radial and diagonal steel profiles. Before the inauguration, the structural behaviour of the bridge had to be assessed. In this case, static and dynamic tests were performed. After discarding the traditional monitoring, due to the difficulty of implementing, it was decided to use photogrammetry to measure the displacement of the bridge subjected to static load tests (Valença et al., 2012). For that purpose, a total of 83 targets were glued to external steel beam that supports the wooden deck. Three photogrammetric projects were analysed: (i) before loading; (ii) with the bridge loaded; and (iii) after unloading. The orientation and the scale of the projects were determined using static points (RMS precision of 0.48 pixels), with known coordinates, placed in the abutments. The photogrammetric projects achieved a RMS precision of 3.07 mm for vertical displacements. Since is not possible to evaluate the relative accuracy, and the test was conducted under materials elastic stage, the target position before loading and after unloading was compared: 3.1 mm, in SE side; 2.7 mm, in SW side; and 1.8 mm, in NE side, on average. These values can be assumed as the experimental precision and are all equal or The International Archives of the Photogrammetry, Remote Sensing and Spatial Information Sciences, Volume XL-5, 2014
lower than the RMS precision (3.07 mm). These results, which represent 10% of the measured displacements, allow a high confidence in the values recorded.
Figure 7. Footbridge in Aveiro’s estuary
The Iron Bridge in Praia do Ribatejo has a length of 501.5 m, in a total of 8 spams. The supports and columns, in limestone, making an angle of approximately 60° with the axis of the bridge. The bridge has two plan principal trusts with 6.0 m height, organized in modules with 5.0 m long in the spams and 2.5 m on the supports. In this case, the characterization of the structural behaviour of the bridge, aiming to assess the need for consolidation and/ or strengthening, was required. In this scope, the experimental displacements during static load test were achieved by photogrammetry (Júlio et al., 2011). Photogrammetry was applied to measure vertical displacement in the sixth, seventh and eighth spams (from the left margin). Eight of the 17 targets placed where also monitoring with a total station Leica TS02 (precision of 5 mm) to compare the results. The photogrammetric projects achieved a RMS precision of 2.0 mm. The difference for the total station were, on average, 1.6 mm, which represents 15% of the displacement measures, which is lower than the precision of any of the methods used. This fact ensures the reliability of the results.
Figure 8. Bridge in Praia do Ribatejo, over Tejo river
4.2.2 Experimental test
In this section, photogrammetric projects were performed under more controlled conditions. Application of both multistation and single image approaches are herein presented. The equipment used and condition for survey is shown in Table 14 Multistation approach
Two High Strength Reinforced Concrete (HSC) beams with 20 m span and an I cross-section with a width of 0.30 m and a height of 0.50 m were tested and monitoring with photogrammetry (Valença et al., 2012). One of the beams is
monotonically tested until failure and the remaining one were subjected to a permanent load to study their time-dependent behaviour, mainly due to creep (Fig.10). A multistation approach was applied and photogrammetric surveying was performed at three and six stages in creep and failure test, respectively. The coordinates of the ~140 targets per stages were evaluated with a RMS precision (image plan) of 0.14 mm in both test. The tests were also monitored with five and nine Linear Variable Differential Transducers (LVDTs) in creep and failure test, respectively. These sections were considered control points and were used to estimate the relative accuracy of the methods. The standard deviation and the average difference between photogrammetric and LVDTs results were 2.00 mm and 2.19 mm, respectively. In percentage, this corresponds to an average difference of 1.0%.
Figure 9. Long spam HSC beams
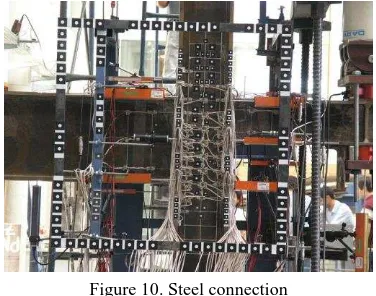
Two ´strong beam/ column/ weak beam’ steel connections were tested and the displacements measure by photogrammetry (Fig.10). The methodology used consisted in framing the steel connection, considering 60 static targets used as ground constraints and control points, and monitoring over 70 movable targets glued to the flanges and to the web of the column (Valença et al., 2012). The multistation photogrammetric surveying was performed at 5 distinct stages and using 6 convergent images per stage, in a total of 1450 point evaluated. An RMS residual error of 0.12 pixels was reached in the image plan, corresponding to 0.02 mm. The experimental precision in the image plan, i.e the displacements of the static points that frame the steel connection, was 0.04 mm, twice the theoretical precision.
Figure 10. Steel connection
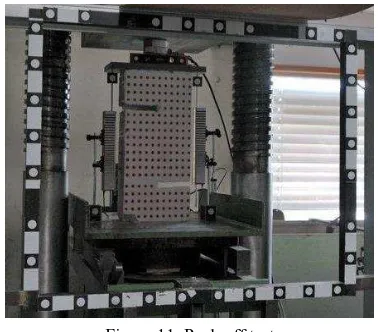
A set of push-off specimens of reinforced concrete were tested until failure. The push-off specimens are anti-symmetrical and composed by two identical ‘L’ shape halves with prismatic envelope of 254×546×127 mm3. Photogrammetric procedure, using, multistation approach,, was applied to obtain the The International Archives of the Photogrammetry, Remote Sensing and Spatial Information Sciences, Volume XL-5, 2014
displacement field during the test (Dias-da-Costa et al., 2011). The surveying was performed at six distinct stages and using 6 convergent image per stage (Fig.11). A total of 1356 points were evaluated. The photogrammetric projects achieved a RMS precision of 0.33 mm in the image plan. The experimental value obtained with the static points was 0.05 mm, completely within the theoretical precision achieved.
Figure 11. Push off test
Single image approach
The Direct Shear Test (DST) was performed in specimens with three concrete layers, each with 100×250×200 mm3. The middle layer was cast with a 50 mm gap at the bottom (Fig. 12). A grid of 649 targets was painted in the surface of the specimen. A total of 6490 points were detected with an experimental precision of 0.12 pixel, corresponding to a precision of 0.03 mm.
Figure 12. Direct Shear Test specimen
A lightweight reinforced concrete (LWRC) beam, 3.0 m long and with a rectangular cross-section of 0.12×0.27 m2 was tested until complete failure (Fig.13). A grid of 560 targets was painted in the surface of the specimen. A total of 5600 targets were detected with an experimental precision of 0.15 pixel, corresponding to a precision of 0.04 mm. The vertical displacement measure with LVDTs (placed in the opposite surface of the beam) reach an average differences of circa 1 mm, corresponding to 2% of the values measured.
Figure 13. LWRC beam
Case Study Sensor size (pixels)
D (m)
f (mm)
Precision targets Long spam beams 3008×2008 4-16 28 120 Steel connection 3264×2448 6-7 35.6 130 Push-off test 3872×2592 2.00 28 226 Direct Shear test 3872×2592 0.90 28 649
LWRC beam 4608×3072 1.75 55 560
D = Distance to object; f = focal length
Table 14. Photographic survey date
4.3 Analyse of results
4.3.1 Geometric survey of structures
The geometric survey of both cases was performed using mostly natural targets. The use of length constrains, obtained using the precision targets allows to build models with the required relative accuracy, always lower than 2%, even for RMS precisions of circa 1 pixels.
4.3.2 Displacements fields
The ration between the experimental precision and the theoretical precision, computed for the last four tests was represented in Figure 15. The values obtained allows to conclude that the experimental precision measure obtained was similar to the theoretical values. The exception was the ration achieved in the push-off tests, where the experimental result is better than the theoretical. This fact allows a high confidence in the experimental results. Furthermore, all the four tests reach an experimental precision lower than 0.2 mm, and 0.05 mm excluding the HSC long span beams tests.
0.0 0.1 0.2 0.3 0.4
0.0 0.1 0.2 0.3 0.4
Ex
p
er
im
en
ta
l
(m
m
)
Theoretical (mm)
Multistation Single image
Figure 15. Theoretical vs. experimental precision in experimental tests.
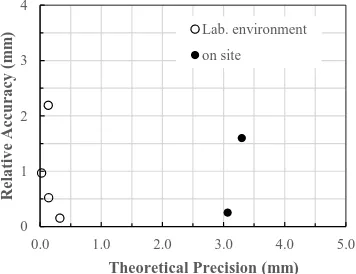
The displacement were always obtained by the coordinate differences between the stages evaluated. The ration between the theoretical precision (Eq.(1)) and the relative accuracy for all the cases studies discussed in Section 4.2 is represented in Figure 16. In general, the higher precise results on higher percentage of displacement accuracy. Once again, the results of the push-off test does not follow the trend of the results of other tests (the borderline value on Lab. Environment series in Fig.16). However, this trend does not occur when comparing the theoretical precision with the absolute value (Fig.17)
0
Figure 16. Theoretical precision (mm) vs. relative accuracy (%).
0
Figure 17. Theoretical precision vs. relative accuracy (in mm).
5. FINAL REMARKS
Innovative application based on close-range imaging have arisen. In particular, despite being a widely applied technique, photogrammetry is nowadays used by professionals in several different areas, using a vast number of available applications in their daily routines. The resume of the study here presented is a kick-start, which aims defining simple expressions to support the evaluation and to establish the limit of validity of photogrammetric projects, in particular, focused on Built Heritage
.
Noted that the parametric studies under development will be extended to characterization of cracks by image processing.Afterwards, all the conclusion will be used to define tentative guidelines considered the all procedure, from image acquisition to final results of displacements and crack pattern.
6. REFERENCES
Crespo, C., Armesto, J., González-Aguilera, D., Arias, P., 2010. Damage detection on historical buildings using unsupervised classification techniques, International Archives of Photogrammetry, Remote Sensing and Spatial Information Sciences, Vol. XXXVIII, Part 5. Commission V Symposium, Newcastle upon Tyne, UK.
Dias-da-Costa, D., Valença, J., Júlio, E., 2011. Laboratorial test monitoring applying photogrammetric post-processing procedures to surface displacements. Measurement 44, 527-538. Fraser, C., Riedel, B., 2000. Monitoring the thermal deformation of steel beams via vision metrology. ISPRS Journal of Photogrammetry & Remote Sensing 55, 268-276.
Hemmleb, M., Weritz, F., Maierhofer, C., 2005. Damage detection on buildings surfaces with multi-spectral techniques, CIPA 2005 XX International Symposium, Torino, Italy. Hemmleb, M., Weritz, F., Schiemenz, A., Grote, A., Maierhofer, C., 2006. Multi-spectral data acquisition and processing techniques for damage detection on building surfaces, in: Maas, H., Schneider, D. (Eds.), Proceedings of the ISPRS Commission V Symposium: 'Image Engineering and Vision Metrology' International archives of photogrammetry, remote sensing and spatial information sciences, Dresden, Germany.
Jiang, R., Jáuregui, D., White, K., 2008. Close-range photogrammetry applications in bridge measurement: Literature review. Measurement 41, 823-834.
Júlio, E., Dias da Costa, D., Valença, J., Rebelo, C., 2011. Caracterização estrutural da ponte da Praia do Ribatejo sobre o rio Tejo, in: Cruz, P., Rebelo, C., Mendonça, T. (Eds.),
ASCP’2011 - Congresso Segurança e Conservação de Pontes,
Coimbra, Portugal.
Kauffmann, M., 2002. Facade interpretation for damage detection, in: ISPRS (Ed.), PCV02 - Photogrammetric Computer Vision ISPRS Commission III, Symposium 2002, Graz, Austria.
Lerma, J.L., Cabrelles, M., Portalés, C., 2011. Multitemporal thermal analysis to detect moisture on a building façade. Construction and Building Materials 25, 2190-2197.
Maas, H., Hampel, U., 2006. Photogrammetric technique in civil engineering material testing and structure monitoring. Photogrammetric Engineering & Remote Sensing 72, 1-7. Remondino, F., 2011. Heritage Recording and 3D Modeling with Photogrammetry and 3D Scanning. Remote Sensing 3, 1104-1138.
Rinaudo, F., Chiabrando, F., Nex, F., Piatti, D., 2010 New instruments and technologies for Cultural Heritage survey: full integration between point clouds and digital photogrammetry. Lecture in computer Science 6436, 56-70.
Slama, C., 1980. Manual of Photogrammetry, 4. ed. American Society of Photogrammetry (ASP), Falls Church, VA USA. Soong, T., 2004. Fundamentals of Probability and Statistics for Engineers. John Wiley & Sons, Ltd., New York.
Valença, J., Dias-da-Costa, D., Gonçalves, L., Júlio, E., Araújo, H., (in press). Automatic concrete health monitoring: assessment and monitoring of concrete surfaces. Structure and Infrastructure Engineering.
Valença, J., Dias-da-Costa, D., Júlio, E., Araújo, H., Costa, H., 2013a. Automatic crack monitoring using photogrammetry and image processing. Measurement 46, 433-441.
Valença, J., Gonçalves, L.M.S., Júlio, E., 2013b. Damage assessment on concrete surfaces using multi-spectral image analysis. Construction and Building Materials 40, 971-981. The International Archives of the Photogrammetry, Remote Sensing and Spatial Information Sciences, Volume XL-5, 2014
Valença, J., Júlio, E., Araújo, H., 2006. Aplications of photogrammetry in civil engineering (in portuguese), Patoreb 2006, Porto, Portugal.
Valença, J., Júlio, E., Araújo, H., 2012. Application of photogrammetry to structural assessment. Experimental Techniques 36, 71-81.