GROUNDWATER SUITABILITY RECHARGE ZONES MODELLING
–
A GIS
APPLICATION
Sumit Dabrala*, Bindu Bhattb, Janak P Joshib, N Sharmac a
NHPC Ltd., Tawang Hydro-Electric Project Stage I, Nehru Market, Distt.: Tawang – 790104, Arunachal Pradesh, India. [email protected]
b
Department of Geography, Faculty of Science, The Maharaja Sayajirao University of Baroda, Vadodara 390 002, Gujarat, India. [email protected] , [email protected]
c
Department of Geology, Faculty of Science, The Maharaja Sayajirao University of Baroda, Vadodara 390 002, Gujarat, India. [email protected]
ISPRS Technical Commission VIII Mid -Term Symposium 2014
KEY WORDS: Hydrology, Decision Support, Thematic, Ground Water Potential Zones (GWPZ), Multi Criteria Decision Making (MCDM), Analytical Hierarchy Process (AHP), Sensitivity Analysis (SA)
ABSTRACT:
Groundwater quality in Gujarat state is highly variable and due to multiplicity of factors viz. influenced by direct sea water encroachment, inherent sediment salinity, water logging, overexploitation leading to overall deterioration in ground water quality, coupled with domestic and industrial pollution etc.The groundwater scenario in the state is not very encouraging due to imbalance between recharge and groundwater exploitation. Further, the demand for water has increased manifold owing to agricultural, industrial and domestic requirement and this has led to water scarcity in many parts of the state, which is likely to become more severe in coming future due to both natural and manmade factors. Therefore, sustainable development of groundwater resource requires precise quantitative assessment based on reasonably valid scientific principles. Hence, delineation of groundwater potential zones (GWPZ), has acquired great significance.
The present study focuses on the integrated Geospatial and Multi-Criteria Decision Making (MCDM) techniques to determine the most important contributing factors that affect the groundwater resources and also to delineate the potential zones for groundwater recharge.The multiple thematic layers of influencing parameters viz. geology, geomorphology, soil, slope, drainage density and land use, weightages were assigned to the each factor according to their relative importance as per subject experts opinion owing to the natural setup of the region. The Analytical Hierarchy Process (AHP) was applied to these factors and potential recharge zones were identified. The study area for the assessment of groundwater recharge potential zones is Mahi-Narmada inter-stream region of Gujarat state. The study shows that around 28% region has the excellent suitability of the ground water recharge.
1. INTRODUCTION
The rate of withdrawal of groundwater is increasing continuously due to rapid growth of population accompanied by agricultural and industrial development. It may be noted that not only its demand has increased over years but it seems that the demand will never cease. The total water requirement of India by the year 2050 has been estimated at 1,450 km3/year (MOWR 1999). This is significantly more than the current estimate of utilizable water resources potential of 1,122 km3/year (surface water=690 km3/year and groundwater=432 km3/year) through conventional development strategies (Gupta and Deshpande 2004).
Groundwater occurrence being subsurface phenomenon, its identification and location is based on indirect analysis of some directly observable terrain features. The identification and location of groundwater resources using remote sensing data is based on an indirect analysis of some directly observable terrain features like geomorphology, geology, slope, land use/ land cover and hydrologic characteristics.
Geological methods, involving field reconnaissance and interpretation of geologic data, represent an important foremost step in any ground water investigation. Remote sensing data from aircraft or satellite has become an increasingly valuable tool for understanding subsurface water condition (Todd, 1980). As groundwater is dynamic and interdisciplinary in nature, Geospatial tool becomes very useful in various aspects of groundwater studies. Blending of the remote sensing and GIS techniques has been proved to be an efficient tool in groundwater studies (Gustafsson, 1993; Saraf and Jain, 1994;
Krishnamurthy and Srinivas 1995, Krishnamurthy et. al. 1996, Dabral et.al 2013 ).
There is growing interest in incorporating GIS capability with multi-criteria decision-making (MCDM) processes. As GIS-based MCDM becomes one of the most useful methods for spatial planning and management (Joerin et al., 2001; Karnatak, et al., 2007; Chen et al., 2007; Chen et al., 2009 ). Application of the Analytical Hierarchy Process AHP, (Saaty, 1977, 1980; Saaty and Vargas, 1991) is one of the most popular methods to obtain spatial plan, resource allocation etc .
The GIS-MCDA research has made considerable contribution to the participatory GIScience (Jankowski and Nyerges 2001). Consequently, the GIS-MCDA support systems have the potential to improve collaborative decision-making process by providing a flexible problem-solving environment where those involved in collaborative tasks can explore, understand, and redefine a decision problem (Feick and Hall 1999, Jankowski and Nyerges 2001, Kyem 2004)
Recent developments in spatial analysis show that geo-computation (computational intelligence) offers new opportunities for GIS-MCDA (Wu 1998, Zhou and Civco 1996, Bennett et al. 1999, Xiao et al. 2002). Geo-computational tools can potentially help in modeling and describing complex systems for inference and decision-making. An integration of MCDA and geo-computation can enhance the GIS-MCDA capabilities of handling larger and more diverse spatial data sets. Another significant trend has been associated with developing map-centered exploratory approaches to GIS-MCDA (Armstrong et al. 1992, Jankowski et al.2001, Andrienko and Andrienko 2003).
2. THE STUDY AREA
2.1 Geographical location
The study area constitutes a part of Mahi - Narmada interstream region. It has a distinct physiographic boundary and is bordered by the Gulf of Cambay in the West, the rocky uplands in the East, Mahi River in the North and Narmada River in the South and sprawl in an area of about 11,000 sq km. The area lies between 72º 30’ E and 73º 43’ E longitudes and 21º 40’ N and 22º 53’ N latitudes (Figure 1). (Dabral Sumit, 2009).
Figure 1. Study Area
2.2 Geology
The study area constitutes a part of central Gujarat and its geology is represented by Precambrian crystalline, sedimentary rocks of Mesozoic (Cretaceous), Deccan traps of Tertiary and soft sediments deposits of Quaternary periods (Merh, 1995) A major part of the main landform within the alluvium tectonics domains of Cambay and Narmada rift systems
potential suitability.
Figure 2. Reclassified Geology as per suitability The alluvial tract being part of “Gujarat alluvial plains” comprises huge thickness of marine, fluvial and aeolian sediments deposited during the Quaternary period (Merh and Chamyal,1997). Based on the hydrogeological characteristics of different rock types, weightage was assigned to various groundwater potential categories and based on the weightage various lithologies in the study area have been reclassified in terms of their groundwater 2.3 Hydro-geomorphology
The study area has varieties of landforms created by the various processes of fluvial, aeolian and marine environments. The western part is characterized by pedeplains of sedimentaries and metasedimentaries, Deccan plateau, eroded land, dissected plateau, hills, residual hills etc. while central part is monotonous
formed by a vast stretch of alluvial plains. (Dabral Sumit, 2009) The eastern part is characterized by coastal alluvial plains which have been developed due to tectonics and climate. Weights are assigned on the basis of hydrological characteristic of these geomorphic features.
Figure 3. Reclassified Hydro-geomorphology as per suitability.
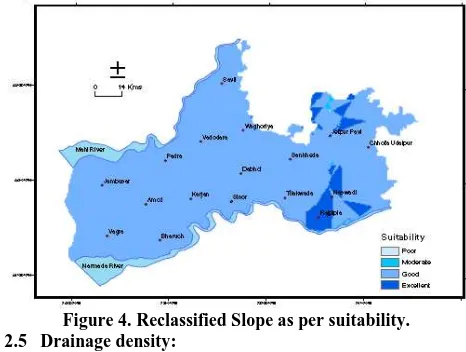
2.4 Slope
Slope has a direct control on the surface runoff and infiltration processes. Infiltration is inversely related to slope, gentle slopes coupled with vegetative cover will have higher infiltration and less runoff. Slope map has been generated using SRTM. The slope analysis was carried out to classify the area according to groundwater holding capacity.
Figure 4. Reclassified Slope as per suitability. 2.5 Drainage density:
In general, high drainage density reflects high runoff and low infiltration while low drainage density denotes low runoff and high infiltration (Chow, 1964).Three west flowing rivers along with their tributaries drain the area. Among the three, the centrally flowing Dhadhar river along with five tributaries debouch into Gulf of Cambay. The major part of the study area is covered by the watershed basin of Dhadhar river which forms large elongated basin, gently sloping south-westerly. Study area was divided into square grids of 10 x10 km and streams in each grid were calculated in order to determine the drainage density values. These values were regrouped to produce a drainage density map and accordingly reclassified The International Archives of the Photogrammetry, Remote Sensing and Spatial Information Sciences, Volume XL-8, 2014
drainage map has been prepared.
Figure 5. Reclassified Drainage density as per suitability.
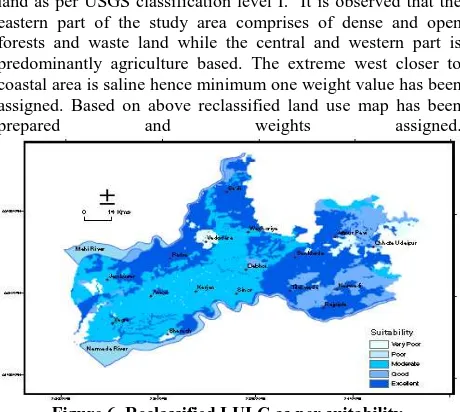
2.6 Land use:
The term land use refers to man’s activities on land which are directly related to land. Satellite image of Landsat ETM+, 2001 for the post monsoon was used for visual classification The study area was classified into eight major land use classes i.e. agriculture, water body, forest, fallow land, wasteland, saline land as per USGS classification level I. It is observed that the eastern part of the study area comprises of dense and open forests and waste land while the central and western part is predominantly agriculture based. The extreme west closer to coastal area is saline hence minimum one weight value has been assigned. Based on above reclassified land use map has been
prepared and weights assigned.
Figure 6. Reclassified LULC as per suitability.
2.7 Soils:
The soils have varying degree of average water capacity from low to high depending upon textural variation. While the soil occurring on the coastal plains are dominantly very deep, imperfectly to poorly drained and fine textured soils are slightly to moderately alkaline and calcareous and salt affected. The eastern part of the study area characterized by highland and piedmont zone display wide variation in soil types attributed to varied rock types. The soils in rocky outcrops are shallow. In other areas it is shallow to deep and at places very deep, well drained, and calcareous to clayey fine soils associated with slight to moderate erosion. (NBSS and LUP, 1994).
Figure 7. Reclassified Soil as per suitability.
3. METHODOLOGY
Multiple thematic layers of influencing parameters viz. geology, geomorphology, soil, slope, drainage density and land use, were assigned the ranks as per their conducive nature towards the water percolation. Weightage were assigned to the each factor according to their relative importance derived from the judgement of the pair wise comparison in the AHP. The layers were linearly weighted with the weights given in Table 4. To produce the suitability map and the groundwater potential map was derived on the basis of assigned ranks to the layer features and the weights to the individual layer. The isotopic content of oxygen and its distribution was plotted and isolines were superimposed on the derived map. The δ18
O value was measures from 55 collected samples distributed over the study area.
3.1 Analytic Hierarchy Process:
Multi-criteria decision making implies a process of assigning values to alternatives that are evaluated along multi-criteria. The analytic hierarchy process (AHP), developed at the Wharton School of Business by Thomas Saaty (1980), allows decision makers to model a complex problem in a hierarchical structure showing the relationships of the goal, objectives (criteria), sub-objectives, and alternatives. The Analytic Hierarchy Process technique allows preferences of decision groups to be incorporated into a planning problem. It actually provides a framework for structuring the problem as a hierarchy where preferences of decision groups can be elicited as weights by pair wise comparisons. The AHP is based on the subdivision of problem in a hierarchical form. The fundamental principle of the analysis is possibility of connecting information, based on knowledge and tools, to make decisions or previsions.
Saaty’s (1977 and 1980) Analytical Hierarchy Process is a popular means to determine the weights which is one of the classical problems in multi-criteria decision analysis. The AHP is a mathematical method of analysing complex decisions problem with multiple criteria. It is based on three principles: decomposition, comparative judgment and synthesis of priorities. The decomposition principle of AHP requires the decision problem to be decomposed into a hierarchy that captures the essential element of the decision problem. An importance scale is proposed for these comparisons based on a large number of experiments (Table 1). The standard method used to calculate the values for the weights from an AHP matrix is to take the eigenvector corresponding to the largest eigen values of the matrix, and then to normalize the sum of the components to one.
The consistency index CI, defined by (λmax-n)/(n-1), gives information about logical consistency among pair wise The International Archives of the Photogrammetry, Remote Sensing and Spatial Information Sciences, Volume XL-8, 2014
comparison judgments in a perfect pair wise comparison case. When CI=0.0, there is no logical inconsistency among the pair wise comparison judgments, or the judgment is considered 100% consistent. As the value of CI grows, the degree of logical inconsistency among the pair wise comparison judgments is also considered to grow. In this study CI value is 0.073, which means there is the inconsistency between the subjective judgements in the pair wise comparison of the parameter.
Intensity slightly favour one over the other
5 Much more the other is of the highest possible validity 2, 4, 6, 8 Intermediate
values
When compromise is needed
Table 1.Saaty’s pairwise comparison table with 9 degrees
n 3 4 5 6 7 8 9 10
RI 0.5
8 0.9 1.1
2 1.24 1.32 1.41 1.45 1.49
Table 2. Random indices from (Saaty, 1977).
A Consistency Ratio is a comparison between Consistency Index and Random Consistency Index.
CR = CI / RI If the value of Consistency Ratio is smaller or equal to 10%, the inconsistency is acceptable.
Paramete subjective judgment should be revised. In the present study the λmax value obtained is 6.7 and the Consistency ratio (CR) of 0.06 < 0.10, which suggest that the inconsistency is acceptable for this 6 parameter under consideration.
3.2 Sensitivity Analysis (SA):
The final step of the decision process is the sensitivity analysis, Sensitivity analysis is the study of how the inconsistency in the output of model can be distributed to different sources of uncertainty in its input. The input data are slightly modified in order to observe the impact on the results. As complex decision models may be inherently unstable, it allows the generation of different scenarios. The sensitivity analysis in expert choice allows the variation the weights of the criteria only as input data. (Ishizaka, A. and Labib, A., 2011). There are several core methods to evaluate the SA. Variance based methods, one at a time (OAT), regression analysis.
In the present paper for the spatial decision process; i. The map removal SA was performed. This test represents the sensitivity associated with removing one or more maps. (Lodwick et al. 1990) and ii. the single parameter sensitivity test (Babiker et al. 2005; Hammouri et. al.,2012).
P: Potential value computed using Equation (1) in each cell. P': Represents the potential value of each cell excluding the one parameter.
The single parameter sensitivity analysis is used to assess the influence of each of the parameters of the model on the potentiality or vulnerability measure. (Inza Doumouya et.al. 2012). In this analysis, the effective weight of each parameter is compared to the assigned or theoretical weight. The effective The International Archives of the Photogrammetry, Remote Sensing and Spatial Information Sciences, Volume XL-8, 2014
Where, w and s are, respectively, the weights and scaled values for the parameter X assigned in each cell, and P is the potential value as computed. For each cell, the sum parameter effective weights are 100% for the Six parameters.
Paramete
Table 5. Single parameter sensitivity analysis of groundwater potentiality indicator (Effective weights) suitable for the groundwater recharge.
Figure 8. AHP derived Groundwater Suitability recharge zone map
The excellent recharge zones can be seen in the west part of the study area followed by the western part and central part of the study area.
The result was overlaid with the δ18
O isoline to validate the corresponding recharge zones. It is clearly seen that few pockets of excellent zones are of alluvial plains.
The highlands and the alluvial plains are showing depleted δ18O‰ values (-3.5‰ to -1.5‰). This is in conformity with the fact that highlands and alluvial plains are the main zones of
recharge to groundwater mainly through rainfall infiltration. (Dabral et.al. 2013).
The AHP result shows that the geology, hydro-geomophology and drainage density shares the higher weightage for the demarcation of the probable groundwater recharge zones. However this approach is subjective and it requires the through understanding of the field and the subject in the weighting and selection of factors. The sensitivity analysis shows that the impact of drainage density (32.57%), geology (33.5%), LULC (7.14%) and Slope (11.6%) are most effective in the assessment which has relatively larger effective weight as compared to the assigned weights. (Table 5.) The remaining parameters hydro-geomorphology, soil, on the contrary, exhibited lower effective weight. The results of the map removal sensitivity analysis computed by removing one data layer at a time are presented in Table 6. The geology, drainage density, hydro-geomorphology are the most sensitive parameters to groundwater potentiality.
5. CONCLUSION
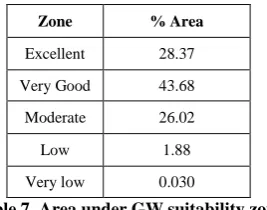
Geospatial technologies play a crucial role in the development of effective decision support systems or expert systems for the sustainable development and management of vital but dwindling water resources. Integrating Multi-Criteria Decision Making (MCDM) with GIS for spatial decision-making purposes is both important as it create the opportunity for the increased use of GIS based technology as the basis of decision support systems. The present result shows that, the study area has around 70% potential recharge suitability. The alluvial zone region marked with 28.37% coverage having excellent situation with most conducive condition existing in the region.
Table 7. Area under GW suitability zone
Thus this region is capable of developing good groundwater resource if it is well planned and managed properly. The geospatial application in the hydrological studies along with the holistic approach for in-situ conservation of ground water resource can help this region to have sustainable development.
REFERENCES
Alessio Ishizaka, Ashraf Labib, 2011. Review of the main developments in the analytic hierarchy process, Expert Systems with Applications, 38(11), pp 14336-14345, ISSN 0957-4174, Andrienko, N. And Andrienko, G., 2003, Informed spatial decisions through coordinated views. Information Visualization, 2, pp. 270–285.
Armstrong, M.P., Densham, P.J., Lolonis, P. And Rushton, G., 1992. Cartographic displays to support locational decision-making. Cartography and Geographic Information Systems, 19, pp. 154–164.
Bennett, D.A., Wade, G.A. And Armstrong, M.P., 1999, Exploring the solution space of semi-structured geographical problems using genetic algorithms. Transactions in GIS,3, pp. 51–71.
Chen, Y., S. Khan, and Z. Paydar, 2007. Irrigation intensification or extensification assessment using spatial modelling in GIS. In MODSIM 2007 International Congress on Modelling and Simulation, December 2007,
Chen, Y., S. Khan, and Z. Paydar, (2009, published online). To Retire or Expand? A Fuzzy GIS-based Spatial Multi-criteria Evaluation Framework for Irrigated Agriculture. Irrigation and Drainage.
Choudhury, P. R., 1999. Integrated Remote Sensing And GIS Techniques For Groundwater Studies In Part of Betwa Basin, Ph.D. Thesis (Unpublished), Department Of Earth Sciences, University of Roorkee, India.
Chow Ven Te. 1964., Handbook of Applied Hydrology. Mc Environment and Earth Science, 3(2), pp 134-144.
Dabral, S., 2009, Applied Hydrogeological Studies on the Alluvial Deposits Between Lower Reaches of Applied Hydrogeological Studies on the Alluvial Deposits Between Lower Reaches of Mahi and Narmada Rivers, Gujarat. Unpublished Ph.D. thesis, The Maharaja Sayajirao University of Baroda.
Dabral, Sumit., Sharma, N., Bhatt, B., Joshi, J. P., 2013. A geospatial technique for demarcating ground water recharge potential zones: A study of Mahi - Narmada Inter stream region, Gujarat. International Journal of Geomatics and Geosciences, 4(1), pp177-185.
Dabral, S., Sharma, N., Bhatt, B., Joshi, J.P., 2013. Application of GIS in Validating Groundwater Recharge Zone Using Oxygen Isotope. Geoscience Research, 4 (1), 112-115.
Feick, R.D. and Hall, B.G., 2004. A method for examining the spatial dimension of multicriteria weight sensitivity. International Journal of Geographical Information Science,18, pp. 815–840.
Gupta, S.K., Deshpande R. D., 2004. Water for India in 2050: first-order assessment of available options. Curr Sci 86(9):1216–1224
Gustafsson, P., 1993. High resolution satellite data and GIS as a tool for assessment of groundwater potential of s semi-arid area. In: IXth Thematic Conference on Geologic Remote Sensing. 8-11 February, 1993 at Pasadena, California, USA.
Inza Doumouya, Brou Dibi, Kouassi Innocent Kouame, et.al 2012 Modelling of favourable zones for the establishment of water points by geographical information system (GIS) and multicriteria analysis (MCA) in the Aboisso area (South-east of Côte d’Ivoire).Environ Earth Sci, 67, pp.1763–1780.
Jankowski, P. and Nyerges, T., 2001, Geographic Information Systems for Group Decision-making: Towards a Participatory, Geographic Information Science (New York: Taylor & Francis
Jankowski, P., Andrienko, N. And Andrienko, G., 2001, Map-centred exploratory approach to multiple criteria spatial decision making. International Journal of Geographical Information Science, 15, pp. 101–127.
Joerin, F., M. Theriault, and A. Musy, (2001), Using GIS and outranking multicriteria analysis for land-use suitability assessment. International Journal of Geographical Information Science, 15(2), 153-174.
Karnatak, H. C., S. Saran, K. Bhatia, and P. S. Roy, 2007. Multicriteria spatial decision analysis in web GIS environment. Geoinformatica, 11,407–429. Manivel, M., (1996), An Approach to Demarcate Ground water Potential Zones through Remote Sensing and A Geographical Information System, Journal of Remote Sensing, 7, pp 1867-1884.
Kyem, P.A.K., 2001, An application of a choice heuristic algorithm for managing land resource allocation problems involving multiple parties and conflicting interests. Transactions in GIS, 5, pp. 111–129.
Lodwick W.A., Monson, W., Svoboda, L., 1990. Attribute error and sensitivity analysis of map operations in geographical informationsystems: suitability analysis. Int J Geogr Inform Syst,4(4): pp 413–428.
Merh, S. S. (1995), Geology of Gujarat. Geol. Soc. India, Bangalore, p 219
Merh, S. S., Chamyal, L.S. (1997), The Quaternary Geology of the Gujarat alluvial plains. Geol. Soc. India, Bangalore, p 219.
MOWR (1999) Integrated water resource development: a plan for action. Report of the National Commission for Integrated Water Resources Development Plan, Vol. 1, Ministry of Water Resources (MOWR), Government of India, New Delhi
NBSS and LUP, (1994), Soils of Gujarat for Optimising Land Use, National Bureau of Soil Survey (NBSS) and Land Use Planning (LUP), Nagpur, NBSS Publ.29b, ISBN: 81-85460-13-2.
Nezar Hammouri, Ali El-Naqa, Mohammed Barakat., 2012, An Integrated Approach to Groundwater Exploration Using Remote Sensing and Geographic Information System. Journal of Water Resource and Protection, 4, pp. 717-724.
Oxley, L. and Kulasiri, D., (Eds.), Modelling and Simulation Society of Australia and New Zealand, 1321-1327.
P. Napolitano and A. G. Fabbri,. 1996. Single Parameter Sensi-tivity Analysis for Aquifer Vulnerability Assessment Using DRASTIC and SINTACS, Proceedings of the 2nd HydroGIS Conference: International Association of Hydrological Sciences, IAHS Publication 235, pp. 559-566.
Saaty, T.L. 1977. A scaling method for priorities in hierarchical structures. Journal of Mathematical psychology, 15, 231-281.
Saaty, T.L. 1980. The Analytical Hierarchy Process. McGraw Hill, New York.
Saraf, A. K. and Choudhury, P. R. 1998. Integrated remote sensing and GIS for groundwater exploration and identification of artificial recharge sites. International Journal of Remote Sensing, 19(10), pp 1825-1841.
Saraf, A. K. and Choudhury, P. R 1997. Integrated Application of Remote Sensing and GIS Groundwater exploration in hard rock terrain, Proceedings: International Symposium on Emerging trends in Hydrology, Department of Hydrology, Roorkee,September 25-27, 1997, pp 435-442.
Saraf, A. K., Jain, S. K., 1994. Integrated use of Remote Sensing and GIS methods for groundwater exploration in parts of Lalitpur District, U.P. : International Conference on Hydrology and Water Resources. 20-22 December, 1993 at New Delhi, India.
Sumit Dabral et. al. 2013. A geospatial technique for demarcating ground water recharge potential zones: A study of Mahi - Narmada Inter stream region. Gujarat. International Journal of Geomatics and Geosciences , 4(1).
Todd, David K. 1980. Groundwater Hydrology. 2nd Edition. New York: John Wiley and Son.
Wu, F., 1998. SimLand: a prototype to simulate land conversion through the integrated GIS and CA with AHP-derived transition rules. International Journal of Geographical Information Science, 12, pp. 63–82.
Xiao, N., Bennett, D.A. And Armstrong, M.P., 2002. Using evolutionary algorithms to generate alternatives for multiobjective site-search problems. Environment and Planning A, 34, pp. 639–656.
Zhou, J. And Civco, D.L., 1996. Using genetic learning neural networks for spatial decision making in GIS. Photogrammetric Engineering and Remote Sensing, 62, pp. 1287–1295