COMPARATIVE ANALYSIS OF HYPERSPECTRAL AND MULTISPECTRAL DATA
FOR MAPPING SNOW COVER AND SNOW GRAIN SIZE
M. Anul Haqa, *
a
Assistant Professor, NIIT University, Neemrana, 301705, Rajasthan * [email protected]
Commission VI, WG VI/4
KEY WORDS: Hyperion, ASTER, Landsat, Snow grain size
ABSTRACT:
The present study demonstrates the potential of imaging spectroscopy to produce the snow cover maps and estimation of snow grain size in the Himalayan region. Snow cover maps and snow grain size produce from imaging spectroscopy data were also compared with multispectral imagery (i.e. Landsat 8 and ASTER). Snow grain size was estimated using the snow grain index and compared with the asymptotic radiative transfer (ART) theory method. The overall matching area was 78.29% among different snow grain size classes using grain index Method and ART method. An attempt has been made to derive the snow grain size using Landsat 8 and ASTER data for the same area. It was found that grain size derived from Landsat 8 and ASTER data show correlation of 81.67% and 86.34% respectively. The snow cover maps were produced using Normalized Difference Snow Index (NDSI). Snow cover maps were also produced using ASTER imagery for the same area and compared with Hyperion snow cover maps. The correlation between both snow cover maps were show 91% correlation.
1. INTRODUCTION
The monitoring of snow from satellites uses reflected sunlight, emission to determine snow parameters. The received signals at the satellite are affected by snow grain size. Information of snow grain size is crucial to other snow characteristics like snow cover extent, snow depth and snow wetness. Retrieval of grain size using satellite images has been studied in a number of papers. Dozier (1989) has been studying the spectral signature of alpine snow cover. He also tried to find indicators for grain size from the measured reflectance in the various bands. Here one can see that the reflectance is sensitive to the grain size especially in bands 4, 5 and 7, and particularly for small grain sizes for band 5 and 7.
Different authors have used the ART theory to estimate snow grain size (Kokhanovsky and Zege, 2004; Kokhanovskyand Nauss, 2005; Tedesco and Kokhanovsky, 2007; Kokhanovsky and Schreier, 2009). ART theory has also been used by considering the dust/soot effect in the NIR region in addition to ice absorption (Zege et al., 2008) and as ratio techniques of different ice absorption channels (Lyapustin, 2009). In this paper snow grain size were estimated using Grain Index method and asymptotic radiative transfer (ART) theory method using Hyperion imagery. An attempt has been made to estimate snow grain size using Landsat-8 and ASTER imagery. The snow cover maps were also produced using NDSI method.
2. STUDY AREA AND DATA SETS
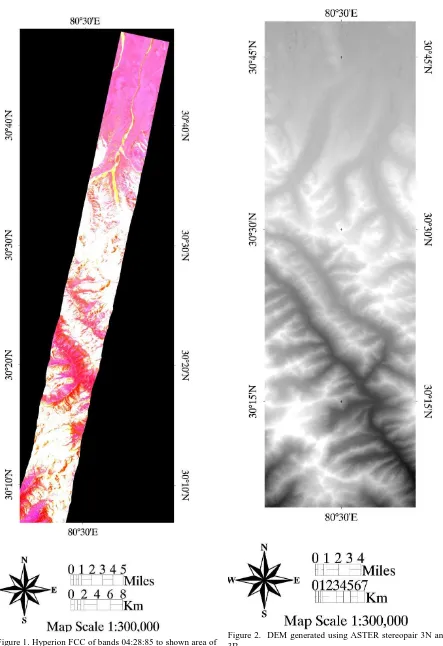
A test site was selected for current investigation as shown in Figure 1. In current investigation Hyperion satellite scenes of spring 2013 were analysed with ASTER and Landsat-8 of similar time.
For generating DEMs from ASTER data level 1A data were used, which are destriped using the respective parameters provided in the image header information
Manual DEM generation approach were used instead of automatic DEM extraction. One main drawback of automatic DEM extraction is that several points on sharp peaks and steep slopes are either float or dig into feature and correction of those points are very tedious. Therefore we used Visual approach by the help of 3d goggles. We focus on the accuracy of DEM in terrain editing and adjusted our points and break lines and contours follows the accurate position as we mark break line exactly on steep slopes and ridges. The vertical accuracy of generated DEM was ±20m (Figure 2).
3. METHODOLOGY
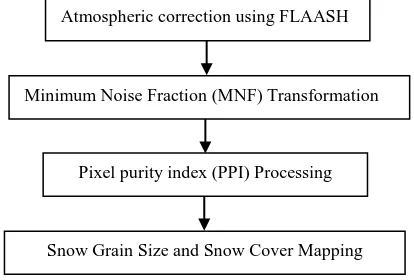
The data are available in 16-bit signed-integer radiance values. The Level-1Gst (L1Gst) digital images of the Hyperion sensor are used in the present study. These images are available in GeoTIFF format. The satellite data were pre-processed in Environment for Visualizing Images (ENVI) software. The steps of data processing are as follows in Figure 3.
Figure 3. Data processing steps
Snow Grain Size and Snow Cover Mapping The International Archives of the Photogrammetry, Remote Sensing and Spatial Information Sciences, Volume XL-8, 2014
3.1 Grain Size Mapping using Hyperspectral Imagery
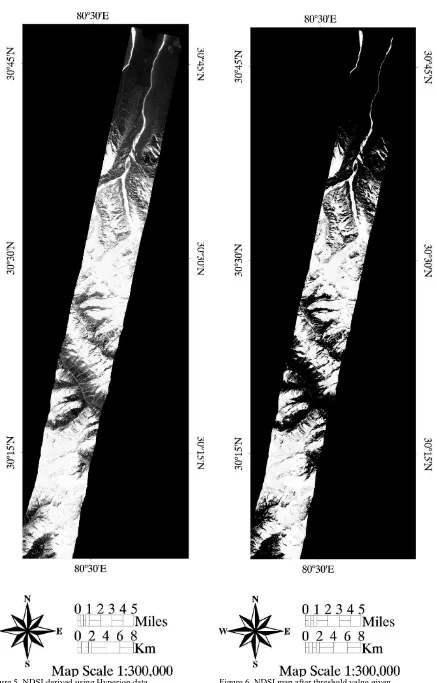
The snow grain size map was estimated using the grain index method proposed by Negi et al. (2010), and used by Negi et al. (2013) based on the field-collected Hyperspectral reflectance data. In the present study, the Hyperion band number 24 (central wavelength 589.62 nm) and band number 90 (central wavelength 1043.59 nm) were used. The snow map consisting of fine, medium, and coarse grain size classes was generated using the threshold grain index values 0.0–0.25, 0.25–0.50, and 0.50–0.83, respectively. To be sure that the index shows snow grain size, one should use a snow classification algorithm in addition to check if there really is snow on the ground (Koren 2009). Therefore Normalized Difference Snow Index (NDSI) was applied on Hyperion scenes (Crane and Anderson 1984, R0reduced to the second order effect manifested in function “f ”. They defined the snow grain diameter (d ) using two channels different ice absorption by:
[ (√ √ )] (3) This equation is valid for vertically homogeneous snow. Here R1 and R2 are such that light penetration depth in snow is similar between the two wavelengths, and these can be selected as 1.05 and 1.24 µm. For inhomogeneous snow, one ice non-absorbing channel (λ1 in visible) and another ice absorbing channel (λ2 in NIR) are required. In this case Eq. (3) reduced to:
( )
where R1 and R2 are the measured reflectance at the visible and NIR channel, respectively.
3.3 Grain Size mapping using Multispectral imagery (Landsat-8 and ASTER)
The pre-processing of Landsat-8 and ASTER imagery has been performed using ENVI 5.3. Snow grain size for multispectral imagery was derived using the approach of Koren 2009. The ratio is a simple method. You only have to use the signals in two channels and do not need information about the terrain as you need in other methods. The studies do not give a calibrated ratio. One specific ratio value does not give an exact grain size value. But the ratio can be used as an index of grain size, the
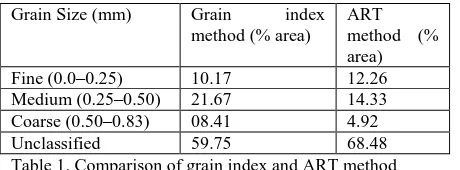
Snow grain size was estimated using the snow grain index and compared with the asymptotic radiative transfer (ART) theory method. The overall matching area was 78.29% among different snow grain size classes using grain index Method and ART method (Table 1). An attempt has been made to derive the snow grain size using Landsat 8 and ASTER data for the same area. It was found that grain size derived from Landsat 8 and ASTER data show correlation of 81.67% and 86.34% respectively with ART method for Hyperion Imagery. The snow cover maps were produced using Normalized Difference Snow Index (NDSI). Snow cover maps were also produced using ASTER imagery for the same area and compared with Hyperion snow cover maps. The correlation between both snow cover maps were show 91% correlation. One purpose of the study was to test the methods that could be used for estimation of grain size in Hyperspectral and multispectral images. As the Landsat and ASTER satellites have broadband spectral bands on the other
Table 1. Comparison of grain index and ART method
REFERENCES
Crane, R. G., and M. R. Anderson., 1984. Satellite Discrimination of Snow/Cloud Surfaces, International Journal of Remote Sensing 5, 213–23
Dozier, J., 1989 Spectral signature of Alpine snowcover from rhe Landsat Thematic Mapper. Remote
Sensing of Environment, Vol. 28, pp 9-22.
Dozier, J., 1989. Estimation of Properties of Alpine Snow from Landsat Thematic Mapper. Advanced Space Research. Vol. 9. No. 1, pp. 207-215.
Kokhanovsky, A. A. and Zege, E. P., 2004. Scattering optics of snow, Applied Optics 43, 1589–1602.
Kokhanovsky, A. A. and Nauss, T., 2005. Satellite based retrieval of ice cloud properties using semianalytical algorithm, Journal of Geophyical Research, 110, D19206, doi:10.1029/2004JD005744.
Kokhanovsky, A. and Schreier, M., 2009. The determination of snow specific surface area, albedo and effective grain size using AATSR space-borne measurements, International Journal of Remote Sensing ,30(4), 919– 933.
Koren H.,2009. Snow grain size from satellite image : A review, Norsk Regnesentral, pp 1-27.
Lyapustin, A., M. Tedesco, Y. Wang, T. Aoki, M. Hori, and A. Kokhanovsky., 2009. Retrieval of Snow Grain Size over Greenland from MODIS, Remote Sensing of Environment113: 1976–87
Negi, H. S., and A. Kokhanovsky., 2011 Retrieval of Snow Grain Size and Albedo of Western Himalayan Snow Cover Using Satellite Data.The Cryosphere 5: 831–47.
Negi H.S., Jassar H. S., Saravana G.,Thakur N. K., Snehmani and Ganju A., 2013. Snow-cover characteristics using Hyperion data for the Himalayan region, International Journal of Remote Sensing, 34:6, 2140-2161
Tedesco, M. and Kokhanovsky, A. A., 2007. The semi-analytical snow retrieval algorithm and its application to MODIS data, Remote Sensing of Environment, 110, 317–331.
Zege, E., Katsev, I., Malinka, A., Prikhach, A., and Polonsky, I., 2008. New algorithm to retrieve the effective snow grain size and pollution amount from satellite data, Annals of Glaciology, 49, 139–144.
Figure 1. Hyperion FCC of bands 04:28:85 to shown area of study
Figure 2. DEM generated using ASTER stereopair 3N and 3B
Figure 3. Snow Grain Map using Grain Index
Figure4. Snow Grain map based on threshold
Figure 5. NDSI derived using Hyperion data Figure 6. NDSI map after threshold value given