Rapid Disaster Analysis based on Remote Sensing:
A Case Study about the Tohoku Tsunami Disaster 2011
C.H. Yang a, *, U. Soergel a, Ch. Lanaras b, E. Baltsavias b, K. Cho c, F. Remondino d, H. Wakabayashi e
a
Technische Universität Darmstadt, Institute of Geodesy, Germany - (yang, soergel)@ipi.uni-hannover.de b
ETH Zurich, Institute of Geodesy and Photogrammetry, Switzerland - [email protected] c
Tokai University, School of Information and Science & Technology, Kanagawa 259-1292, Japan - [email protected] d
Bruno Kessler Foundation, 3D Optical Metrology unit, via Sommarive 18, 38123, Trento, Italy - [email protected] e Nihon University, College of Engineering, I Computer Science, Koriyama, Fukushima, Japan - [email protected]
Commission VII, WG VII/5
KEY WORDS: Disaster Analysis, SAR, Optical Images, Image Co-registration, Change Detection, Image Matching, Curvelet Filtering, Morphological Approach
ABSTRACT:
In this study, we present first results of RAPIDMAP, a project funded by European Union in a framework aiming to foster the cooperation of European countries with Japan in R&D. The main objective of RAPIDMAP is to construct a Decision Support System (DSS) based on remote sensing data and WebGIS technologies, where users can easily access real-time information assisting with disaster analysis. In this paper, we present a case study of the Tohoku Tsunami Disaster 2011. We address two approaches namely change detection based on SAR data and co-registration of optical and SAR satellite images. With respect to SAR data, our efforts are subdivided into three parts: (1) initial coarse change detection for entire area, (2) flood area detection, and (3) linear-feature change detection. The investigations are based on pre- and post-event TerraSAR-X images. In (1), two pre- and post-event TerraSAR-X images are accurately co-registered and radiometrically calibrated. Data are fused in a false-color image that provides a quick and rough overview of potential changes, which is useful for initial decision making and identifying areas worthwhile to be analysed further in more depth. However, a bunch of inevitable false alarms appear within the scene caused by speckle, temporal de-correlation, co-registration inaccuracy and so on. In (2), the post-event TerraSAR-X data are used to extract the flood area by using thresholding and morphological approaches. The validated result indicates that using SAR data combining with suitable morphological approaches is a quick and effective way to detect flood area. Except for usage of SAR data, the false-color image composed of optical images are also used to detect flood area for further exploration in this part. In (3), Curvelet filtering is applied in the difference image of pre- and post-event TerraSAR-X images not only to suppress false alarms of irregular-features, but also to enhance the change signals of linear-features (e.g. buildings) in settlements. Afterwards, thresholding is exploited to extract the linear-feature changes. In rapid mapping of disasters various sensors are often employed, including optical and SAR, since they provide complementary information. Such data needs to be analyzed in an integrated fashion and the results from each dataset should be integrated in a GIS with a common coordinate reference system. Thus, if no orthoimages can be generated, the images should be co-registered employing matching of common features. We present results of co-registration between optical (FORMOSAT-2) and TerraSAR-X images based on different matching methods, and also techniques for detecting and eliminating matching errors.
* Corresponding author.
1. INTRODUCTION
CONCERT-Japan (http://www.concertjapan.eu/) is an EU funded project in the International Cooperation Activities under the Capacities Programme of the EU FP7 for R&D. The major objective of this project is to foster the cooperation of European countries with Japan in science and technology with further expanding and harmonizing already existing cooperation between them. The core project consortium consists of 13 partners including organizations from European countries and Japan. RAPIDMAP is one of the five subprojects in the topic "Resilience against Disasters" under CONCERT-Japan. The central aim of "Resilience against Disasters" is to protect lives and property from damages by promoting new, effective and holistic approaches. RAPIDMAP started on June 1st, 2013, has duration of 2 years and involves 5 institutions shown in authors’ affiliations. More information can be seen on the RAPIDMAP website: http://rapidmap.fbk.eu/ (RAPIDMAP, 2013).
The paper presents the first results of RAPIDMAP aiming at change detection based on SAR data and co-registration of optical and SAR satellite images. For that purpose pre- and event TerraSAR-X (TSX) images and one optical post-event FORMOSAT-2 image are used. The Tohoku Tsunami Disaster 2011 occurred on March 11, 2011 is taken as case study. The study area (Figure 1), is situated around Sendai, Japan, where serious damage was caused by tsunami at that time. More information on the Tohoku Tsunami Disaster in 2011 can be read on the Center for Satellite Based Crisis Information (ZKI) report (ZKI, 2011).. Such kind of applications based on spaceborne radar data is advantageous in disaster analysis and management owing to regular repeat cycle and weather-independent imaging. The Sentinel-1 constellation mission, consisting of two radar satellites (Sentinel-1a and -1b), is planned to be operational in 2015. By that time, its shorter The International Archives of the Photogrammetry, Remote Sensing and Spatial Information Sciences, Volume XL-7, 2014
repeat cycle – six days – favors the disaster applications globally.
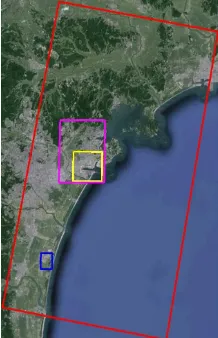
Figure 1. Study area (red square) in Sendai area, Japan. The vertical axis coincides with north-south direction. The red square indicates the border of TSX image acquired on March 12, 2011 (one day after the tsunami). The Sendai harbor (yellow square) is chosen as area for visual analysis based on a multi-temporal false-color image (Section 2.2). With respect to linear-feature change detection using Curvelet-based approach, the pink square indicates the computation area of complex (Section 4.3), and the blue square encircles the one in the second case of broken bridge detection (Section 4.4).
In case of disaster, rapid earth observation (EO) data acquisition usually is needed in order to provide useful information required for decision making. In the effort of (1) initial coarse change detection for entire area, generation of false-color image is chosen to demonstrate how simple and efficient a quick look can be in initial disaster analysis. The pre- and post-event TSX images are radiometrically calibrated followed by an accurate co-registration. Finally, the images are fed into red, green and blue bands to produce a false-color image. Discrepancies in corresponding scattering coefficients between these two calibrated TSX images cause color variations of different degrees. This approach provides a quick and rough overview of potential changes, which is useful for initial decision making and to identify areas worthwhile to be analyzed further in more depth. However, a bunch of inevitable false alarms appear across within the scene due to speckle, temporal de-correlation, co-registration inaccuracy and so on. This means, there is no information about the type of change occurred or which kind of object was affected (building, vegetation or water).
One of the important tsunami-specific tasks is to detect flooded area. In this study, thresholding and morphological approaches are exploited to detect such areas. Due to characteristics of SAR system such as the side-looking viewing geometry and the long wavelength, a mirror-like scattering takes place on flood area during acquisition of SAR data. Thus, such areas appear dark in amplitude SAR image. Therefore, flooded areas can be extracted from the post-event TSX image rather easily. The aim is not to detect small flood areas, but rather to provide an overview of flood situation.
We are also interested in detecting changes of linear features, which might indicate destroyed man-made objects like buildings or bridges. From the calibrated images a difference image is produced by subtracting the scattering coefficients in
the pre-event TSX image from the post-event ones. The difference value represents the change quantity reflected in scattering coefficient. Generally speaking, the changes on man-made structures usually lead to linear-feature-like patterns caused by destroyed buildings or broken bridges in the tsunami case. In contrast, the change patterns in other cases: non-urban disaster area or disaster-free area tends to be irregular or point-like. With these two distinct characteristics mentioned above, Curvelet filtering is applied in difference image not only to suppress false alarms of irregular-feature, but also to enhance the change signals of linear-feature. Although combining various filtering and/or morphological approaches can also achieve the similar result as Curvelet-based approach, this simple and efficient one-way approach of Curvelet filtering agrees with the core spirit of RAPIDMAP – "Rapid". More details are given in Chapter 4.
The goal of co-registration between optical and SAR images is to automatically find a number of corresponding points in order to achieve a better co-registration than the one provided, accurate by about 1-2 pixels. This procedure does not really need to be very accurate, but what is important is that it is done in short time to assist the rapid mapping of areas affected by natural disasters. The task of this part is to co-register a SAR and an optical image after the 2011 Tsunami, in the Tohoku area. The TSX image to be registered was taken on March 12, 2011 in spotlight mode, the geocoded image was sampled to a 5 m grid. The optical image was taken by FORMOSAT-2 satellite on March 29, 2011, it features a resolution of 2 m and is only coarsely geocoded. The co-registration method is described in Chapter 5.
All the results, except for the co-registration result, in this study are validated comparing with a thematic map – "TerraSAR-X Change Analysis of Sendai Area, Japan" (ZKI, 2011), which was produced by ZKI, German Aerospace Center (DLR) on March 14, 2011 - three days after the tsunami event. This thematic map is regarded as the reference data and will be directly called "thematic map" in the following context. Albeit the approaches presented aren’t virtually up-to-date, they are chosen and investigated considering simplicity, efficiency and rapidness. These promising approaches will be able to deliver results which will be integrated into the DSS of RAPIDMAP.
2. INITIAL COURSE CHANGE DETECTION FOR ENTIRE AREA
2.1 Pre- and Post-event TSX Images
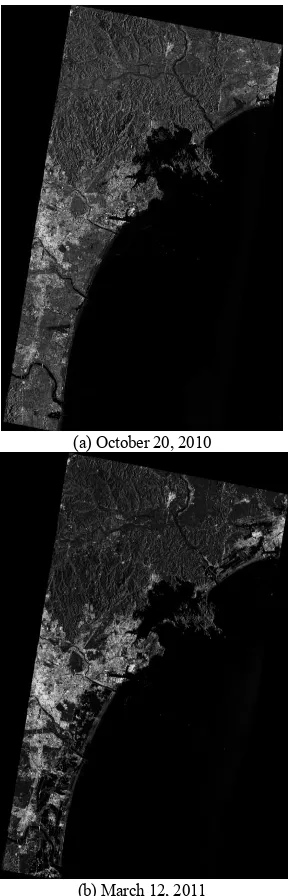
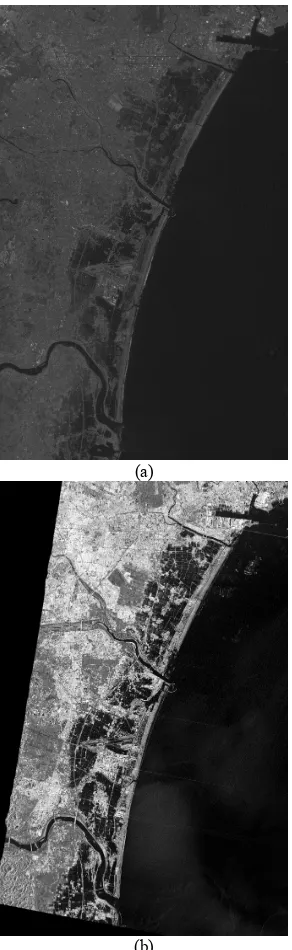
For the presented work, two pre- and post-event TSX images are used (Figure 2), acquired on October 20, 2010, and March 12, 2011, respectively. The corresponding system parameters are listed in Table 1. Of course, the time interval of both images of 143 days is not optimal with respect to temporal de-correlation. On the other hand, since both images were taken from the same orbit and beam, changes to due illumination geometry are avoided. The acquisition time of the post-event TSX image was just one day after the tsunami occurred, therefore we can assume that the destruction caused by the tsunami was captured completely.
As shown in Figures 2(a) and 2(b), the scattering coefficients in settlements are similarly higher than the other areas. However, the non-urban areas (farmlands and coast) appear darker in the post-event TSX image (2b). One reason for this could be the increased specular reflection of flooded surfaces near the shore, The International Archives of the Photogrammetry, Remote Sensing and Spatial Information Sciences, Volume XL-7, 2014
another reason are seasonal effects, for example, due to plant phenology. However, a deeper exploration of the mechanism causing this scenario is out of the scope of this paper.
(a) October 20, 2010
(b) March 12, 2011
Figure 2. Pre- and post-event TSX images acquired respectively on October 20, 2010 (a) and March 12, 2011 (b). The two TSX images have been accurately co-registered and radiometrically calibrated.
Orbit 42
Acquisition Mode Stripmap
Polarization HH
Orbit Direction Descending
Looking Direction Right
Average Incidence Angle
37
Table 1. System parameters for the pre- and post-event TSX images
2.2 False-Color Image
The first step in generating the false-color image is to accurately co-register the pre- and post-event TSX images, and then adopt a radiometric calibration. The relevant approaches used in this study can be referred to (Holecz et al., 1993) and (Holecz et al., 1994).
After co-registration and radiometric calibration, the pre-event TSX image is inserted into blue band, the post-event one is assigned to red and green bands, and thus a false-color image is produced. We produced such product for the entire area. However, in order to discuss details we focus on the harbour area as shown in Figure 3. The range of this computation area is shown within the yellow square in Figure 1.
(a) (b)
Figure 3. (a) A cut-out of the thematic map covering Sendai harbor. (Magenta: destroyed buildings or debris; Bright blue: structural damages across harbor; Dark blue: flood area) (b) The false-color image within the same range of (a). The representations of yellow, bright blue and dark blue in (b) are corresponding to the ones of Magenta, bright blue and dark blue in (a).
Figure 3 shows the comparison between the thematic map and the false-color image in Sendai harbor area. The meanings of the colors are depicted in Figure 3 as well. It is obvious that the representative change patterns of these colors are consistent.
In this study, no efforts are dedicated to unify the symbolic colors in the false-color image consistent with the ones in the thematic map by combining morphological approach, image processing and/or ground truth. The false-color image is generated by just simply inserting the pre- and post-event TSX images into red, green and blue bands without any further manipulation to achieve the aim of initial course change detection. In short, this simple and efficient approach to generate false-color image is concluded as promising and practical.
3. FLOOD AREA DETECTION
In flood disaster caused by such tsunami, flood area detection is very crucial to assist in disaster analysis. It is rather simple to detect flood area from SAR image. The reason is that such smooth water appears darker than surrounding area as a result of side-looking viewing geometry and long wavelength of SAR.
At first, global thresholding is applied in the post-event TSX image to extract the flood area. Although the mountainous areas appear quite dark too (cf. Figure 2(b)), they are still slightly brighter than flooded areas, which enables discrimination by a threshold. Here, the threshold was set manually. Afterwards, The International Archives of the Photogrammetry, Remote Sensing and Spatial Information Sciences, Volume XL-7, 2014
standard morphological operations like dilation and erosion operations are applied to obtain large connected flood areas.
Finally, the detected flood areas marked by blue are displayed in Figure 4(b), and the counterpart made in the thematic map is shown in Figure 4(a). According to comparison between Figures 4(a) and 4(b), the detected flood areas are consistent with the reference data in the thematic map. This result validates that using morphological approaches with SAR images is an effective way to detect flood area in a short time.
(a) (b)
Figure 4. (a) The flood areas along the coasts are marked by blue in the thematic map. (b) The detected flood areas (blue) by using morphological approaches in this study. Both red squares indicate the range of the study area as shown in Figure 1.
4. LINEAR-FEATURE CHANGE DETECTION 4.1 Curvelet Filtering
The Curvelet transformation decomposes a given function into a sum of so-called Curvelets, which refer to linear features of different scales, orientations, and positions. For many problems only a few coefficients are required to approximate a linear function sufficiently well. More details are found in (Candès and Donoho, 2004), (Candès et al., 2006) and (Starck et al., 2010).
In application of Curvelet transformation to image, the magnitude of Curvelet coefficient depends on the strength of a certain linear-feature in a specific scale, orientation and location. Among different scales, signal of real linear-features are retained in the Curvelet coefficients of courser scale too. In contrast, in case of noise and residual linear-feature components the energy is distributed over the remaining Curvelet coefficients of finest scale. The aim of Curvelet filtering used in this study is to downweight the Curvelet coefficients of finest scale. Thus, the contribution of irregular-features to the initial image is diminished. After Curvelet filtering, inverse Curvelet transformation is applied to retrieve the image retaining linear-features but suppressing irregular-linear-features.
4.2 Process
After accurate co-registration and radiometric calibration of the pre- and post-event TSX images, the difference image is produced by subtracting the scattering coefficients in the pre-event image from the ones in the post-pre-event image. The absolute difference value indicates the change degree within this pixel during the pre- and post-events. Afterwards, the range of the difference values is mapped into 0-255 to form a single-band grayscale image for visualization and for input to Curvelet
filtering. The stretch principle is to move the original grayscale value with the largest number of pixels (i.e., no change) to value 127. As a result changes appear saliently either brighter or darker than this value, which supports both visual inspection and subsequent image processing. Then Curvelet filtering is applied to the difference image to suppress irregular-feature changes but retain linear-feature changes. Finally, thresholding is used to extract only significant linear-feature changes from the Curvelet-filtered difference image. Those difference values above upper threshold and below the lower threshold are extracted as the linear-feature changes. Two cases with different purposes are addressed in the following sections.
4.3 Study Case of Complex Area
(a) (b)
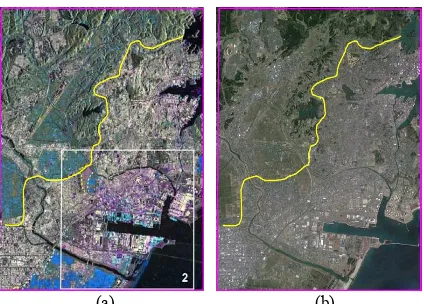
Figure 5. (a) The cut-out of the thematic map in the computation area in the study case of complex area. The meanings of the symbolic colors are described in the caption of Figure 3. The frame of this area can be seen within the pink square in Figure 1. The yellow line specifies the boundary between the flood-free (top-left part) and flood-influenced (down-right part) areas by the tsunami. (b) The counterpart of (a) with the Google Earth image overlaid for overview of ground situation.
(a) (b)
Figure 6. (a) The difference (stretched) image of the pre- and post-event TSX images. The specification of the yellow line is interpreted in the caption of Figure 5. The bright and dark areas indicate the changes caused by various reasons; otherwise, the common gray areas are interpreted as the unchanged areas. (b) The difference image resultant of Curvelet filtering on the one shown in (a).
A complex area near the Sendai harbor is selected to demonstrate the presented Curvelet-based approach to linear-feature change detection. Figure 5 shows the overviews of this complex area in the thematic map and in the Google Earth The International Archives of the Photogrammetry, Remote Sensing and Spatial Information Sciences, Volume XL-7, 2014
image. Most of the change areas are situated in the flood-influenced areas along the coasts, including destroyed buildings, structural damages in the Sendai harbor and flood cover. In contrast, it is obvious that fewer changes, caused by arbitrary factors, can be found in the flood-free area covering settlements, farmlands and mountainous areas. Such changes in the free area and the irregular-feature changes in the flood-influenced area are considered as false alarms. The aim is to exclusively extract the linear-feature changes such as man-made building and bridge without false alarms.
(a)
(b)
Figure 7. (a) The detected change areas (white), which are extracted by using thresholding from the difference image (Figure 6(a)) without Curvelet filtering. The specification of the yellow line is interpreted in the caption of Figure 5. (b) The detected change areas (white), which are extracted by the same way in (a) but from the difference image (Figure 6(b)) with Curvelet filtering.
Figure 6(a) indicates the stretched difference image where the nominal changes spread across the whole scene no matter where the flood-influenced or the flood-free areas is. Figure 6(b) shows the difference image after Curvelet filtering of Figure
6(a). The nominal changes in the flood-free areas are almost filtered out in Curvelet filtering. In the flood-influenced area, the irregular-features are suppressed and the linear-features (changes out of structures) are preserved. The comparison of Figures 6a and 6b shows that hardly any false alarms occur in the non-flooded area, whereas in particular the damaged harbor infrastructure was detected.
The same thresholding is used in both the difference images (shown in Figure 6) with and without Curvelet filtering to extract the changes. The resultant extracted changes, highlighted in white, are displayed in Figures 7(a) and 7(b), respectively. In the case without Curvelet filtering many false positives occur throughout the entire scene as shown in Figure 7(a). Since no filtering of any kind is applied all types of change or pseudo-change are highlighted: linear-feature changes of urban objects we are looking for as well as flooded areas or changes due to seasonal effects. In contrast, the linear-feature changes are exclusively extracted with Curvelet filtering as shown in Figure 7(b). The false alarms in the flood-free area are suppressed. In the flood-influenced area, the extracted linear-feature changes on the structures can be separated from the changes on the homogeneous areas flooded by the tsunami. Comparing Figures 5(a) with 7(b), the positions of the magenta areas (destroyed buildings or debris) in the former conform with the ones of the detected linear-feature changes in the latter. This agreement and the result analysed in this section prove the practical utility of Curvelet-based approach. More detailed analysis is given in the next section.
4.4 Study Case of Detecting Broken Bridge
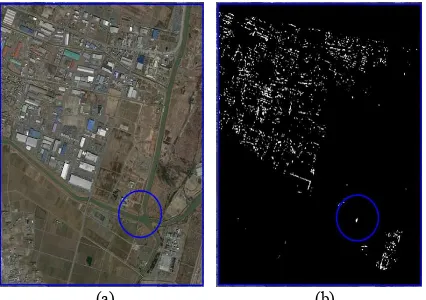
Important information for disaster management is to determine rapidly the state of infrastructure, for instance, whether or not roads and bridges are still in good order. In this section we consider this scenario for the example of a bridge. Ground truth is shown in the Google Earth image depicted in Figure 8(a). The built-up areas are concentrated in the top-left area surrounded by croplands and waterways. The bridge under study spanning a canal is highlighted by the blue circle.
(a) (b)
Figure 8. (a) The Google Earth image imposed within the computation area in the study case of detecting broken bridge. The range of this computation area is marked by a blue square in Figure 1. (b) The result of linear-feature change detection using Curvelet-based approach. The blue circle marks the broken bridge which is successfully detected in this study case.
According to the thematic map, this computation area near coast was flooded and totally destroyed during the tsunami. In Figure 8(b), the result of linear-feature change detection reveals The International Archives of the Photogrammetry, Remote Sensing and Spatial Information Sciences, Volume XL-7, 2014
that the destroyed in the built-up area are extracted, while changes due to flooding are filtered out. Moreover, a broken bridge is detected and shown within the blue circle, which gives a good example to demonstrate the characteristic of Curvelet filtering: suppressing noise and emphasizing linear-features.
5. EXPLORATION OF CO-REGISTRATION BETWEEN SAR AND OPTICAL IMAGES Figure 9 shows the optical image of 2m resolution taken from FORMOSAT-2 and the geocoded TSX image of 5m resolution, which shall be co-registered. The area captured in the images is fairly flat so no major differences in the displacements of points due to the relief are expected. The optical image is downsampled to match the resolution of the SAR image in co-registration processing.
(a)
(b)
Figure 9. (a) Optical image over the study area taken from FORMOSAT-2 on March 29, 2011. (b) SAR image over the study area taken on March 12, 2011 from TSX. Flooding from the tsunami can be seen in dark area.
Since a global transformation would be inefficient to be applied, the images are partitioned in patches whose matches are sought by relative shift. This approach belongs to the intensity-based methods, which compare intensity patterns.
In order to find corresponding points in the two images, we consider in this study the use of two matching methods. The first method uses a Mutual Information (MI) similarity measure, combined with a One-plus-one revolutionary optimization procedure. In literature (Inglada and Giros, 2004; Reinartz et. al., 2011) many have proposed the use of MI. The second method includes a novel approach using a discrete Fourier transform. This algorithm computes a 2D translation to co-register the images, by using cross-correlation in the frequency domain (Guizar-Sicairos et. al. 2008). This matching method is further called Fourier Transform Cross Correlation (FTCC).
For both methods a 301x301 window size was used and the center points of the windows were selected every 100 pixels. In this case this leads to a total number of 1998 points to be matched. In Figure 10 matching results are shown for both methods. These points relate also to locations in the image where matching will fail. Since the acquisition plan of the images is different there might be areas, where we have no overlapping. Also in the sea it is impossible to have correct matches, since there wouldn’t be any features to be found. Already from this it is obvious that not all of the resulting matches can be taken into consideration as correct.
(a) (b) (c) Figure 10. (a) The 301x301 patch with center image coordinates (4561,1361) before matching. Magenta and green represent the SAR and optical images respectively. (b) Patch matched by MI and computed translations: (-4.06, 10.4) (c) Patch matched by FTCC and computed translations: (-3.64, 10.77)
After the matching algorithms have finished, an elimination of the blunders must be performed. The methods do not work perfectly and our task is to filter out the wrong matches. On this procedure previous work has been carried out (Soukal and Baltsavias, 2012). To do so some quality criteria about every match point are determined.
Local parallaxes are taken into account. Based on each point’s shift along x and y, for each 7x7 neighborhood an average magnitude and orientation are computed. Vectors which do not differ a lot from the average are weighted more; and consequently vectors which diverge from the local average are weighted less.
To include further quality criteria the normalized cross-correlation (NCC) on the gradient domain is computed. This is done by sliding the two windows to be matched in both x and y directions. Then, the value of NCC at the point matched, the highest NCC score within the window and the distance of the highest NCC point (in x and y) away from the point matched are stored.
Another consideration in evaluating the points is the standard deviation of the intensity values within the patches. The assumption behind this is that windows which have pixel values that vary a lot contain more features that could be matched, compared to patches with very low standard deviation. For example a patch from the sea would have very little variance and thus would be meaningless to consider as a correct match.
In the case of filtering the matches produced with MI the value of MI of the registered patches is also considered as a quality criterion.
0 500 1000 1500 2000 2500 3000 3500 4000 0
40 pixels Shifts for MI unfiltered
0 500 1000 1500 2000 2500 3000 3500 4000 0
20 pixels Shifts for MI filtered
Figure 11. The shifts computed with MI before any filtering (left) and after the filtering was applied (right) with a threshold for the 40% of the best points.
0 500 1000 1500 2000 2500 3000 3500 4000 0
40 pixels Shifts for FTCC unfiltered
0 500 1000 1500 2000 2500 3000 3500 4000 0
20 pixels Shifts for FTCC filtered
Figure 12. The computed shifts from FTCC without any filtering (left) and after the filtering procedure (right) when keeping the 40% matches with the best score.
The implementation of the filtering procedure is done in the following way. For every match a high-dimensional vector containing all the quality criteria is built. This creates a space which becomes sparser as the dimensionality is growing. Now since the correct matches should have fairly similar quality values there should be an area in this space where there is a cluster of points which share similar values and thus the space is denser. By choosing a grid in matching, which causes overlapping between the windows we can ensure that the parameters should not change vastly while navigating within a neighborhood of the images. In this high dimensional space we compute for every point its Euclidian distance to every other point and we add up these distances. But before this step we
rescale each dimension, such that each parameter has an equal contribution to the final distance. By computing the standard deviation of the quality values all dimensions can be normalized, independent of their initial values, and finally cover the same extents of the axes. The points with the smallest sum of distances are proved to be better matches than the points with bigger distances. In the end, the user is then asked to place a threshold to filter out a specific percentage or ask for a specific number of best points.
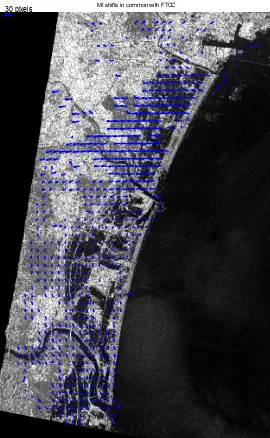
In this study, we noticed that around 40~45% of the matches are correct. In Figures 11 and 12 a threshold of 40% for the best points is applied. This results in a remaining 750 points for the MI filtering and 758 for the FTCC filtering (points with numerical problems were already discarded, before applying the threshold). To continue, we compare the remaining points from both methods to examine whether at the exact same point the match was kept or discarded. This leads to a total 609 common points which were kept after applying filtering on MI and FTCC. So this implies that out of both sets of points more than 80% are similar. In Figure 13 the shift vectors of the common points are overlaid on the SAR image.
MI shifts in common with FTCC
30 pixels
Figure 13. The remaining MI shifts (at 609 points) after comparing the filtered MI and FTCC results and keeping only the points, which were selected in both filtering procedures.
As a conclusion due to time limitation we avoided to perform a Left-Right check and also run the algorithms with different patch sizes, which could improve the performance of the filtering.
6. FLOODED AREA EXTRACTION USING A PAIR OF FORMOSAT-2 PANCHROMATIC IMAGES Since FORMOSAT-2 panchromatic band(0.45-0.90μm) covers not only visible but also near IR wavelength, water and flooded areas are likely to be dark in the panchromatic images. Figure 14(a) and 14(b) show panchromatic images around the mouth of Nanakita River taken on March 11 and 19, 2011. Nanakita River is located in the bottom of Figure 5. Figure 14(c) and 14(d) are binalized images of 14(a) and 14(b). By assigning Red and Blue to 14(c) and Green to 14(d), the color composite image shown in Figure 14(e) was produced. In Figure 14(e), the The International Archives of the Photogrammetry, Remote Sensing and Spatial Information Sciences, Volume XL-7, 2014
magenta colored areas are mainly corresponding to the land areas which were flooded after the tsunami. The green colored areas are mainly corresponding to the areas which became blighter after the tsunami. This kind of color composite images are quite useful for identifying the seriously damages areas.
(a) Pan image (March 11,2011) (b) Pan image(March 19,2011)
(c) Binalized image of (a) (d) Binalized image of (b)
(e) Color composite image (f) Flooded area
7. CONCLUSIONS
This paper shows the first results of RAPIDMAP, a project funded by European Union in a framework aiming to foster the cooperation of European countries with Japan in R&D.
The results with respect to SAR include (1) initial coarse change detection for entire area, (2) flood area detection, and (3) linear-feature change detection. All approaches presented in this study are demonstrated based on the pre- and post-event TSX images under the case study of the Tohoku Tsunami Disaster 2011. In (1), the false-color image is simple way to provide a quick overview of disaster area. The effort in (2) verifies that flood area is easy to be extracted from the post-event SAR image using thresholding and morphological approaches. The results in (3) demonstrate the Curvelet-based approach can be used to effectively extract linear-feature changes, for example, destroyed buildings or broken bridges. These verified approaches mentioned above are designed to be simple and useful.
The preliminary result of co-registration between optical (FORMOSAT-2) and SAR (TSX) images are addressed in this paper as well. The result reveals that such co-registration of two images from different sensor types is promising.
In future works, efforts will be undertaken to integrate data coming from more different sensor types. Thus more
complementary information can benefit from this kind of integrated approach. Finally, all the results achieved from the different approaches will be integrated in the DSS.
ACKNOWLEDGEMENTS
The authors gratefully acknowledge the financial support of Concert-Japan and the international contributions to RAPIDMAP from the experts in five organizations, as shown in the affiliations.
REFERENCES
Candès, E. and Donoho, D., 2004. New tight frames of Curvelets and optimal representations of objects with piecewise C2 singularities. Communication on Pure and Applied Mathematics., vol. LVII, pp. 219-266.
Candès, E., Demanet, L., Donoho, D. and Ying, L., 2006. Fast Discrete Curvelet Transforms. Multiscale Model. Simul., vol. 5, no. 3, pp. 861-899.
Guizar-Sicairos, M., Thurman, S. T. and Fienup, J. R., 2008. Efficient subpixel image registration algorithms. Optics letters, vol. 33, no. 2, pp. 156-158.
Holecz F., Meier, E., Piesbergen, J. and Nuesch D., 1993. Topographic effects on radar cross section. SAR Calibration Workshop, CEOS Calibration Sub-Group, Noordwijk.
Holecz F., Meier, E., Piesbergen, J., Wegmueller U. and Nuesch D., 1994. Radiometric calibration of airborne SAR imagery. IGARSS Symposium, Pasadena.
Inglada, J. and Giros, A., 2004. On the possibility of automatic multisensor image registration. Geoscience and Remote Sensing, IEEE Transactions on, vol. 42, no. 10, pp. 2104-2120.
Reinartz, P., Müller, R., Schwind, P., Suri, S. and Bamler, R., 2011. Orthorectification of VHR optical satellite data exploiting the geometric accuracy of TerraSAR-X data. ISPRS Journal of Photogrammetry and Remote Sensing, vol. 66, no. 1, pp. 124-132.
RAPIDMAP, 2013. RAPIDMAP website: RapidMap – Resilience Against Disaster With Remote Sensing and GIS, http://rapidmap.fbk.eu/.
Starck, J., Murtagh, F. and Fadili, J.M., 2010. Sparse Image and Signal Processing: Wavelets, Curvelets, Morphological Diversity. Cambridge University Press.
Soukal, P. and Baltsavias, E., 2012. Image matching error detection with focus on matching of SAR and optical images. Proc. of ACRS 2012, 26-30 Nov., Pattaya, Thailand, pp. 7.
ZKI, 2011. “Earthquake and Tsunami in Japan”, http://www.zki.dlr.de/article/1893.