www.elsevier.comrlocateratmos
Modeling of scavenging processes in clouds: some
remaining questions about the partitioning of gases
among gas and liquid phases
N. Chaumerliac
), M. Leriche, N. Audiffren
LAMPrOPGC, CNRS and UniÕersite Blaise Pascal, 24 A´ Õ. des Landais 63177 Aubiere Cedex France
Abstract
Clouds can play an important role by affecting the chemical composition of the troposphere through modification of photolysis rates, and by redistributing compounds through the vertical transport of species and their removal by wet deposition and finally by aqueous phase chemical reactions within cloud water or precipitation water. Several examples of the effects of clouds on tropospheric chemistry are shown, using a box model or a mesoscale model illustrating the role of clouds on hydrogen peroxide: its partitioning between the gas and aqueous phases, including deviations from Henry’s law. The main results are that deviations from Henry’s law exist even for small droplets, which are located on the edges of orographic clouds while equilibrium is attained in the center of the cloud. The partitioning of gases is a function of the cloud development
Ž .
conditions such as the air mass in which the cloud has been formed continental vs. maritime , the
Ž .
microphysical properties cloud water content, rainwater content .q2000 Elsevier Science B.V. All rights reserved.
Keywords: Aqueous phase chemistry; Henry’s law; Cloud chemistry modeling
1. Introduction
More than 50% of the Earth’s surface is covered by clouds and theoretical
calcula-Ž .
tions of Ravishankara 1997 have shown that clouds can alter the chemical composition of the atmosphere on a global scale. Clouds interact in many ways with chemicals on a wide range of scales, from micrometers up to thousands of kilometers.
)Corresponding author. Tel.:q33-4-73407372; fax:q33-4-73271657.
Ž .
E-mail address: [email protected] N. Chaumerliac .
0169-8095r00r$ - see front matterq2000 Elsevier Science B.V. All rights reserved. Ž .
Ž .
On a large scale thousands of kilometers , clouds are organized in broad and complex systems that are responsible for the transport of species from the boundary
Ž .
layer to the free troposphere Renard et al., 1994; Edy et al., 1996 . Tracer redistribution can be greatly changed in case of precipitating clouds systems due to their efficient scavenging. Photochemical processes can be modified through cloudrradiation
interac-Ž .
tions Thompson, 1984 . Within these systems, each individual cloud is the host of complex microphysical processes that influence the partitioning of species among the
Ž .
air, the cloud and the precipitation Gregoire et al., 1994 . Finally, on microscale level,
´
gas absorption and chemical reactions greatly depend on the microstructure of the cloud such as the droplet spectrum. Therefore, one has to consider complex interfacial transfer
Ž .
between gaseous and liquid phases Wurzler et al., 1995; Ricci et al., 1997 .
Moreover, these small scale features cannot be ignored at larger scales because removal processes and radiative properties of clouds that perturb photochemistry depend
Ž .
on the microphysical characteristics of the clouds Madronich, 1987 .
In order to simulate such complex interactions on the whole range of scales at which they are important, it is necessary to use several types of models from box chemical model, to mesoscale models.
In this paper, scavenging processes that occur in clouds and their dependency on the fine microphysical features, such as droplet size, liquid water content will be discussed for one particular chemical species, hydrogen peroxide, which is both a soluble and a reactive compound in clouds. The way clouds interact with this particular species will be described in details. In particular, deviations from Henry’s law can occur in clouds for this species at the sudden apparition of the aqueous phase or in a cloud, presenting
Ž .
different types of granulometry cloud droplets vs. raindrops .
2. Non equilibrium kinetics: mass-transfer of H O between gas and liquid phases2 2
The rate equation in gaseous phase for a particular species may be written as: dCg
sPgyL Cg g
Ž .
1d t
where P and Lg g are respectively the production and destruction terms and Cg the gaseous concentration of the species.
With the introduction of cloud water, this equation becomes:
dCg k Ct aq
sPgyL Cg gyLk Ct gq
Ž .
2d t HeffRT
where k describes the mass transfer between the gas and aqueous phases, L the liquidt
Ž .
Ž
where a is the droplet radius, d is the coefficient of diffusion in gaseous phase egal tog
2 y1.
0.1 cm s , v is the mean molecular speed and a is the accommodation coefficient. As soon as cloud water is present, additional rate equation for the aqueous concentra-tion Caq has to be accounted for:
dCaq k Ct aq
sPaqyL Caq aqqLk Ct gy
Ž .
4d t HeffRT
Ž .
In pure gas phase chemistry, the characteristic time scales lifetimes are expressed by the inverse of the term , and in gas-aqueous chemistry two different terms are involved:
The equilibration time is often taken as the characteristic lifetime of the species. In fact, the equilibration time teq is just proportional to this lifetime for pure gaseous chemistry, and it is given by:
Cg yCg eq
sD Cg g
Ž .
6teq
Ž .
where D is the inverse of the lifetime of the species chemical destruction rate andg
Cg the equilibrium concentration.
eq
With transfer to aqueous phase, this equation becomes:
CgeqyCg
sD Cg gqLk C 1t g
Ž
yq.
Ž .
7teq
Ž
where qsCaqrLHeffRTC expresses the deviation from Henry’s law equilibrium qg
.
equals 1 in Henry’s law equilibrium .
This ratio q is linked to the partitioning of material between gas and liquid phases. If
Ž . Ž .
q)1 or q-1 , this means that the species is preferably in the aqueous or gaseous phase. This ratio has been discussed by other authors but rather in experimental studies
ŽLaj et al., 1997; Ricci et al., 1997; Winiwarter et al., 1988, 1994 . Most of the time, it.
has been studied for very soluble species such as NH , HNO and HCOOH and its3 3
Ž .
evolution has been drawn versus either drop radius or pH. Laj et al. 1997 are the ones that complete the quantification of this partitioning process for H O , but the results2 2 have also been discussed only as a function of pH.
Here, we want to look at this ratio as a function of the variation of the liquid water content and consider various scenarios that include the limitation by mass transfer and
Ž .
the reactivity of the hydrogen peroxide with SO in particular .2
3. Deviations from Henry’s law for hydrogen peroxide during a cloud lifetime
The evolution of hydrogen peroxide has been followed during a cloud event by
Ž .
chemical mechanism, including aqueous phase chemistry based upon Gregoire et al.
´
Ž1994 . The chemical system is a standard gas phase mechanism including methane and.
CO in the presence of NO and sulfur dioxide. The pH is held constant, equal to 4.x
Tables 1–5 list the reactions, the initial concentrations of the species and values of accommodation coefficients used to calculate k coefficients. Since radiative propertiest of the cloud are unknown, we neglect the modification of the radiation field by the cloud. To produce hydrogen peroxide mean photolysis rate values are only considered during this cloud event but photolysis inside the droplets is taken into account as shown
Ž .
in Table 3. In Table 4 the levels of concentrations for hydrogen peroxide 2 ppb and
Ž .
SO2 1ppb are typical of a moderately polluted continental area. NO , Ox 3 and CO
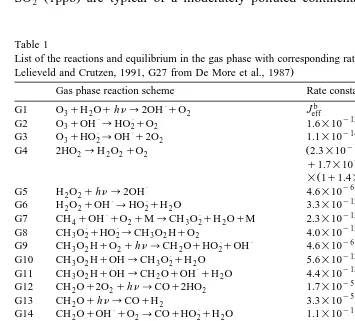
Table 1
Ž
List of the reactions and equilibrium in the gas phase with corresponding rate and equilibrium constants from
.
Lelieveld and Crutzen, 1991, G27 from De More et al., 1987
a
Gas phase reaction scheme Rate constants
P b
G18 NOqHO2™NO2qOH 3.7=10 exp 240rT
P P y12 Ž .
Reaction rate constants of first order reactions are in sy1, of 2nd order reactions in moleculey1cm3sy1.
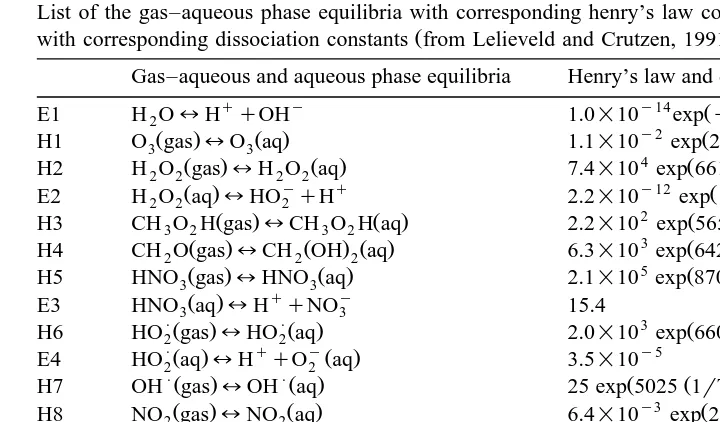
Table 2
List of the gas–aqueous phase equilibria with corresponding henry’s law constants and of aqueous equilibria
Ž .
with corresponding dissociation constants from Lelieveld and Crutzen, 1991
a
Gas–aqueous and aqueous phase equilibria Henry’s law and dissociation constants K298
q y y14 Ž Ž ..
E1 H O2 lH qOH 1.0=10 expy6716 1rTy1r298
y2
H5 HNO gas3 lHNO aq3 2.1=10 exp 8700 1rTy1r298
q y Ž .
E3 HNO aq3 lH qNO3 15.4
PŽ . PŽ . 3 Ž Ž ..
H6 HO gas2 lHO aq2 2.0=10 exp 6600 1rTy1r298
PŽ . q yŽ . y5
E4 HO aq2 lH qO2 aq 3.5=10
PŽ . PŽ . Ž Ž ..
H7 OH gaslOH aq 25 exp 5025 1rTy1r298
y3
H9 NO gaslNO aq 1.9=10 exp 1480 1rT 1r298
PŽ . PŽ . 3 Ž Ž ..
H10 CH O gas3 2 lCH O aq3 2 2.0=10 exp 6600 1rTy1r298
3
Ž . Ž . Ž Ž ..
H11 HCO H gas2 lHCO H aq2 3.7=10 exp 5700 1rTy1r298
q y y4
Ž . Ž Ž ..
E5 HCO H aq2 lH qHCO2 1.8=10 expy1510 1rTy1r298
P
Ž . Ž . Ž Ž ..
H12 SO gas2 lSO aq2 1.2 exp 3120 1rTy1r298
PŽ . q P y2 Ž Ž ..
E6 SO aq2 lH qHSO3 1.7=10 expy2090 1rTy1r298
P q 2y y8 Ž Ž ..
E7 HSO3lH qSO3 6=10 expy1120 1rTy1r298
a
Henry’s law constants in mol ly1
atmy1
and dissociation constants in mol ly1
at 298 K.
levels are rather representative of a remote area. These concentrations were chosen in order to fit the conditions at the Kleiner Feldberg in Germany, which is considered for the cloud observations and described below.
Table 3
Ž
List of the reactions in the aqueous phase with corresponding rate constants from Lelieveld and Crutzen,
.
1991
a
Aqueous phase reaction scheme Rate constants at 298 K
P Ž y1.
A12 SO3 qOH™SO42yqOH 5.5=10 expy1500 1rTy1r298
y 9 Ž Ž ..
A13 HSO3qOHqO2™SO3yqH O2 9.5=10 expy1500 1rTy1r298
y q 7 Ž Ž ..
A14 HSO3qH O2 2™SO42yqH OqH2 7.45=10 expy4725 1rTy1r298
a y1 y1Ž .
Table 4
Initial values of the chemical species
O3 H O2 2 SO2 CH O H CH O3 2 2 CO HNO3 HO2 OH NO2 NO CH O3 2 HCOOH 25 ppb 2 ppb 1 ppb 2 ppb 0.5 ppb 140 ppb 200 ppt 9 ppt 0.08 ppt 12 ppt 6 ppt 9 ppt 0.3 ppt
In order to simulate a cloud event, a variable liquid water content has been introduced
Ž .
in the chemical model. The liquid water content evolution Fig. 1 corresponds to observations at Kleiner Feldberg on October 31th 1990 for a stratocumulus cloud, during
Ž
the 1990s Cloud Experiment EUROTRAC Subproject Ground-based Cloud
Experi-.
ment, Fuzzi, 1994 . The time duration of the simulation is four hours. The cloud is essentially maintained during 1 h and then it dissipates. The maximum water content was 0.2 grkg.
In this simple cloud scenario, three sensitivity runs are performed. The first one only includes gas-phase chemical reactions and uptake of gases by the drops. The two others consider gas and aqueous phase chemistry and include or exclude sulfur dioxide chemistry. When SO2 is taken into account, higher reactivity is obtained in aqueous
Ž .
phase for H O . The sensitivity of the drop size 102 2 mm vs. 100mm is also examined in each case. Then, the uptake of the gases by the drops can be either described using instantaneous Henry’s law equilibrium or full kinetic mass transfer following Schwartz
Ž1986 . Fig. 2 shows the time evolution of hydrogen peroxide in every run..
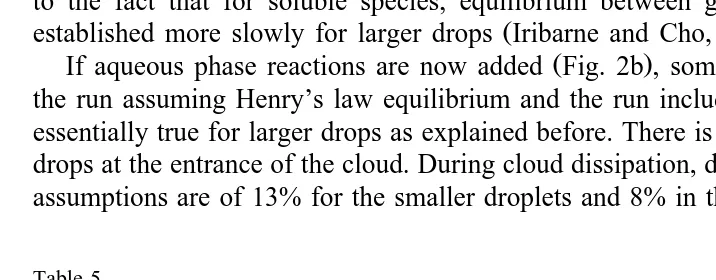
In Fig. 2a, the assumption of instantaneous Henry’s law equilibrium is valid for droplets of 10mm radius but gives slightly different result for larger drops. This is due to the fact that for soluble species, equilibrium between gas and aqueous phases is
Ž .
established more slowly for larger drops Iribarne and Cho, 1989; Huret et al., 1994 .
Ž .
If aqueous phase reactions are now added Fig. 2b , some deviations arise between the run assuming Henry’s law equilibrium and the run including mass transfer. This is essentially true for larger drops as explained before. There is 16% discrepancy for large drops at the entrance of the cloud. During cloud dissipation, differences between the two assumptions are of 13% for the smaller droplets and 8% in the case of larger ones.
Table 5
Values of the mass accommodation coefficients
Species Mass accommodation Reference
CH O2 0.05 Lelieveld and Crutzen 1991
Ž .
HNO3 0.125 Van Doren et al. 1990
Ž .
HO2 0.2 Lelieveld and Crutzen 1991
Ž .
OH 0.05 Lelieveld and Crutzen 1991
Ž .
NO2 6.3E-4 Lelieveld and Crutzen 1991
Ž .
NO 1E-4 Lelieveld and Crutzen 1991
Ž .
CH O3 2 0.05 Lelieveld and Crutzen 1991
Ž .
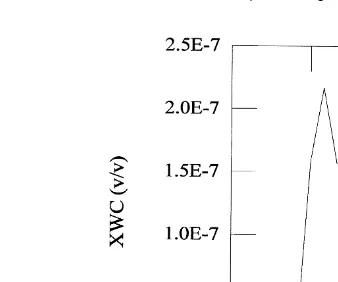
Ž . Ž
Fig. 1. Time evolution of the liquid water content in vrv during the Kleiner Feldberg Experiment Fuzzi,
.
1994 .
The more drastic discrepancies are observed if furthermore SO chemistry is added2
ŽFig. 2c . For hydrogen peroxide, by considering Henry’s law equilibrium, gas phase.
concentration is greatly overestimated whatever the drop size is. Especially, for low
Ž . Ž
water contents from 10 to 11 h , the two assumptions Henry’s law equilibrium and
.
mass transfer severely deviate for smaller drops. The second assumption leads to higher amount of gas uptake when entering the cloud because of higher speed of transfer. For bigger drops, the speed of transfer is diffusion limited and deviations from Henry’s law are less important. Hence, soluble and reactive species such as H O2 2 may not be considered in an instantaneous equilibrium between the gas and aqueous phases during the formation stage or the dissipation of clouds.
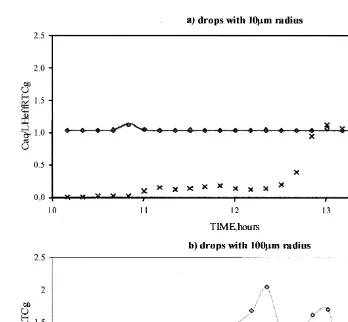
On Fig. 3, the factor q has been drawn for small and large drops in the three runs described previously: the first run considers only gas phase chemistry plus mass transfer, while the two others take into account both gas and aqueous phase chemistry and either exclude or include SO2 chemistry. The curves of Fig. 3 just reflect what we have already seen on Fig. 2 but will be helpful in the following section to compare the chemical behaviour of H O in a cloud simulated by a mesoscale model.2 2
In fact, this q factor represents the partitioning of the species among phases and is linked to the equilibration time of the species in the presence of clouds. Before the occurrence of the aqueous phase, q is equal to zero and the driving term of the equilibration is D .g
Ž .
At a sudden introduction of aqueous phase, the term Lk C 1t g yq with q close to
zero, becomes the driving term of the equation for most of the species. When Henry’s law equilibrium is established, the relaxation time will be driven by D again. Anyg deviation from Henry’s law can therefore significantly increases the equilibration time in each phase. For the aqueous phase, the equilibration time can be derived in the same manner:
CaqeqyCaq kt
sD Caq aqq Caq
Ž
1yq.
rqŽ .
8Fig. 3. Time evolution of the factor qsCaqrLHeffRTC , for the three sensitivity runs: gas phase chemistryg
Ž .
and mass transfer are considered ‘‘transfer’’ , gas phase chemistry, aqueous phase chemistry and mass
Ž .
transfer are considered ‘‘aqueous’’ and SO chemistry, gas phase chemistry, aqueous phase chemistry and2
Ž . Ž . Ž .
mass transfer are considered ‘‘SO ’’ and two drop sizes: a drops with 102 mm radius and b drops with 100
mm radius.
Assuming that the equilibration time is mainly due to chemical reactions, this leads to consider that the partition between the aqueous and gaseous phases always follows the
Ž .
Henry’s law instantaneous Henry’s law equilibrium . This assumption requires that for most species the fluxes at the interface are faster than gas or aqueous chemistry which means that the characteristic times of chemical reactions Dgy1 and Daqy1are, respectively,
Fig. 2. Time evolution of the hydrogen peroxide concentration in molecrcm3for various hypothesis, indicated
Ž
in the right-hand side legend Henry’s law equilibrium is assumed, then mass transfer is considered for small
. Ž .
and large drops, respectively and for the three sensitivity runs, which are described as follows: a gas phase
Ž .
chemistry and mass transfer are considered; b gas phase chemistry, aqueous phase chemistry and mass
Ž .
Ž .y1 Ž .y1
higher than Lkt and ktrHeffRT . This is observed for H O scavenged by small2 2 drops of 10mm radius when no SO chemistry is involved as can be seen on Fig. 3a.2 For big drops, the total content of H O in a single drop may become so important in2 2 phase equilibrium, that the resulting equilibration time seriously exceeds the chemical
.
equilibration times and the model timestep , even with fast exchanges at the interface of
Ž .
the drops Lk term . In such case, deviations from Henry’s law is observed with qt -1 at the onset of the cloud and q)1 during the dissipation stage of the cloud. Fast exchanges are also revealed through the high variations in the q factor.
Ž .
In the second run without SO2 the value of D of the hydrogen peroxide is smallg compared to Lk for both 10t mm and 100 mm cases, as Daq is small compared to
Ž . Ž Ž ..
ktrHeffRT. It is noteworthy that both DgasqLkt and Daqq ktrHeffRT decreases by a factor of 100 between the 10mm and 100mm cases, meaning that the equilibration time is much longer for big drops. When sulfur dioxide is added, Lk is still higher thant
D , while Dg aq becomes higher than ktrHeffRT by a factor of 2000 in the case of small Ž .
drops and only by a factor of 2 up to 8 in the big drop case. The driving time scale in
Ž .y1
the aqueous phase equilibrium is then ktrHeffRT . Hence, the method assuming instantaneous Henry’s law equilibrium is not applicable anymore, and the q factor is
Ž .
always less than 1 Fig. 3 .
4. Deviations from Henry’s law for hydrogen peroxide in a polydisperse cloud
Ž .
The same type of study Audiffren et al., 1996 has been performed in the framework of a mesoscale model simulating orographic clouds formed from different air masses
Žcontinental vs. maritime . This mesoscale meteorological model is coupled with the.
chemical module described in Section 3, except that the chemical equation system is
Ž
solved with a QSSA type solver more appropriate see Audiffren et al., 1998 for more
.
details . A complete description of the meteorological mountain wave scenario can be
Ž .
found in Chaumerliac et al. 1987, 1990 . The half width of the mountain is 25 km and its height is 1 km. The initial wind is horizontal and homogeneous with a velocity of 20 mrs. The initial atmosphere consists in a layer of constant lapse rate with 80% relative humidity up to 250 mb, which is topped by a dry isothermal layer. The mesoscale model
ŽNickerson et al., 1986 covers an horizontal domain of 300 km with a grid spacing of.
10 km. The timestep is 10 s and there are 16 vertical levels spaced in a terrain-following coordinate. The dynamical, microphysical and chemical processes are fully interactive in the model. The simulation lasts 3 h and is two-dimensional. The microphysical
Ž .
parameterization is based upon the work from Berry and Reinhardt 1974 .
Two runs are performed with different types of orographic clouds, originating from
Ž .
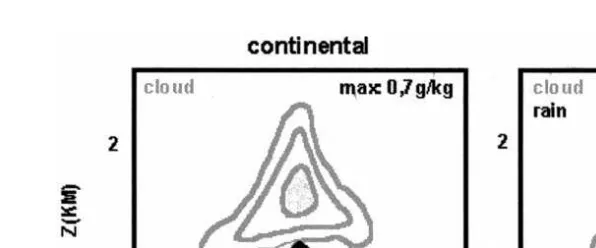
Fig. 4. Vertical cross-sections of the cloud water and rainwater mixing ratios for a continental non-participat-ing cloud and a maritime precipitatnon-participat-ing cloud.
dissolve both in cloud and rain phases and once included in the drops they can undergo transfer through microphysical processes. This last characteristic complicates the previ-ous situation, where only the time evolution of a cloud was considered, and make the cloud chemistry more realistic.
Ž .
Winiwarter et al. 1992 reported that sampling in a chemically homogeneous droplet population in a cloud system where the liquid water content varies with time leads to subsaturation of the aqueous phase for nondissociating species. Pandis and Seinfeld
Ž1991 gave additional explanations for the results of these samplings. Independent of.
sampling duration, the variation with time of the liquid water content is, in their case, the main reason for producing an apparent deviation from Henry’s law equilibrium due
Ž .
to the nonlinearity of the aqueous sampling samplings on discontinuous time intervals . Hence, measurements in polydisperse clouds can lead to deviations from Henry’s law for the bulk sampling which vary with the location in the cloud. In monodisperse clouds
Žcontinental cloud in our case for which all the droplets have the same size one may.
surmise that sampling in the middle of the cloud or on the edges would give the same results. This is what we seek to verify. As seen before, the ratio qsCaqrLHeffRTCg gives a measure of the deviation from Henry’s law. Caq can be either the cloud water
Ž .
concentration or the rainwater concentration mole per cubic centimeter air and L the corresponding liquid water content. This ratio has been plotted for both the soluble
Ž .
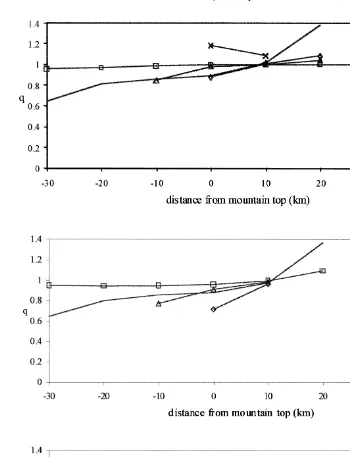
species H O2 2 Fig. 5 . Fig. 5a and b shows the evolution of this q factor along the mountain slope for the continental and maritime cloud, while Fig. 5c refers to the maritime rainwater. We clearly observe that the cloud droplets are always subsaturated upwind of the mountain top and supersaturated downwind where cloud evaporation occurs. Henry’s law equilibrium is attained in the middle of the cloud and not on cloud edges. This can be explained by the fact that surrounding air acts as an important gaseous source for hydrogen peroxide on cloud edges by entrainment. In the case of the maritime cloud also, deviations from Henry’s law occur in parts of the cloud where rain is present. Vertically, the cloud water content decreases not only because of evaporation, but mainly through conversion of cloud into rain. This can be related to an open system
Ž .
Fig. 5. Evolution as a function of the distance from the mountain top of the factor qsCaqrLHeffRTCg
Ž . Ž . Ž .
showing the deviations from Henry’s law in case of a a continental cloud, b a maritime cloud, and c the maritime rain field and for several heights.
increase in the q factor. In contrast, in maritime rainwater, drops on the upwind side are supersaturated in the upper part of the cloud. In all remaining parts of the precipitating
Ž
.
than 1 even equal to 0.2 near the ground . This net deviation from Henry’s law is likely due to the raindrop size, which increases drastically on that side of the mountain.
In conclusion, dealing with a mesoscale meteorological model simulating orographic cloud has highlighted some more features about chemical species scavenging, compared to what we already showed with a box model. In particular, the box model did not include effects of microphysical processes that link a small drop population to a large drop population in the maritime case. It seems that microphysical processes that transport H O2 2 from the cloud to the rain phase act in the mesoscale model as the reagent SO was acting in the box model, displacing the equilibrium below Henry’s law2
Ž .
value. Also for big drops like the ones in the maritime case , we observe a high variability of the q factor, related to fast exchanges compared with in the box model. Finally, precipitation efficiently removes H O , while in the box model, a decrease in2 2 the liquid water content allows a complete release of the chemical species into the gas phase.
5. Conclusion
In this study, several examples of liquid clouds have been simulated by two types of models: a process model and a mesoscale model, including the multiphase chemistry. Experimentally, it is still very difficult to isolate concentrations of chemical species in one particular phase. Moreover, most of the time, samplings of cloud chemistry are based on measurements from pluviometers or impactors that provide time-integrated results, or low-sensitivity airborne measurements. Within the models, it is possible to redistribute soluble and reactive gas species, such as hydrogen peroxide among the gas and liquid parts of a cloud and to follow each component during the whole cloud time evolution and spatial evolution.
We have shown that deviations from Henry’s law equilibrium depends on the drop size, but also on chemical reactivity in both gas and aqueous phases, and moreover on the phase of the cloud. So, for hydrogen peroxide in the presence of sulfur dioxide, the deviation is large even for small droplets. The partitioning of gases is a function of the cloud development conditions such as the air mass in which the cloud has been formed
Žcontinental vs. maritime and the microphysical properties cloud water, rainwater. Ž .
content . For an orographic cloud, there are marked differences between the upwind side, the downwind side or the top of the mountain.
In conclusion, several causes to deviations from Henry’s law have been examined and have been estimated through the ratio q, which is equal to 1 in case of equilibrium between phases is reached. If more measurements of this quantity were available in real clouds, this could be a way of parameterizing the multiphase chemistry in large-scale models.
Acknowledgements
Ž
The work reported in this paper was supported by the INSUrCNRS Institut National
.
Ž .
PNCA Programme National de Chimie Atmospherique . The first authors are very
´
grateful to ADEME and Electricite de France for their support. Computer resources were
´
Ž
provided by I.D.R.I.S. Institut du Developpement et Des Ressources en Informatique
´
.
Scientifique , project no. 187.
References
Audiffren, N., Chaumerliac, N., Renard, M., 1996. Effects of a polydisperse cloud on tropospheric chemistry. J. Geophys. Res. 101, 25949–25966.
Audiffren, N., Renard, M., Buisson, E., Chaumerliac, N., 1998. Deviations from the Henry’s law equilibrium during cloud events: a numerical approach of the mass transfer between phases and its specific numerical effects. Atmos. Res. 49, 139–161.
Berry, E.X., Reinhardt, R.L., 1974. An analysis of cloud drops growth by collection: II. Single initial distributions. J. Atmos. Sci. 31, 1825–1831.
Chaumerliac, N., Richard, E., Pinty, J.P., Nickerson, E.C., 1987. Sulfur scavenging in a mesoscale model with quasi-spectral microphysics: two-dimensional results for continental and maritime clouds. J. Geophys. Res. 92, 3114–3126.
Chaumerliac, N., Richard, E., Rosset, R., 1990. Acidity production in orographic clouds and rain in a mesoscale model with semi-spectral microphysics. Atmos. Environ. 24A, 1573–1584.
De More, W.B. et al., 1987. Chemical kinetics and photochemical data for use in stratospheric modeling, JPL Publ No. 94-26. Jet Propulsion Laboratory, Pasadena, CA.
Edy, J., Cautenet, S., Bremaud, Ph., 1996. Modeling ozone and carbon monoxide redistribution by shallow´
convection over the amazonian rain forest. J. Geophys. Res 101, 28671–28682.
Ž .
Fuzzi, S., 1994. In: Fuzzi Ed, S. Ed. , The Kleiner Feldberg Cloud Experiment 1990, Introduction,
Ž .
EUROTRAC Subproject, Ground-based Cloud Experiment GCE . Kluwer Academic Publishers. Gregoire, P.J., Chaumerliac, N., Nickerson, E.C., 1994. Impact of cloud dynamics on tropospheric chemistry:´
advances in modeling the interactions between microphysical and chemical processes. J. Atmos. Chem. 18, 247–266.
Huret, N., Chaumerliac, N., Isaka, H., Nickerson, E.C., 1994. Impact of different microphysical schemes on the dissolution of highly and less soluble non-reactive gases by cloud droplets and raindrops. J. Appl. Meteor. 33, 1096–1109.
Iribarne, J.V., Cho, H.R., 1989. Models of cloud chemistry. Tellus 41B, 2–23.
Laj, P., Fuzzi, S., Facchini, M.C., Lind, J.A., Orsi, G., Preiss, M., Maser, R., Jaeschke, W., Seyffer, E., Helas, G., Acker, K., Wieprecht, W., Moller, D., Arends, B.G., Mols, J.J., Colvile, R.N., Gallagher, M.W.,¨ ¨
Beswick, K.M., Hargreaves, K.J., Stroreton-West, R.L., Sutton, M.A., 1997. Cloud processing of soluble gases. Atmospheric Environment, 31–16, 2589–2598.
Lelieveld, J., Crutzen, P.J., 1991. The role of clouds in tropospheric photochemistry. J. Atmos. Chem. 12, 229–267.
Madronich, S., 1987. Photodissociation in the atmosphere: I. Actinic flux and the effects of ground reflections and clouds. J. Geophys. Res. 92, 9740–9752.
Madronich, S., Calvert, J.G., 1990. Permutation reactions of organic peroxy radicals in the troposphere. J. Geophys. Res. 95, 5697–5715.
Nickerson, E.C., Richard, E., Rosset, R., Smith, D.R., 1986. The numerical simulation of clouds, rain and airflow over the Vosges and Black Forest mountains: a meso-b model with parameterized microphysics. Mon. Weather Rev. 23, 477–487.
Pandis, S.N., Seinfeld, J.H., 1991. Should bulk cloudwater or fogwater samples obey Henry’s law? J. Geophys. Res. 96, 10,791–10,798.
Ponche, J.L., George, C., Mirabel, P., 1993. Mass transfer at the airrwater interface: Mass accommodation coefficient of SO2, HNO3, NO2 and NH3. Atmospheric Chemistry, 16, 1–21.
Renard, M., Chaumerliac, N., Cautenet, S., Audiffren, N., Nickerson, E.C., 1994. Tracer redistribution by clouds in West Africa. J. Geophys. Res. 99, 12873–12883.
Ricci, L., Fuzzi, S., Laj, P., Orsi, G., Berner, A., Wendisch, M., Arends, B., 1997. Gasrliquid equilibria in polluted fog. Contrib. Atmos. Phys. 31, 131–155.
Schwartz, S., 1986. Mass-transport considerations pertinent to aqueous phase reactions of gases in liquid water
Ž .
clouds. In: Jaeschke, W. Ed. , Chemistry of Multiphase Systems. Springer, pp. 415–471.
Thompson, A.M., 1984. The effect of clouds on photolysis rates and ozone formation in the unpolluted troposphere. J. Geophys. Res. 89, 1341–1349.
Utter, R.G., Burkholder, J.B., Howard, C.J., Ravishankara, A.R., 1992. Measurement of the mass accommoda-tion coefficient of ozone on aqueous surfaces. Journal of Physical Chemistry, 96, 4973–4979.
Winiwarter, W., Puxbaum, H., Fuzzi, S., Facchini, M.C., Orsi, G., Beltz, N., Enderle, K., Jaeschke, W., 1988. Organic acid gas and liquid measurements in Po valley fall-winter conditions in the presence of fog. Tellus 40B, 348–357.
Winiwarter, W., Fierlinger, H., Puxbaum, H., Facchini, M.C., Arends, B.G., Fuzzi, S., Schell, D., Kaminski, U., Pahl, S., Schneider, T., Berner, A., Solly, I., Kruisz, C., 1994. Henry’s law and the behavior of weak acids and bases in fog and cloud. Journal of Atmospheric Chemistry, 19, 173–188.
Winiwarter, W., Brantner, B., Puxbaum, H., 1992. Comment on ‘‘Should bulk cloud water or fogwater samples obey Henry’s law?’’ by S.N. Pandis and J.H. Seinfeld. J. Geophys. Res. 97, 6075–6078. Worsnop, D.R., Zahniser, M.S., Kolb, C.E., Gardner, J.A., Watson, L.R., Van Doren, J.M., Jayne, J.T.,
Davidovits, P., 1992. Temperature dependence of mass accommodation of SO2 and H2O2 on aqueous surface. Journal of Physical Chemistry, 93, 1159–1172.