Factors controlling evaporation and energy partitioning beneath a
deciduous forest over an annual cycle
Kell B. Wilson
a,∗, Paul J. Hanson
b, Dennis D. Baldocchi
caAtmospheric Turbulence and Diffusion Division, NOAA, P.O. Box 2456, Oak Ridge, TN 37831, USA bEnvironmental Sciences Division, Oak Ridge National Laboratory, P.O. Box 2008, Oak Ridge, TN 37831, USA
cDepartment of Environmental Science, Policy and Management, University of California,
Berkeley, 151 Hilgard Hall, Berkeley, CA 94720, USA
Received 20 October 1999; received in revised form 31 January 2000; accepted 3 February 2000
Abstract
The energy balance components were measured above the ground surface of a temperate deciduous forest over an annual cycle using the eddy covariance technique. Over a year, the net radiation at the forest floor was 21.5% of that above the canopy, but this proportion was not constant, primarily because of the distinct phenological stages separated by the emergence and senescence of leaves. The dominant response to seasonal changes in net radiation was through corresponding changes in the sensible heat flux, and both net radiation and sensible heat flux peaked just before leaf emergence. Evaporation at the forest floor was typically less than 0.5 mm per day, and unlike sensible heat flux, was not closely coupled to seasonal changes in net radiation. Instead, evaporation at the forest floor responded primarily to rapid changes in litter water content. Forest floor evaporation was limited by the water-holding capacity of litter, and when the atmospheric demand was large, the litter layer dried on the time scale of several hours. After this rapid period of drying, net radiation and sensible heat flux dominated the energy budget.
When leaves were present during the growing season, the sensible and latent energy fluxes at the forest floor were less than 10% of the total canopy fluxes, and the mean Bowen ratio was similar to that above the canopy. However, during the dormant season, the controls of the energy budget at the forest floor largely determine the whole canopy fluxes. On an annual basis, the fluxes from the forest floor are roughly 15–22% of those above the canopy and the evaporation was 86 mm. © 2000 Elsevier Science B.V. All rights reserved.
Keywords: Evaporation; Forest floor; Energy budget; Litter water content; Deciduous forest; Eddy-covariance; Ameriflux
1. Introduction
Energy fluxes and evapotranspiration above veg-etated surfaces depend not only on climatological and biophysical controls in the vegetative canopy but
∗Corresponding author. Tel.:+1-865-576-2317; fax:+1-865-576-1237.
E-mail addresses: [email protected] (K.B. Wilson), [email protected] (D.D. Baldocchi)
also on the available energy and energy partitioning beneath the canopy. Fluxes from a forest floor and the relative contribution of the forest floor to whole canopy fluxes vary considerably, from generally low in dense coniferous forests (Schaap and Bouten, 1997) and during the growing season in deciduous forests (Moore et al., 1996), to much greater in more open canopies (Lafleur, 1992; Kelliher et al., 1997, 1998; Baldocchi et al., 2000). The presence and den-sity of the canopy modify a number of factors that
influence energy availability and partitioning at the forest floor. These factors include solar and net radia-tion, soil water content, wind speed, temperature and humidity beneath the canopy, as well as the quantity and quality of decomposing litter, which can act as a mulching layer (Kondo and Saigusa, 1992) largely decoupling the surface litter layer from the soil. De-ciduous forests of the southeast US are unique in having a dense canopy during the growing season, but are essentially open during the dormant season. Therefore, characterizing the magnitude, partitioning and controls of energy fluxes and forest floor evap-oration in deciduous forests requires data sets that extend over a complete dormant and growing season cycle.
Although leaf area influences energy availability and partitioning at the forest floor, some evidence suggests that forest floor evaporation is often largely decoupled from net radiation (Baldocchi and Meyers, 1991; Schaap and Bouten, 1997), even during the dramatic changes associated with leaf emergence and senescence in a deciduous forest (Moore et al., 1996). Soil water content near the upper horizon (Kelliher et al., 1986) and leaf litter water content (Schaap and Bouten, 1997; Baldocchi et al., 2000) have also been suggested as controls on forest floor evaporation in other studies, but litter quantity and composi-tion can also be important, along with the presence of ground-dwelling and water-absorbing vegetation, such as moss and lichens (Lafleur, 1992; Kelliher et al., 1998). There is scarce information detailing the hourly to annual interaction between forest floor litter water content and evaporation in deciduous forests.
Baldocchi and Meyers (1991) and Baldocchi and Vogel (1996) have presented energy budget data under the canopy of a temperate deciduous forest using the eddy covariance technique, but only dur-ing short-term studies. Moore et al. (1996) presented forest floor fluxes in a deciduous forest in the north-eastern US over parts of an annual cycle. The forest in the present study is located in a much warmer cli-mate, has almost no snow cover, and has an extended growing season and a greater leaf area compared to that reported in Moore et al. (1996). We also expect soil type and litter quality and composition at the forest floor to vary between the two sites.
In this study, we discuss the energy budget beneath a temperate deciduous forest in the southeastern
US over an annual cycle using the eddy covariance technique. The daily and annual fluxes beneath the canopy will be compared with the whole canopy fluxes measured above the canopy. In addition to showing the annual magnitude of energy flux den-sities, we discuss the likely biophysical controls on forest floor evaporation at this site. Specifically, our goals are (1) to show the seasonality and magnitude of energy fluxes beneath a deciduous forest over an annual cycle, emphasizing differences between the dormant and growing seasons, (2) to determine rela-tive importance of forest floor fluxes with those above the canopy, and (3) to determine the role of climate forcing and litter water content on energy partitioning, particularly evaporation.
2. Materials and methods
2.1. General forest characteristics
Micrometeorological and flux measurements were made below and above the canopy of a temperate deciduous forest in Oak Ridge, TN (35◦57′30′′N, 84◦17′15′′W, 365 m asl) continuously during 1998.
2.2. Eddy covariance and meteorological data
The instruments designed to measure fluxes above the forest floor were placed on a 1 m horizon-tal boom supported by a 2 m tower. Above the canopy, measurements were made on a scaffold tower 10 m above the forest (Wilson and Baldocchi, 2000). Three-dimensional sonic anemometers (model SWS-211/3K, Applied Technology, Boulder, CO) were used to determine wind velocity and virtual tem-perature fluctuations at both measurement heights. Fluctuations in water vapor were measured with an open path, infrared absorption gas analyzer (Auble and Meyers, 1992). Water vapor calibrations were referenced to a dew point hygrometer.
Digitized anemometer and gas analyzer data were collected at 10 Hz and processed real time on a computer. Vertical flux densities were evaluated by computing the mean covariance of water and sensible heat fluctuations with the fluctuating vertical veloc-ity (Baldocchi et al., 1988). Fluctuations of velocveloc-ity and scalars from the mean were determined from the difference between the instantaneous values and the mean scalar quantities. Mean scalar values were de-termined using a digital recursive filter with a 400 s time constant. Fluxes at both heights were not sen-sitive to the value of the time constant in the range of 200–800 s, similar to other studies (Baldocchi and Meyers, 1991; Baldocchi et al., 2000). Coordinate axes were rotated so that the mean vertical velocity was 0 (McMillen, 1988). Water vapor fluxes were corrected for the effect of density fluctuations (Webb et al., 1980).
Environmental and meteorological variables were measured at 1 s intervals and logged on digital data loggers (model CR-21x, Campbell Scientific, Logan Utah). Soil heat flux density was measured with three soil heat plates (model HFT-3, Radiation Energy Bal-ance systems (REBS), Seattle, Washington) buried 0.01 m below the soil surface. Air temperature and relative humidity were measured at 2 and 36 m (height of above canopy system) with a temperature/humidity probe (HMP-35 A, Vaisala, Helsinki, Finland). Net radiation was measured above and below the canopy using a net radiometer (model 7, REBS, Seattle, Washington). The radiation sensor placed below the canopy was on a moving tram, which was used to obtain mean values over a horizontal transect of 20 m.
2.3. Litter and soil water content
Litter water content of the Oi/Oe horizons, the
organic layers that contains litter of recognizable origin, were measured continuously and hourly esti-mates were recorded on a datalogger (model CR-21x, Campbell Scientific). The approach estimates litter water content from the characteristic electrical con-ductance and is analogous to the electrical impedance grids reported by Gillespie and Kidd (1978), except the measurements were performed using actual leaves within the organic horizons. Eight replicate chestnut oak leaves (Quercus prinus L.), chosen because of their higher resistance to decomposition, were at-tached to a voltage supply and external resistors and subsequently reinserted between the Oi and Oe
hori-zons, where they remained for the duration of the growing season.
Throughout the growing season, additional chest-nut oak litter samples were collected under variable moisture conditions. From independent estimates of leaf water content, obtained by weighing leaves before and after drying, these leaves were used to develop a calibration curve between litter water content and leaf electrical conductance. The final relationship yielded a linear function between litter water content and electri-cal conductance. The coefficients for this relationship changed slightly over the course of the season as the leaves decomposed. The intercepts were−0.0015 and
−0.0011 g g−1for the first half and the second half of the year, respectively. The corresponding slopes were 4.05 and 3.09 g g−1mv−1. The coefficient of determi-nation (r2) during both periods was 0.87.
Litter water content data was subjectively separated into three categories: ‘wet’, ‘intermediate’ and ‘dry’. As the sensor was unable to effectively resolve differ-ences in water contents less than 0.3 g (H2O) g–1(leaf
After Day 90, soil water content over the 300 mm profile was measured hourly near the flux instrumen-tation site with four water content reflectometers (Item CS615, Campbell Scientific, Logan, UT) installed hor-izontally on the side of a subsequently backfilled soil pit. Before Day 90, soil water contents were measured periodically over the same depth with a time-domain reflectometer (Soil Moisture Equipment, Santa Bar-bara, CA). The measurements between the two types of instruments were comparable.
2.4. Data processing
Data were screened vigorously for both anomalous turbulent statistics and sensor malfunction, both of which introduced periods without reliable flux data. The portion of missing or rejected data was 14% on the tower and 16% on the forest floor system. To obtain daily and annual sums, it was necessary to fill in ing data. Hourly latent heat fluxes (LE) that were miss-ing or were of insufficient quality on the forest floor system were assessed from the product of equilibrium evaporation for the hour (LEeq=(Rnf−G)ε/(ε+1)) and
the mean Priestly–Taylor coefficient (α=E/Eeq). E is
the measured evaporation (kg m−2s−1); ε is sL/Cp,
where s is the slope of the saturation specific humid-ity versus temperature (K−1); L is the latent heat of vaporization (J kg−1); Cpis the specific heat capacity
(J kg−1K−1), Rnf is the net radiation (W m−2) at the
forest floor; and G is the soil heat transfer (W m−2). Values of α were obtained for the dormant and the growing season for each of three categories: ‘dry’, ‘in-termediate’ or ‘wet’ litter layers.
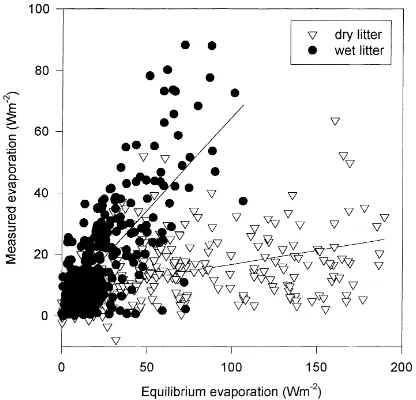
The relationship between LE and LEeqat the forest
floor during the dormant season is shown in Fig. 1 for periods of ‘wet’ and ‘dry’ leaf litter. Although this re-lationship is not particularly robust, the procedure does account for large differences between wet and dry leaf litter. Also, a majority of the missing data occurred at night or when precipitation or dew obscured the gas analyzer optics or sonic transducers, which are periods when energy fluxes were expected to be small. Miss-ing sensible heat fluxes (H) were assessed from the regression equation describing the energy balance (see Section 3.1). Flux data above the canopy was synthe-sized using similar procedures (Wilson and Baldocchi, 2000). Daily and annual sums of latent and sensible
Fig. 1. LE vs. equilibrium LE (LEeq, see text) during the dormant
season for ‘wet’ (d) or ‘dry’ (▽) litter wetness. Slopes of the
relationship (the parameterα) are 0.61 (wet, r2=0.52) and 0.09
(dry, r2=0.10).
heat flux were not highly sensitive to data acceptance criteria or methods of estimating missing hours.
Surface conductance of the forest floor (Gflr) was
computed by inverting the Penman–Monteith equation (Shuttleworth et al., 1984): tio of sensible to latent heat flux (H/LE). The aerody-namic conductance (Ga) was determined fromu′w′/U
(Monteith and Unsworth, 1990), where u′w′ and U
are the momentum flux and the mean wind speed at 2 m, respectively. Daily values of surface conductance were computed by weighting the surface conductance over the day by net radiation (Wilson and Baldocchi, 2000).
1986), from the total plant area index. The growing season was defined as the period when leaf area was at least 40% of the maximum, which we roughly es-timated as being between Days 115 and 305. The remainder of the year was classified as the dormant season.
3. Results
3.1. Energy balance closure and spectral analysis
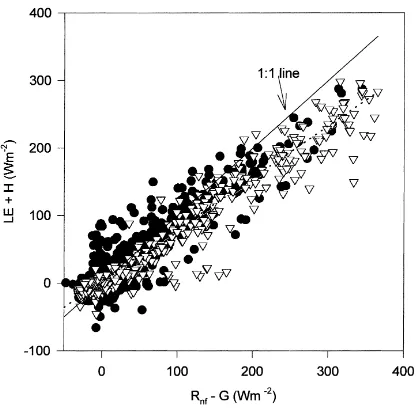
Two checks on the quality of eddy covariance data are energy balance closure (Baldocchi et al., 1988) and spectral analysis (Baldocchi and Meyers, 1991). The hourly energy balance at the forest floor (LE+H
versus Rnf−G) during the dormant season is shown in
Fig. 2. The slope is less than 1 (0.80), similar to the above-canopy fluxes (Wilson and Baldocchi, 2000). The intercept of 1.98 W m−2was not significantly dif-ferent from 0 and the coefficient of determination (r2) was 0.90. Although there were no statistical differ-ences between data during periods of ‘wet’ and ‘dry’ leaf litter (Fig. 2), energy balance closure at the forest
Fig. 2. Half-hourly sums of LE+H against available energy (Rnf−G) during the dormant period. Linear regression through all
data shown as a dashed line (slope=0.80; r2=0.90). Data is
ei-ther from periods of ‘wet’ or ‘intermediate’ litter wetness (d), or
‘dry’ litter (▽) wetness.
Fig. 3. Normalized turbulence cospectra for the vertical velocity and temperature covariance (d) and the vertical velocity and
humidity covariance (▽). The data is an average over a 20-day period during the daytime in March 1999.
floor during the growing season was noticeably worse (intercept=7.3, slope=0.66, r2=0.37) than during the dormant period.
3.2. Climate forcing
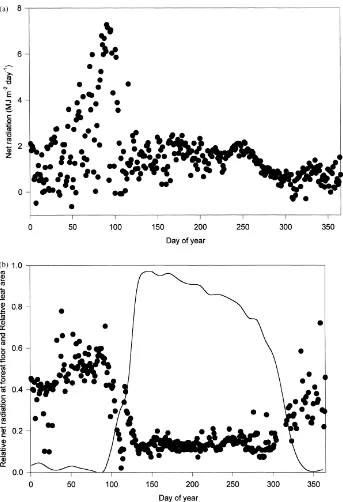
Climate and environmental forcing variables con-trol energy and energy partitioning at the forest floor. The daily and annual trends in leaf area and four im-portant forcing variables, net radiation, vapor pressure deficit (VPD), wind speed and water content (litter and soil) are shown in Figs. 4–7. Above the canopy, net radiation follows the increase in solar elevation angle as the year progresses, with daily variation primarily resulting from cloudiness (not shown). Above-canopy net radiation is important for determining net radia-tion below the canopy, but it is not the only impor-tant factor, as demonstrated by the non-consimpor-tant ratio of net radiation at the forest floor to that above the canopy (Fig. 4b). The presence or lack of leaves is also a major control on the absolute value of net radi-ation at the forest floor (Fig. 4a) and largely controls the fraction of above-canopy net radiation present at the forest floor (Fig. 4b). Total net radiation at the for-est floor during the dormant season (Days 1–115 and Days 305–365) was 44% of the value at the top of the canopy (Table 1), but was not constant and increased slightly with the solar zenith angle to about 60% in spring (just before Day 100, Fig. 4b). This peak oc-curs immediately before leaf emergence, and is fol-lowed by a rapid decrease as canopy leaves expand. During the growing season (Days 116–304), the to-tal net radiation at the forest floor was only 13.8% of that above the canopy (Table 2). Over the annual cy-cle, the total net radiation measured at the forest floor was 21.5% (602 MJ m−2) of that measured at the top of the canopy (Table 3). Approximately one-third of this radiation was received during a 40-day period just prior to leaf emergence (Fig. 4a).
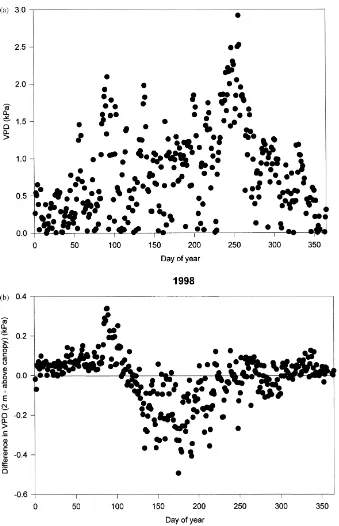
The coupling between above and below the canopy was much stronger for VPD than for net radiation, dur-ing both dormant and growdur-ing seasons (Fig. 5). There was a tendency for the VPD to be slightly greater at the forest floor just before leaf emergence and greater above the canopy during most of the growing season (Fig. 5b). In dramatic contrast to net radiation, VPD at the forest floor remained high during the entire grow-ing season (Fig. 5a).
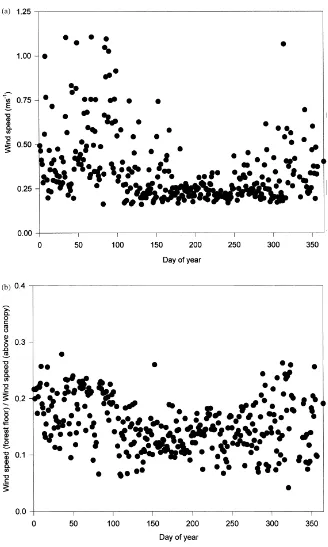
Mean daily wind speed at the forest floor was gen-erally greater and more variable during the dormant season than during the growing season, when it was often near or less than 0.25 ms−1(Fig. 6a). Wind speed
above the canopy was also typically greater during the dormant season (not shown). As a result, the ratio of below to above canopy wind speeds decreased only slightly during the growing season (Fig. 6b), and av-eraged about 0.15 over the year.
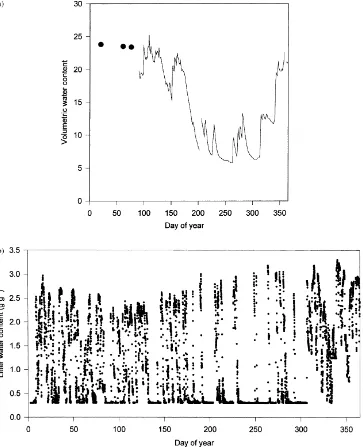
Soil water content in the top 300 mm is shown in Fig. 7a. Precipitation during the first half of 1998 was above normal, but a drought occurred through-out much of August through October, with the lowest soil water contents occurring during the growing sea-son between Days 240 and 265. Litter water content (Fig. 7b) varied at a much higher temporal resolution over the year than soil water content, often changing by nearly an order of magnitude over one to several days in response to rain events and rapid drying.
3.3. Overall seasonality of fluxes
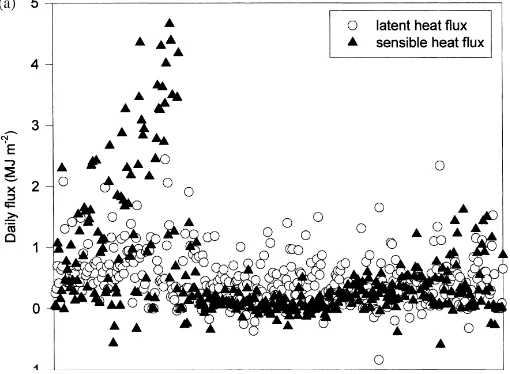
The daily energy flux densities at the forest floor over the 2 years are shown in Fig. 8. The most dra-matic seasonal pattern is the distinct peak in sensible heat flux just preceding leaf emergence and the sud-den decline following leaf emergence. This peak co-incides temporally with that of net radiation (Fig. 4). There was also seasonality in the soil heat flux, it be-ing generally negative durbe-ing the cold season and pos-itive during the warm season (Fig. 8b). Despite these clear seasonal patterns of net radiation and sensible and soil heat flux, there is much less seasonality in the latent heat flux (Fig. 8a). Evaporation from the for-est floor only rarely exceeded 0.5 mm (approximately 1.25 MJ m−2) on any day. The daily variability in all the fluxes was generally less during the growing sea-son, but especially so for net radiation, sensible heat flux and soil heat flux.
3.3.1. Dormant season fluxes
Fig. 4. (a) The daily net radiation 2 m above the forest floor. (b) Daily values of the ratio of net radiation at the forest floor to that the above the canopy (‘relative net radiation at the forest floor’, (d), and the relative leaf area (% of maximum, solid line). Maximum leaf
Fig. 7. (a) Volumetric soil water content in the upper 300 mm. Periodic data before Day 90 is shown by (d). (b) Litter wetness for each
hour. The sensor did not detect water contents below 0.30 g g−1.
10 but is close to 1 in late fall and early winter. The total soil heat flux is negative and about 11% of Rnf
in magnitude during the dormant season (Table 1).
3.3.2. Growing season energy fluxes
After leaf emergence in spring, sensible and latent heat fluxes at the forest floor were less than 10% of
Table 1
Sum of the dormant season (Days 1–115; Days 305–365) net radiation (Rn), sensible heat flux (H) and latent heat flux (LE)
above the canopy (Tower), at the forest floor (Floor) and the contribution from the ‘Vegetation’ (Tower–Floor) in 1998a
Tower Floor Vegetation Floor (%) Rn (MJ m−2) 720 315 405 43.8
H (MJ m−2) 419 193 226 46.1
LE (MJ m−2) 200 112 88 56.0
G (MJ m−2) −36 −36 NA NA
Bowen 2.10 1.72 2.57 NA
LE/Rn 0.32 0.61 0.20 NA
aThe relative percentages of total canopy flux originating from
the forest floor are also shown, along with the Bowen ratio and fraction of net radiation partitioned into latent heat flux (LE/Rn).
the growing season (Fig. 8a and compare Tables 1 and 2). During the dormant season, the soil heat flux is a source of energy (12% of net radiation) for the at-mosphere, while during the growing season, heat flux into the soil consumes 16% of the net radiation. As a result, the energy available for sensible and latent heat fluxes (Rnf−G) is less than Rnf during the
grow-ing season but greater than Rnf during the dormant
season, explaining part of the decreased sensible heat flux during the growing season.
There were also distinct differences in the parti-tioning between sensible and latent heat fluxes when comparing the growing and dormant seasons. Total evaporation over the growing season was only slightly less than that during the dormant season (Tables 1 and 2). As a result of the decrease in sensible heat flux but similar latent heat flux between seasons, the
Table 2
Sum of the growing season (Days 116–304) net radiation (Rn),
sensible heat flux (H) and latent heat flux (LE) above the canopy (Tower), at the forest floor (Floor) and the contribution from the ‘Vegetation’ (Tower–Floor) in 1998a
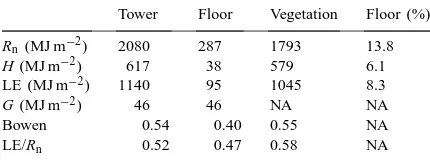
Tower Floor Vegetation Floor (%) Rn (MJ m−2) 2080 287 1793 13.8
H (MJ m−2) 617 38 579 6.1
LE (MJ m−2) 1140 95 1045 8.3
G (MJ m−2) 46 46 NA NA
Bowen 0.54 0.40 0.55 NA
LE/Rn 0.52 0.47 0.58 NA
aThe relative percentages of total canopy flux originating from
the forest floor are also shown, along with the Bowen ratio and the fraction of net radiation partitioned into latent heat flux (LE/Rn).
Table 3
Annual sum of net radiation (Rn), sensible heat flux (H) and latent
heat flux (LE) above the canopy (Tower), at the forest floor (Floor) and the contribution from the ‘Vegetation’ (Tower–Floor) in 1998a
Tower Floor Vegetation Floor (%) Rn (MJ m−2) 2802 602 2220 21.5
H (MJ m−2) 1033 233 800 22.6
LE (MJ m−2) 1340 207 1133 15.7
G (MJ m−2) 11 11 NA NA
Bowen 0.77 1.12 0.71 NA
LE/Rn 0.48 0.35 0.51 NA
aThe relative percentages of total canopy flux originating from
the forest floor are also shown, along with the Bowen ratio and the fraction of net radiation partitioned into latent heat flux (LE/Rn).
Bowen ratio was considerably less during the growing season than during the dormant season (0.40 versus 1.72; Tables 1 and 2).
3.3.3. Annual sums
Over the entire annual cycle, the sensible and latent heat fluxes are 22.6 and 17.0% of the total canopy fluxes, respectively (Table 3). Total evaporation from the forest floor during 1998 was 86 mm, but possibly up to 10% greater due to high frequency losses (see Section 3.1). The annual Bowen ratio at the forest floor is slightly in excess of unity (1.12) and moderately larger than for the vegetation (0.71, difference between canopy and forest floor) and the whole canopy (0.77, measured on tower) (Table 3).
3.4. Controls exerted by climate forcing and litter wetness
3.4.1. Dormant season
Fig. 8. (a) The mean daily latent (s) and sensible (m) heat fluxes above the forest floor in 1998. (b) The mean daily soil heat flux.
After grouping all data by hour of day, the mean diurnal patterns of fluxes were computed for wet (Fig. 10a), intermediate and dry (Fig. 10b) litter periods over the dormant season. Net radiation during all daylight hours was much lower when the litter was wet com-pared to dry (Fig. 10). The mean maximum Rnf was
230 W m−2when the litter was ‘dry’, but only about one-third that value when the litter was ‘wet’. This
suggests that the litter does not remain wet under high radiation loads.
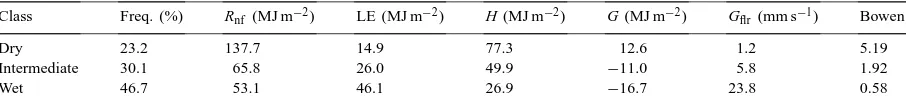
Table 4
The relative frequency (Freq.) of the litter water content categories during the dormant period of Days 1–115a
Class Freq. (%) Rnf (MJ m−2) LE (MJ m−2) H (MJ m−2) G (MJ m−2) Gflr (mm s−1) Bowen
Dry 23.2 137.7 14.9 77.3 12.6 1.2 5.19
Intermediate 30.1 65.8 26.0 49.9 −11.0 5.8 1.92
Wet 46.7 53.1 46.1 26.9 −16.7 23.8 0.58
aThe sums of net radiation (R
nf), latent heat flux (LE), sensible heat flux (H) and soil heat flux (G) are also shown over this period,
separated by litter water content (dry, intermediate or wet) classification. The mean daily surface conductance (Gflr) and the total Bowen
ratio are also shown.
Fig. 10b). Table 4 shows the total integrated fluxes during each of the three litter wetness categories dur-ing 115 days of the dormant season (Days 1–115). The Bowen ratio was 5.2 for all ‘dry’ hours (Table 4) and 6.1 during ‘dry’ daylight hours. During periods when leaf litter was wet, the partitioning of energy fluxes was dramatically altered (Fig. 10a). Latent heat flux usu-ally surpassed sensible heat flux, except around noon, and the Bowen ratio for all hours was 0.58 (Table 4), with a daytime value of 0.81. Despite the large re-duction in Rnf during periods of wet leaf litter, hourly
fluxes of latent heat flux exceeded those during dry litter periods by more than a factor of 2. The mean sur-face conductance to water vapor was also more than an order of magnitude greater when the litter was wet,
Fig. 9. The relative frequency of ‘wet’ (j), ‘intermediate’ (m)
and ‘dry’ (d) litter water content categories against the hour of
day during the dormant season in 1998.
23.8 mm s−1compared to 1.2 mm s−1(Table 4). Soil heat flux was near 0 during midday when the litter was wet, but was positive and slightly greater than latent heat flux when the litter was dry (Fig. 10).
Integrated Rnf during periods of wet leaf litter was
only about 20% of the total Rnf received during the
dormant period (Table 4). Despite this small energy input, the wet litter periods contributed 53% of the total latent heat flux. Conversely, dry litter periods contributed 54% of total Rnf but only 17% of total
latent heat flux (Table 4).
Fig. 11 illustrates the rapid temporal dynamics of litter wetness and forest floor fluxes over an 8-day pe-riod of litter wetting and drying during the dormant season. Around Day 88, a brief dry period had begun, litter water contents were less than 0.30 g g−1and the maximum net radiation at the forest floor was approxi-mately 350 W m−2. Over the next 2 days, net radiation fluctuated slightly because of cloudiness, but sensible heat exceeded latent heat flux by more than an order of magnitude, and the surface conductance was close to 0.20 mm s−1each day (Fig. 11b). The soil heat flux also exceeded latent heat flux (not shown). Total for-est floor evaporation over the entire 3-day period was only 0.5 mm.
In the late evening of Day 90 and into the early morning of Day 91, an above-canopy rainfall of 20.7 mm occurred, fully wetting the litter layer (Fig. 11b), which has a water holding capacity of just sev-eral millimeters. By sunrise on Day 91, the litter wet-ness was 2.15 g g−1. By early morning, skies cleared and the evaporation rate was an order of magnitude greater than during the previous mornings, exceed-ing 100 W m−2 (Fig. 11a). Latent heat flux was now greater than sensible heat flux, with a morning Bowen ratio of 0.89. However, by early afternoon, the litter wetness had already decreased to ‘dry’ (0.30 g g−1)
Fig. 10. (a) The mean hourly net radiation (j), latent heat flux (s), sensible heat flux (.) and soil heat flux (△) during the dormant
Fig. 11. (a) Net radiation (j), latent heat flux (s) and sensible heat flux (.) above the forest floor during an 8-day period before leaf
emergence in 1998. On the x-axis, the beginning hour of each day is marked. (b) Precipitation (bars) and litter water content (s) for each
hour over the same period as in (a). Litter water contents less than 0.30 g g−1 could not be detected and are shown as 0.30 g g−1. Also
substantially surpassing latent heat flux. The after-noon Bowen ratio increased to 2.3. Total forest floor evaporation during Day 91 was about 1.0 mm, an exceptionally high rate for this forest and one of the highest measured on any day, indicating there was some daily variability. The mean surface conductance (Eq. (1)) was 1.08 mm s−1, but it declined by nearly two orders of magnitude during the day from around 20 to 0.5 mm s−1 as the leaf litter dried. On the fol-lowing day (Day 92), the latent heat flux remained below 50 W m−2, the mean surface conductance was 0.44 mm s−1 and energy partitioning was dominated by sensible heat flux and net radiation. Early the following morning (Day 93), 20.9 mm of precipita-tion fell (Fig. 11b). Over the next 2 days, Rnf was
greatly diminished by cloudiness, leaf litter wetness remained above 0.75 g g−1, mean surface conduc-tance was greater than 8 mm s−1and latent heat flux exceeded sensible heat flux (Fig. 11a). Heat flux into the soil was also reduced during this cloudy period (not shown). By Day 95, the net radiation increased, litter wetness rapidly fell to 0.3 g g−1, the surface conductance approached 0.20 mm s−1 and the fluxes quickly resumed the familiar pattern observed during the earlier dry periods. Although litter water content and the partitioning of energy fluxes varied tremen-dously during this 8-day period, the relative variation in volumeteric soil water content was only 6% (from 18.6 to 19.8%) and there was essentially no change in soil water potential, indicating that soil water content was not the factor influencing surface fluxes.
3.4.2. Growing season
During the growing season, the leaf litter was more frequently dry because of the extended drought, but litter wetness was less important as a control of en-ergy fluxes than during the dormant season (Table 5).
Table 5
The relative frequency (Freq.) of the litter water content categories during the growing season (Days 116–305)a
Class Freq. (%) Rn (MJ m−2) LE (MJ m−2) H (MJ m−2) G (MJ m−2) Gflr(mm s−1) Bowen
Dry 45.1 178.2 46.7 25.5 30.4 0.87 0.55
Intermediate 28.9 50.8 23.3 7.8 4.5 4.2 0.33
Wet 26.1 57.9 25.0 4.7 11.0 16.4 0.19
aThe sums of net radiation (R
nf), latent heat flux (LE), sensible heat flux (H) and soil heat flux (G) are also shown over this period,
separated by litter water content (dry, intermediate or wet) classification. The mean daily surface conductance (Gflr) and the Bowen ratio
are also shown.
Hourly mean Rnf was lower when the litter was wet
(Fig. 12), but the difference in Rnf between wet and
dry litter conditions was much less than during the dormant period. Independent of the litter wetness cat-egory, the Bowen ratio over the growing season was less than 1 (Table 5). Sensible heat flux was essentially 0 during wet litter periods, even during midday (Fig. 12a). Although the Bowen ratio and the sensible heat flux were greater during dry litter periods, the mean midday flux did not exceed 10 W m−2and was only
12% of Rnf (Fig. 12b), yet during the dormant season,
it exceeded 135 W m−2 and nearly 60% of Rnf (Fig.
10b).
4. Discussion
4.1. Energy balance closure
Fig. 12. (a) The mean hourly net radiation (j), latent heat flux (s) and sensible heat flux (.) above the forest floor and the soil heat
available energy during the growing season compared to the dormant season has two primary causes. First, during the growing season, the heterogeneity at the forest floor increases as leaves emerge and gaps in solar radiation develop (Baldocchi et al., 1986). Dur-ing this period, the path of the net radiometer is less likely to be representative of the flux footprint. Sec-ondly, the magnitudes of the fluxes are constrained by lower maximums in net radiation, and relative errors in fluxes and net radiation are magnified.
4.2. Net radiation
The two most general characteristics describing net radiation at the floor of this forest are the moderately low relative values (21.5% of the above-canopy values on an annual basis), but with a distinct peak of signif-icant magnitude in late spring. The low annual mag-nitude occurs because the period of maximum solar radiation above the canopy generally coincides with the period of maximum leaf area and radiation attenu-ation within the canopy. The peak in total net radiattenu-ation at the forest floor in late spring is a result of three pro-cesses in this forest. First, total solar insulation above the canopy is increasing from winter values. Second, the low sun angles in the winter allowed boles to inter-cept a significant fraction of energy during the dormant period. With higher sun angles in spring, light trans-mission increases. Third, because of the deciduous na-ture of this forest, leaves have still not emerged even after spring equinox, but soon after leaf emergence, the transmission of solar radiation is quickly reduced. Although the forest floor of more open stands, with lower maximum leaf areas, generally receives larger fractions of the above-canopy net radiation (Black and Kelliher, 1989; Baldocchi and Vogel, 1997; Baldocchi et al., 2000), the annual magnitude and seasonality of the fraction received also depends on whether a forest is deciduous or evergreen and on the latitude and sea-sonal variation in solar angles. For example, because of changes in solar angle during the growing season alone, the relative fraction of above-canopy net radia-tion reaching the forest floor ranged from 10 to 30% in a boreal coniferous forest (Baldocchi and Vogel, 1997). Although the maximum leaf area at our site is three times larger than in the Jack pine stand (approx-imately 6 versus 2), the annual relative fraction of net radiation beneath the canopies may be similar at the
two sites because of the higher solar angles and the presence of a dormant season in our forest. The rela-tive fraction of net radiation at the forest floor will also be greater if computed for all hours (as in this study) than if computed only during the daytime, especially during the growing season when the canopy can de-couple the larger longwave losses above the canopy from those within it.
4.3. Sensible heat flux
The daily and seasonal changes in net radiation at the forest floor, whether resulting from leaf expan-sion and senescence, seasonal changes in insulation and solar angle, or daily changes in cloudiness, had the largest effect on the sensible heat flux. A simi-lar seasonality in sensible heat flux, with a marked spring maximum just before leaf emergence, has been observed at the floor of a deciduous forest in Mas-sachusetts (Moore et al., 1996). In the MasMas-sachusetts study, sensible heat flux at the forest floor was roughly 50% of the above-canopy values during the dormant season, with maximum values up to 70% at high so-lar angles in spring. These so-large relative fluxes were reduced to only 10% after leaf emergence. In our for-est, these relative contributions were similar, 46% dur-ing the dormant season, with maximum values around 65–70% in late spring, and decreasing to 6.1% during the growing season.
In boreal pine forests (Baldocchi and Vogel, 1997) and a Ponderosa pine forest in Oregon (Baldocchi et al., 2000), the sensible heat flux from the forest floor is generally a larger portion of total canopy flux and can be up to 70% (Kelliher et al., 1998), but the dis-tinct spring peak in sensible heat flux is not observed in these evergreen coniferous stands. As a result, although the sensible heat flux beneath a boreal Jack pine forest was 25–40% of the total over the warm season (Baldocchi and Vogel, 1997), the maximum relative contribution from beneath the canopy was never as large as in our forest just before leaf emer-gence (65–70% late in spring).
4.4. Latent heat flux
latent heat fluxes in this deciduous forest, but these analyses were limited only to the growing season. Here, we show that latent heat flux demonstrates much less seasonality than the other flux components over an entire year. As in our forest, the effect of leaf emer-gence and the resulting dramatic increase in net radi-ation had only minor effects on latent heat flux at the floor of the Massachusetts deciduous forest (Moore et al., 1996). On account of the seasonality in sensible but not latent heat flux at the forest floor, both decid-uous forests have a very distinct decrease in Bowen ratio between dormant and growing seasons. In our forest, it ranged from 1.72 during the dormant season to 0.47 during the growing season. Moore et al. (1996) report ‘midday’ subcanopy Bowen ratios greater than 3 during the leafless period, and the Bowen ratio ap-pears to be less during the growing season.
Although daily evaporation rates from the forest floor approached 1.0 mm on a few select days, 0.5 mm is a more general maximum of daily evaporation in this forest over the entire year. ‘Capping’ of forest floor evaporation at fairly low values has been observed in other types of forests, not only in dense coniferous stands (0.38 mm daily, Schaap and Bouten, 1997), but also in some more open stands (Baldocchi et al., 2000). However, much larger mean forest floor evaporation rates of 1.6 mm per day (Kelliher et al., 1990, 1998), 1.1 mm per day (Kelliher et al., 1997) and approxi-mately 1.7 mm per day (Lafleur, 1992) have been ob-served in the forests of Canada and Siberia. High rates at certain times of the year have also been observed in a Ponderosa pine forest in Oregon (Baldocchi et al., 2000). These higher evaporation rates may only par-tially be the result of more open stands, because even during the dormant season when net radiation is sub-stantial, in our forest, mean evaporation rates do not approach these magnitudes.
Evaporation from the forest floor was 56% (26 mm) of the total evapotranspiration measured above the canopy during the dormant season (47 mm). Dur-ing the dormant (leafless) season, transpiration is assumed to be 0. Therefore, the difference between evapotranspiration measured above the canopy and forest floor evaporation measured below the canopy should be the evaporation of water intercepted by tree boles and branches. This suggests that a relatively significant proportion (44%) of total dormant season evapotranspiration may be evaporation of intercepted
rainfall from the tree boles. Interception rates of this magnitude and greater during the dormant season are not inconsistent with previous measurements (Lux-moore and Huff, 1989). During the growing season, forest floor evaporation was only 8.3% (39 mm) of total evapotranspiration, and was nearly always less than 20% on any given day. A similar relative con-tribution (10–11%) during the growing season was observed in the deciduous forest in Massachusetts (Moore et al., 1996). Black and Kelliher (1989) noted that forest floor evaporation is frequently between 3 and 21% of total evapotranspiration, a conclusion also reached in some more recent studies (Kelliher et al., 1992; Schaap and Bouten, 1997). However, there are indications that this percentage can be significantly greater in some forests, ranging from 20 to 40% in Jack pine stands (Baldocchi and Vogel, 1996; Moore et al., 2000), from 30 to 50% in temperate pine forests (Kelliher et al., 1990; Baldocchi et al., 2000) to 50% and greater in some high-latitude forests (Lafleur, 1992; Kelliher et al., 1997, 1998).
4.5. Controls on forest floor evaporation
Two of the most distinguishing flux characteristics of this forest floor are the strong seasonality in sen-sible heat flux but much less seasonality and an ap-parent ‘capping’ of maximum daily evaporation rates. These characteristics result from three features that control energy partitioning at the floor of this forest: (1) its deciduous nature, promoting seasonality in net energy availability, (2) the characteristics of the leaf litter layer and (3) the apparent decoupling of evapo-transpiration from the available energy.
The seasonality of forest floor evaporation more closely follows the seasonal pattern of VPD at the forest floor than net radiation, further indicating that VPD is a stronger control of forest floor evaporation than net radiation. However, VPD is not the only, or even the major, driving force for forest floor evapora-tion. During some of the periods with highest VPDs (around Day 250), the surface evaporation is particu-larly depressed.
The rapid responses of litter water content and the relationships between litter water content, surface con-ductance and the energy fluxes indicate that available litter water content is probably the major factor con-trolling forest floor evaporation rates. In contrast, soil water content is frequently decoupled from both litter water content and the partitioning of energy.
Surface layer water content is also an important factor in determining forest floor evaporation rates at other sites. When the surface was wet, the Bowen ra-tio at the floor of a Ponderosa pine forest was 0.47, but it was 2.16 when it was dry (Baldocchi et al., 2000). In our forest, the Bowen ratios were 0.58 (wet) and 5.19 (dry) during the dormant season and 0.19 (wet) and 0.55 (dry) during the growing season. Large differences in the Bowen ratio of only slightly lesser magnitude than in our study were also observed for a Jack pine forest between wet and dry events (Bal-docchi et al., 2000). Schaap and Bouten (1997) also showed that litter water content strongly influences forest-floor surface conductance and evaporation in a Douglas Fir stand. Even at sites where the magnitude of forest floor evaporation was larger, the Bowen ratio increased from 0.6 to 5.6, and evaporation decreased by a factor of 3 after 9 days without rainfall (Kelliher et al., 1998).
Although wet leaf litter was associated with an or-der of magnitude reduction in the Bowen ratio com-pared to dry litter conditions, absolute differences in evaporation between wet and dry litter periods were less, because wet litter periods were associated with much lower net radiation and VPDs. A similar pat-tern was found in a Jack Pine stand (Baldocchi et al., 2000) and inferred in a Douglas Fir stand (Schaap and Bouten, 1997). The wetting and drying cycles in our forest show that periods of wet litter are not associ-ated with large energy loads and high VPDs, likely be-cause the upper surface of the litter layer dries rapidly (few hours) under these conditions. As a result, the
properties and the quantity of forest floor debris de-termine maximum evaporation rates and the length of time during which these rates can be maintained. The presence of large woody debris (dead branches) with low water holding capacity was responsible for reduc-tions in forest floor evaporation between two different pine stands (Kelliher et al., 1990).
The rapid changes in litter water content and par-titioning of energy fluxes at the forest floor indicate a low water holding capacity for the litter layer. In-dependent estimates of maximum litter water holding capacity are approximately 2.0 mm. There is also a likely decoupling of dry upper layers of litter from wetter layers below, and as a result, the lower litter lay-ers may participate less in the rapid evaporation rates following rainfall. In many forests where evaporation from the floor is greater and changes in surface con-ductance and energy fluxes are on the order of days instead of hours, litter capacity is greater (3–5 mm in Kelliher et al., 1998) and/or the forest floor contains lichens, moss, standing water (Lafleur, 1992; Kelliher et al., 1998), or other forms of short herbaceous veg-etation (Kelliher et al., 1990, 1997).
Acknowledgements
This work was funded by a grant from NASA/ GEWEX and the US Department of Energy (Ter-restrial Carbon Program) and is a contribution to the AmeriFlux and FLUXNET projects. PJH was sponsored by the Program for Ecosystem Research, Environmental Sciences Division, Office of Health and Environmental Research, US Department of Energy under contract No. DE-ACO5-84OR21400 with Lockheed Martin Energy Research Corporation. Mark Brewer and Mark Hall provided field and lab-oratory assistance. We thank Tilden Meyers and Stan Wullschleger for reviewing an earlier version of this manuscript.
References
net carbon and water exchange of European forests: the EUROFLUX methodology. Adv. Ecol. Res. 30, 113–175. Auble, D.L., Meyers, T.P., 1992. An open path, fast response
infrared absorption gas analyzer for H2O and CO2. Boundary
Layer Meteorol. 59, 243–256.
Baldocchi, D.D., 1997. Flux footprints under forest canopies. Boundary Layer Meteorol. 85, 273–292.
Baldocchi, D.D., Meyers, T.P., 1991. Trace gas exchange at the floor of a deciduous forest I. Evaporation and CO2 efflux. J.
Geophys. Res. 96, 7271–7285.
Baldocchi, D.D., Vogel, C.A., 1996. Energy and CO2flux densities
above and below a temperate broad-leaved forest and a boreal pine forest. Tree Physiol. 16, 5–16.
Baldocchi, D.D., Hicks, B.B., Meyers, T.P., 1988. Measuring biosphere–atmosphere exchanges of biologically related gases with micrometeorolgical methods. Ecology 69, 1331–1340. Baldocchi, D.D., Hutchinson, B., Matt, D., McMillen, R., 1986.
Seasonal variation in the statistics of photosynthetically active radiation penetration in an oak-hickory forest. Agricultural and Forest Meteorology 36, 343–361.
Baldocchi, D.D., Law, B.E., Anthoni, P.M., 2000. On measuring and modeling energy fluxes above the floor of a homogeneous and heterogeneous conifer forest. Agric. For. Meteorol., in press. Black, T.A., Kelliher, F.M., 1989. Processes controlling understory evapotranspiration. Philosophical Transactions of the Royal Society of London. B., 324, 207–231.
Gillespie, T.J., Kidd, G.E., 1978. Sensing duration of leaf moisture retention using electrical impedance grids. Can. J. Plant. Sci. 58, 179–187.
Goulden, M.L., Munger, J.W., Fan, S.-M., Daube, B.C., Wofsy, S.C., 1996. Measurements of carbon sequestration by long-term eddy covariance: methods and a critical evaluation of accuracy. Global Change Biol. 2, 169–182.
Greco, S., Baldocchi, D.D., 1996. Seasonal variations of CO2 and
water vapour exchange rates over a temperate deciduous forest. Global Change Biol. 2, 183–197.
Hutchison, B.A., Matt, D.R., McMillen, R.T., Gross, L.J., Tajchman, S.J., Norman, J.M., 1986. The architecture of a deciduous forest canopy in eastern Tennessee, USA. J. Ecol. 74, 635–646.
Jarvis, P.G., McNaughton, K.G., 1986. Stomatal control of transpiration: scaling up from leaf to region. Adv. Ecol. Res. 15, 1–49.
Johnson, D.W., van Hook, R.I. (Eds.), 1989. Analysis of Biogeochemical Cycling Processes in Walker Branch Watershed. Springer, New York.
Kelliher, F.M., Black, T.A., Price, D.T., 1986. Estimating the effects of understorey removal from a Douglas Fir using a two-layer canopy evapotranspiration model. Water Resources Res. 22, 1891–1899.
Kelliher, F.M., Whitehead, D., McAneney, K.J., Judd, M.J., 1990. Partitioning evapotranspiration into tree and understorey components in two young Pinus Radiata D. Don stands. Agric. For. Meteorol. 50, 211–227.
Kelliher, F.M., Kostner, B.M.M., Hollinger, D.Y., Byers, J.N., Hunt, J.E., McSeveny, T.M., Meserth, R., Weir, P.L., Schulze, E.-D., 1992. Evaporation, xylem sap flow, and tree transpiration in
a New Zealand broad-leaved forest. Agric. For. Meteorol. 62, 53–73.
Kelliher, F.M., Hollinger, D.Y., Schulze, E.-D., Vygodskaya, N.N., Beyers, J.N., Hunt, J.E., McSeveny, T.M., Milukova, I., Sogatchev, A., Varlargin, A., Ziegler, W., Arneth, A., Bauer, G., 1997. Evaporation for an eastern Siberian larch forest. Agric. For. Meteorol. 85, 135–147.
Kelliher, F.M., Lloyd, J., Arneth, A., Byers, J.N., McSeveny, T.M., Milukova, I., Grigoriev, S., Panfyorov, M., Sogatchev, A., Varlargin, A., Ziegler, W., Bauer, G., Schulze, E.-D., 1998. Evaporation from a central Siberian pine forest. J. Hydrol. 205, 279–296.
Kondo, J., Saigusa, S., 1992. A model and experimental study of evaporation from bare-soil surfaces. J. Appl. Meteorol. 31, 304–312.
Lafleur, P.M., 1992. Energy balance and evapotranspiration from a subarctic forest. Agric. For. Meteorol. 58, 163–175. Luxmoore, R.J., Huff, D.D., 1989. Water. In: Johnson, D.W.,
Van Hook, R.I. (Eds.), Analysis of Biogeochemical Cycling Processes in Walker Branch Watershed. Springer, New York, pp. 164–196.
Luxmoore, R.J., Grizzard, T., Patterson, M.R., 1981. Hydraulic properties of Fullerton cherty silt loam. Soil Sci. Soc. Am. J. 45, 692–698.
McMillen, R.T., 1988. An eddy correlation technique with extended applicability to non-simple terrain. Boundary Layer Meteorol. 43, 231–245.
Monteith, J.L., Unsworth, M.H., 1990. Principles of Environmental Physics. Edward Arnold, London.
Moore, K.E., Fitzjarrald, D.R., Sakai, R.K., Goulden, M.L., Munger, J.W., Wofsy, S.C., 1996. Season variation in radiative and turbulent exchange at a deciduous forest in central Massachussets. J. Appl. Meteorol. 35, 122–134.
Moore, K.E., Fitzjarrald, D.R., Sakai, R.K., Freedman, J.C., 2000. Growing season water balance at a boreal Jack Pine forest. Water Resources Res., in press.
Peters, L.N., Grigal, D.F., Curlin, J.W., Selvidge, W.J., 1970. Walker Branch watershed project: Chemical, physical and morphological properties of the soils of Walker Branch watershed. Ecological Sciences Division, ORNL-TM-2968, Oak Ridge National Laboratory, TN.
Schaap, M.G., Bouten, W., 1997. Forest floor evaporation in a dense Douglas fir stand. J. Hydrol. 193, 97–113.
Shuttleworth, W.J., Gash, J.H.C., Lloyd, C.R., Moore, C.J., Roberts, J., Filho, A.D.O.M., Fisch, G., Filho, V.D.P.S., Ribeiro, M.D.N.G., Molion, L.C.B., Sa, L.D.D.A., Nobre, J.C.A., Cabral, O.M.R., Patel, S., Moraes, J.C.D., 1984. Eddy correlation measurements of energy partition for Amazonian forest. Quarterly Journal of the Royal Meteorological Society, 110, 1143–1162.
Webb, E.K., Pearman, G.I., Leuning, R., 1980. Correction of flux measurements for density effects due to heat and water vapor transfer. Quarter. J. R. Meteorol. Soc. 106, 67–90.