GRAPH THEORY AND ANT COLONY OPTIMIZATION APPROACH FOR FOREST
PATCH CONNECTIVITY ANALYSIS
Shanthala Devi B.S.1, 2*, M.S.R. Murthy1, G.S Pujar1 and Bijan Debnath1 1
Forestry and Ecology Division, National Remote sensing Centre, ISRO, Dept of Space, Hyderabad 500625, INDIA. 2 Jawaharlal Nehru Technological University, Department of Spatial Information Technology, Kukatpally, Hyderabad: 500085
* [email protected] KEYWORDS: Forestry, Software, Vegetation, GIS and Networks
ABSTRACT
Forest connectivity is necessary for prioritizing biodiversity conservation. Connectivity indices facilitate to predict the movement pattern of species across complex landscapes. Change in area and inter-patch distance in forest affects the biodiversity, wildlife movement, seed dispersal and other ecological factors. In graph theory components play an important role to analyze the group of patches and its impact with reference to the threshold distance between the patches. The study on link, threshold distance and components showed that with the increase in threshold distance, number of components decreased and number of links increased. Also Integral index of connectivity importance value (dIIC > 0.05) is high for big forest patches and considered to be intact forest. For those less than 0.05 importance value requires protection and conservation. Hence dIIC is categorised into Very low, low, Medium, high and Very high to analyze the degree of connectivity. Choosing correct threshold distance based on the requirement of species movement is preferred. Based on the selection of potential habitat patches shortest path between them is determined using Ant Colony Optimization (ACO) Technique. Vegetation type Map, Slope, Elevation, Disturbance Index, Biological Richness Map and DIIC layers facilitated to analyze the optimal path of the species through ACO for connectivity. Graph Theory and ACO works as a robust tool for Biodiversity Conservation.
1. INTRODUCTION
Change in forest composition due seasonal variability and climate change affects the connectivity. Simple spatial metrics and software like Fragstats, connectance index, patch cohesion and buffer metrics are used for descriptive analysis, but has limitations with reference to decision making. In view of forest dynamics, Graph Theory (GT) and Ant Colony Optimization (ACO) are perceived to be better than currently existing techniques to decipher process related understanding. Such Geospatial tools coupled with Remote Sensing derived parameters can enhance scope of planning/decision making in different themes.
GT is used for selecting the suitable forest patch based on the various connectivity indices. The connectivity indices are categorized with reference to Binary and Probabilistic indices. Number of links, number of components, Harary Index (H), Class Coincidence Probability (CCP), Landscape coincidence probability (LCP) and Integral Index of connectivity (IIC) are analyzed from Binary Indices. Flux, Area Weighted Flux and Probability of connectivity (PC) values are obtained from the Probabilistic indices. In many papers with reference to Conefor Sensinode mainly focus on dispersal distances (Pascual-Hortal and Santiago Saura, 2006). Here an attempt is made to study the vegetation patch importance using this software and then analyze the outputs with reference to specific species (Santiago Saura and Lido´n Rubio, 2010). The IIC index achieves all the properties of an ideal index based on the given preferences and to the set of analyzed conditions. It is sensitive to all types of negative changes that can affect the habitat mosaic and effective detecting which of those changes are more critical for its conservation. IIC also has a defined and bounded range of variation (from 0 to 1), which is one of the desirable properties of landscape indices in general (Li and Wu 2004). The IIC index can be pertinent to any
landscape graph, either fully connected or not connected. It can also evaluate the importance for maintaining overall connectivity of any landscape element and combination of landscape elements in comparison with other connectivity indices. Hence more results on IIC are discussed in our study area. This robust tool will facilitate to identify the habitat patches for prioritization and connectivity.
patches for biodiversity conservation. ACO algorithm is derived and coded using .NET application of the GIS software ArcGIS 9.3.
2. MATERIALS AND METHODS
2.1 Study Area
The study was conducted in Andhra Pradesh, India. Figure 1 shows the study area with LISS III image and natural area inter-preted. The State of Andhra Pradesh is situated in the middle of eastern half of the Indian Peninsula lying between 120 37’ N-190 54’ N latitudes and 760 46 E – 840 45’ E longitudes. It is bounded by the Bay of Bengal in the east, Tamil Nadu in the south, Karna-taka in the west, and Maharashtra, Chhattisgarh and Odisha in the north. The forest in this study area shows representation of Semi-evergreen, Moist and Dry Deciduous forests in dominance with sparse distribution of Dry evergreen, Savannah, and Riverine for-est. High species diversity in Moist Deciduous forests followed by Dry Deciduous forests and relatively lesser in riverine is found. It is observed that certain pockets having species like Va-nilla wightiana, Atylosia cajanifolia etc., should be considered as important sites for conservation (NRSA, 2007). Connectivity be-tween forest patches with reference to species determines the path size.
Figure 1: Vegetation type Map for connectivity Analysis
2.2 Satellite Data Used
IRS P6: AWiFS and LISS-III satellite data is used for the analysis of different forest types. Field data information collected from phase II Biodiversity Project. For slope and elevation SRTM data is used.
2.3 Methodology
2.3.1 Graph Theory Approach: A graph is a set of nodes and links such that each link connects two nodes. Also it depends on the distance between the patches. Nodes represent patches of suitable habitat surrounded by inhospitable habitat. The existence of a link between each pair of patches implies the potential ability between two patches, which are considered, connected. A component (connected region) is a set of nodes for which a path
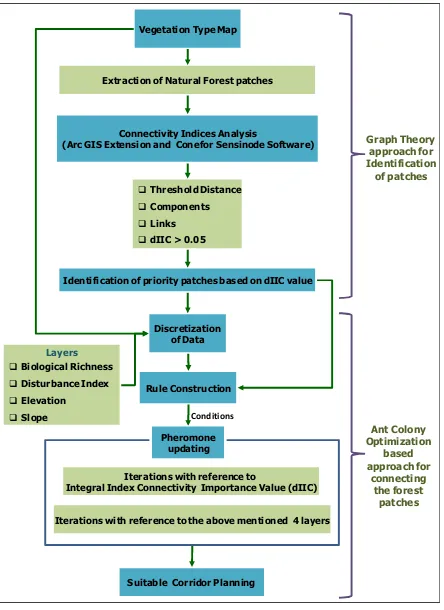
exists between every pair of nodes (an isolated patch makes up a component itself). Habitat patches area and the degree of connectivity between habitat patches can be integrated in a single habitat availability measure for an adequate decision making in conservation planning. Figure 2 shows the Flow chart for Graph Theory approach and ACO technique for forest patch connectivity.
Figure 2: Flow Chart for Graph Theory and Ant Colony Optimization Technique for forest patch connectivity
Vegetation type mapping in parts of Andhra Pradesh is performed using two seasons IRS P6 LISS-III satellite data by onscreen visual interpretation technique at 1:50000 scale. Semi Evergreen, Moist Deciduous and Dry Deciduous forests are major forest types considered for the analysis in addition to other forest classes namely forest plantation and forest scrub. Only forest patches are extracted from the Vegetation Type using Arc GIS. Using ArcGIS - extension nodes and distance is obtained. Graph Theory based Conefor Sensinode 2.2 software (Pascual-Hortal and Santiago Saura, 2006) is used on these forest patches for the analysis of connectivity indices. Detailed definition of connectivity indices are explained below.
NL: Number of Links NC: Number of Components
--- (1)
Where n = total number of nodes in the landscape, aiand ajare the attributes of nodes i and j,
nlij is the number of links in the shortest path
(topological distance) between patches i and j
Node Importance (dI)
--- (2)
I : Overall index value when all the initially existing nodes are present in the landscape
Iremove : Overall index value after the removal of that single node from the landscape
(e.g. after a certain habitat patch loss).
dIIC is node importance value with reference to Integral Index of connectivity.
Threshold distance
All pairs of nodes located higher than the threshold will be considered as unconnected and link will be assigned to those within threshold.
Conefor Sensinode 2.2 software is run to obtain all the connectivity indices initially for the entire state. Then forest patches of East Godavari district alone is chosen for further analysis. Conefor Sensinode 2.2 software is again run at different threshold distances 1km, 2km, 3km, 4km and 5km. At different threshold distances number of components and links are compared. Also dIIC range with reference to number of polygons is analyzed. Statistical evaluation of the important patches is calculated. Finally two priority patches are selected as source and destination for connectvity. This layer is used as one of the input in ACO algorithm for further analysis based on topographic factors too.
2.3.2 ACO Technique: ACO Algorithm is used for finding the shortest path between suitable habitat patches. It works on the principle of ant path consolidation based on pheromone deposits over time (more deposition means more probability of another ant to choose it). Algorithm is categorized into 4 steps (1) Discrete data preparation, (2) Rule construction, (3) Pheromone updating and (4) Suitable Corridor Planning. Inputs of ACO are GT identified habitat patches, Biological Richness Map (BR: Spatially modeled coarse pixel matrix of biodiversity), Disturbance Index (Intermediate product of BR indicating degree of disturbance in continuous forest pixels), slope and elevation (SRTM data). Rule construction involves conditional logic operation for all the input layers. Pheromone updating involves the iteration and selection of Rule based path analysis. Suitable Corridor Planning involves the path analysis between source to destination habitat patches of the same vegetation type with high dIIC value with favourable condition for the movement of species.
Figure 2a shows the ACO based flow chart for the shortest patch analysis along with graph theory approach. Discretiztion of data is performed on the inputs namely Vegetation Type Map, Biological Richness (BR) Map, Disturbance Index Map, Elevation and Slope. In Rule construction conditions are specified for the inputs. Medium to Very High BR values are important for the connectivity of patches. With low slope and elevation movement of species is easier. Always the connectivity between patches should be performed at undisturbed area and also should be far from road and settlement buffer points. In Disturbance Index all these criteria are met. High priority is given for Very High Biological Richness patches, Very Low disturbed patches, Medium to low slope and elevation conditions. Shortest path parameters based in the pheromone updating is obtained by iteration with reference to dIIC and values (weight based on the conditions) given to the above mentioned 4 layers. In pheromone updating, iterations are performed by running the software several times till the best result is obtained. Suitable Corridor Planning is made by giving the source and destination points between patches based on the iterated outputs. In ArcGIS Spatial Analyst tool is used to obtain the shortest path between patches. Multi path analysis is also performed to study the future effects. Then finally the best optimal path is chosen by analyzing statistically the percentage of area coming under the planned Suitable Corridor buffer.
3. RESULTS AND DISCUSSIONS
Contiguity is a paramount trait for a healthy landscape. To conserve all functionalities of landscape, it is essential to maintain connectivity between habitat patches. This alone ensures movement of species (migration/dispersal), hence ability to be resilient. Moist Deciduous and Dry deciduous forest is dominated in the entire study area. Results of Graph Theory approach gave 16 components for the entire study area. Inference for the whole study area shows that northern Andhra Pradesh due to its Moist deciduous patches requires more concentration for intactness, but as such it is very less fragmented. Concentration for biodiversity conservation is needed more in the central and southern AP. In the eastern side moist deciduous forest and Dry deciduous patches are moderately fragmented particularly in east Godavari District. Graph Theory Analysis for the entire study area facilitated to concentrate on specific components. For the further analysis and understanding of the connectivity analysis the procedure is repeated in single component along with group of close by components.
components decreases exponentially (Figure 4). R2 for Number of links and components is 0.98 and 0.90 respectively. Thus from this analysis it can be understood that based on the species specific movement threshold distance has to be chosen. With higher dIIC value we can assess the important patch to be further continued to maintain the patch configuration. For those patches with low dIIC value more concentration of biodiversity conservation has to be taken up.
Figure 3: Connectivity indices analysis output showing the node importance value (dI) with reference to link i.e., Graph is showing the importance (dI) of an existing node (node 7) for maintaining landscape connectivity in accordance with the number of links.
Figure 4: Impact of Threshold distance on the links and components
Skewness and kurtosis in the SPSS descriptive analysis helped to understand the dIIC index in the group of patches. This approach helped to study the concentration of dIIC values at different intervals. Since very less patches are getting higher than 1 dIIC value, all the remaining patches are in the range 0 to 1. Those patches having very big areas have high dIIC values. Polygons with greater than 0.05 dIIC values are important and need to be conserved so that it maintains the connectedness with the
surrounding patches. With reference to the scenario in different components is also analyzed. In figure 5 relation of dIIC with reference to number of patches is decreasing exponentially. From this it can be estimated that more number of patches are less than 0.05. More action to be taken there also because small patches if connected leads to reduction in the fragmentation.
54!4!"6
Figure 5: dIIC Range with reference to number of patches with reference to threshold distance 1km.
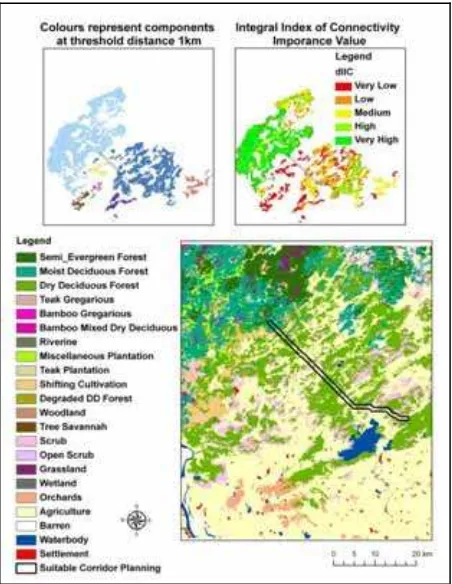
Figure 5: Shortest Path analysis using ACO and Table showing the percentage area of the vegetation type.
Then ACO is executed for path analysis. Thus it is observed that GT analysis followed by ACO approach is successful in analyzing the link between the forest patches for biodiversity conservation and also leading to the movement of species
I : Overall index value when all the initially existing nodes are present in the landscape
Iremove: Overall index value after the removal of that single node from the landscape
(wildlife and seed dispersal). Figure 6 shows the case study in East Godavari district connecting two forest patches with high dIIC value. It is also showing the different components and their respective dIIC range having very low, low, medium, high and very high values in the study area. Table shows that Dry deciduous forest is covering 44.72% and agriculture 36.45%. If agricultural area is acquired, forest area can be doubled. Also settlement is completely absent in the chosen corridor. Thus ACO is a robust technique to analyze the shortest path.
Vegetation Type Area (sq.km.) Area (%)
Semi Evergreen 0.03 0.06
Moist Deciduous 2.91 6.61
Dry Deciduous 19.67 44.72
Shifting Cultivation 0.50 1.13
Scrub 4.85 11.03
Agriculture 16.03 36.45
Total 43.97 100.00
From ACO point of view, all the ants start their tour from the first stand and follow the same sequence to the last stand, although they could equally well start from different stands and follow different sequences. In addition, the best ant is maintained in the next ant cycle so that the importance of the best ant is reinforced in the optimization. Dorigo et al. (1996) also used a similar elitist strategy to reinforce the importance of the best ant since it proved to be efficient to search for the optimal solution. The updated ACO algorithm is to a certain extent different from the original ACO algorithm. Selection of criteria for connectivity of forest patches is different from which ACO was originally designed. This Little modification has resulted in effective outputs.
4. CONCLUSION
Graph Theory approach facilitated to choose the best patches for the connectivity. High, Medium and low dIIC provided important clue to improve the biodiversity in those patches. High dIIC habi-tat patches should be protected and prevented from anthropogenic invasion. Medium dIIC habitat patches should be improved and maintained by consistent monitoring extensively from external disturbance. Low dIIC habitat patche area should be tried to ex-pand by governmental decision so that it’s area can be increased leading to connect with other patches. dIIC value greater than 0.05 is considered to be most important for landscape connectivi-ty from biodiversiconnectivi-ty conservation point of view to maintain the same condition and improve the surrounding area too. Only limi-tation of Conefor Sensinode software is that the processing is very slow. Especially obtaining the nodes and distance from ArcGIS extension takes many hours. If the nodes are within 10,000 processing is fast and gradually slow down when nodes exceeds over 10,000. Therefore first of all choosing the necessary patches for the analysis will serve the output quickly and results will be efficient. However, the management approaches of forest stands do not form a continuous network. At least in the begin-ning stepping stone corridor will facilitate a good approach. Later on contiguous patches could be made by officially acquiring the area required for corridor building. This technique helps the forest officers to take up action plans for the conservation and to protect
forest. This can be accomplished by improving the forest region by planting the region specific species which grows faster and lasts longer. Dispersal of seeds and spreading throughout the area enables the movement of species. Also movements of animals are possible. In forest plantation areas also, serious monitoring is re-quired so that this region facilitates the movement of species. Graph Theory approach coupled with ACO enhanced the extent of decision making in analyzing the movement of species through corridor planning and is successful in analyzing the link between the forest patches for biodiversity conservation.
REFERENCES
Bonabeau, E., Dorigo, M. & Theraulaz, G. 2000. Inspiration for optimization from social insect behaviour. Nature 406, pp. 39–42. Colorni, A., Dorigo, M. & Maniezzo, V. 1991. Distribution opti-mization by ant colonies. In: Varela, F. & Bourgine, P. (eds.). Proc. Conf. Artificial Life. Paris, France. Elsevier. pp. 134–142. Dorigo, M., Maiezzo, V. & Colorni, A. 1996. Ant system: opti-mization by a colony of cooperating agents. IEEE Transactions on Systems, Man, and Cybernetics B:Cybernetics 26 (1), pp. 29– 41.
Jaeger, J.A.G., 2000. Landscape division, splitting index, and ef-fective mesh size: new measures of landscape fragmentation.
Landscape Ecology, 15 (2), pp 115–130.
Li H.B. and Wu J.G. 2004. Use and misuse of landscape indic-es.Landscape. Ecology. 19, pp 389–399.
Lucı´a Pascual-Hortal and Santiago Saura, 2006. Comparison and development of new graph-based landscape connectivity indices: towards the priorization of habitat patches and corridors for con-servation. Landscape Ecology, 21, pp. 959–967.
NRSA, 2007. National Remote Sensing Agency, 2007. Biodiver-sity characterization at Landscape level in Eastern Ghats and East Coast using Satellite Remote Sensing and Geographic Informa-tion System. Department of Space, Government of India. Marco Dorigo and Christian Blum 2005. Ant colony optimization theory: A survey. Theoretical Computer Science, 344, pp. 243– 278.
Pascual-Hortal, L. and Saura, S. 2006. Comparison and develop-ment of new graph-based landscape connectivity indices: towards the priorization of habitat patches and corridors for conservation. Landscape Ecology 21 (7), pp. 959-967.
Santiago Saura and Lido´n Rubio, 2010. A common currency for the different ways in which patches and links can contribute to habitat availability and connectivity in the landscape. Ecography, 33, pp 523-537.
Saura, S. and Torne´, J. 2009. Conefor Sensinode 2.2: a software package for quantifying the importance of habitat patches for landscape connectivity. _ Environ. Model. Software, 24, pp. 135-139.
wind damage in forest planning. Silva Fennica. 41(2), pp. 315-332
ACKNOWLEDGEMENTS
The work in this paper is supported by research grant from “DOS-DBT Project: Biodiversity Characterisation at landscape level using Satellite Remote Sensing and GIS”. We sincerely
thank Director NRSC, Director IIRS, Deputy Director and Group Head, NRSC for offering opportunity to work on this innovative idea through this project. Thanks are due to all the Scientists and Research scholars of DOS-DBT Project Phase II and III for valuable field data information, Maps, technical contributions and suggestions.