NATIONAL LEVEL ASSESSMENT OF MANGROVE FOREST COVER IN PAKISTAN
S. Abbas a, F. M. Qamer b, N. Hussain c, R. Saleem a , K.T. Nitin d a
GIS Laboratory, World Wide Fund for Nature Pakistan, Ferozpur Road, Lahore, Pakistan (sabbas, [email protected] ) b MENRIS Division, International Centre for Integrated Mountain Development (ICIMOD), Kathmandu, Nepal -
Helmholtz Centre for Environmental Research UFZ, Leipzig 04318, Germany - [email protected]) d
Remote Sensing and GIS Field of Study, Asian Institute of Technology, Thailand – [email protected] *Corresponding author: Sawaid Abbas, [email protected]
KEY WORDS: Mangroves, Pakistan, Indus Delta, ALOS –AVNIR-2, Object Based Image Analysis (OBIA), Image Segmentation, Definiens Developer, Hierarchical Classification.
ABSTRACT:
Mangroves ecosystems consist of inter tidal flora and fauna found in the tropical and subtropical regions of the world. Mangroves forest is a collection of halophytic trees, shrubs, and other plants receiving inputs from regular tidal flushing and from freshwater streams and rivers. A global reduction of 25 % mangroves’ area has been observed since 1980 and it is categorized as one of to the most threatened and vulnerable ecosystems of the world.
Forest resources in Pakistan are being deteriorating both quantitatively and qualitatively due to anthropogenic activities, climatic v and loose institutional management. According to the FAO (2007), extent of forest cover of Pakistan in 2005 is 1,902,000 ha, which is 2.5% of its total land area. Annual change rate during 2000-2005 was -2.1% which is highest among all the countries in Asia. The Indus delta region contains the world's fifth-largest mangrove forest which provides a range of important ecosystem services, including coastal stabilisation, primary production and provision of nursery habitat for marine fish. Given their ecological importance in coastal settings, mangroves receive special attention in the assessment of conservation efforts and sustainable coastal developments.
Coastline of Pakistan is 1050km long shared by the provinces, Sind (350km) and Baluchistan (700 km). The coastline, with typical arid subtropical climate, possesses five significant sites that are blessed with mangroves. In the Sindh province, mangroves are found in the Indus Delta and Sandspit. The Indus Delta is host to the most extensive mangroves areas and extends from Korangi Creek in the West to Sir Creek in the East, whereas Sandspit is a small locality in the West of Karachi city. In the Balochistan province, mangroves are located at three sites, Miani Hor, Kalmat Khor and Jiwani.
Contemporary methods of Earth observation sciences are being incorporated as an integral part of environmental assessment related studies in coastal areas. GIS and Remote Sensing based technologies and methods are in use to map forest cover since the last two decades in Pakistan. The national level forest cover studies based upon satellite images include, Forestry Sector Master Plan (FSMP) and National Forest & Range Resources Assessment Study (NFRRAS). In FSMP, the mangrove forest extent was visually determined from Landsat images of 1988 - 1991, and was estimated to be 155,369 ha; whereas, in NFRRAS, Landsat images of 1997-2001 were automated processed and the mangroves areas was estimated to be 158,000 ha.
To our knowledge, a comprehensive assessment of current mangroves cover of Pakistan has not been made over the last decade, although the mangroves ecosystems have become the focus of intention in context of recent climate change scenarios. This study was conducted to support the informed decision making for sustainable development in coastal areas of Pakistan by providing up-to-date mangroves forest cover assessment of Pakistan.
Various types of Earth Observation satellite images and processing methods have been tested in relation to mangroves mapping. Most of the studies have applied classical pixel – based approached, there are a few studies which used object – based methods of image analysis to map the mangroves ecosystems. Object – based methods have the advantage of incorporating spatial neighbourhood properties and hierarchical structures into the classification process to produce more accurate surface patterns recognition compared with classical pixel – based approaches. In this research, we applied multi-scale hierarchical approach of object-based methods of image analysis to ALOS – AVNIR-2 images of the year 2008-09 to map the land cover in the mangroves ecosystems of Pakistan. Considering the tide height and phonological effects of vegetation, particularly the algal mats, these data sets were meticulously chosen. Incorporation of multi-scale hierarchical structures made it easy to effectively discriminate among the land cover classes, particularly the mudflats from sparse mangroves, at their respective scales.
ISPRS Archives XXXVIII- 8/W20; Workshop Proceedings: Earth Observation for Terrestrial Ecosystems
1. INTRODUCTION
Mangroves ecosystems consist of inter tidal flora and fauna found in the tropical and subtropical regions of the world. Mangroves forest is a collection of halophytic trees, shrubs, and other plants receiving inputs from regular tidal flushing and from freshwater streams and rivers. Mangroves serve several important functions, including the maintenance of coastal water quality, reduction in severity of storm, wave and flood damage, and as nursery and feeding areas for commercial and artisanal fishery species (Kuenzer et al., 2011). A global reduction of 25 % mangroves’ area has been observed since 1980 and it belongs to the most threatened and vulnerable ecosystems of the world (FAO, 2007).
Pakistan has 3.3 million ha covered by forests and planted trees, which is equivalent to 4.1% of the total land area (NFRRAS, 2004). Forest resources in Pakistan are deteriorating both qualitatively and quantitatively due to anthropogenic activities and climatic conditions as well as loose institutional arrangements. Extent of forest cover of Pakistan in 2005 is 1,902,000 ha, which is 2.5% of its total land area. Annual change rate during 2000-2005 was -2.1% which is highest among all the countries in Asia, and this valuable natural resource is under threat from severe deforestation (FAO, 2007). Nine distinct forest types are found in Pakistan which includes: Mangrove (Littoral and Swamp) forests, Sub-tropical broad-leaved evergreen forests, Sub-tropical pine forests, Himalayan moist temperate forests, Alpine scrub, Tropical dry deciduous forests, Tropical thorn forests, Himalayan dry temperate forests, and Sub-alpine forests.
In Pakistan, the Indus delta region contains the world's fifth-largest mangrove forest which provides a range of important ecosystem services, including coastal stabilisation, primary production and provision of nursery habitat for marine fish. Given their ecological importance in coastal settings, mangroves receive special attention in the assessment of conservation efforts and sustainable coastal developments. According to FAO (2007), the most recent and reliable estimate of mangroves cover area of Pakistan is 158,000 ha that was referred in 2001, another study estimates the mangroves cover as 157, 000 ha in 2005. FAO (2007) referred a list of national level studies on mangroves area estimates in Pakistan, according to that document, historic records of mangroves cover of Pakistan are; 380,000 ha in 1950 (BIMS, 1997), 400,000 ha in 1965 (Champion et al., 1965), 345,000 ha in 1980 (MFAC, 1981), 249,500 ha in 1983 (Saenger et al., 1983), 280,000 ha in 1984 (GoP, 1985), 283,000 ha in 1985 (Kogo, 1985), 250,233 ha in 1988 (Mirza et al., 1988), 207,000 ha in 1990 (MoE, 1992), 261, 720 ha in 1991 (UNESCO, 1992), 168,300 ha in 1993 (Splading et al., 1997), and 154,000 in 2000 (WRI, 2000).
Contemporary methods of Earth observation sciences are being incorporated as an integral part of environmental assessment related studies in coastal areas. In addition, remote sensing analyses allow the gathering of information in mangrove swamps, which are often unreachable due to logistical problems (Conchedda et al., 2008). GIS and Remote Sensing based technologies and methods are in use to map forest cover since the last two decades in Pakistan. The national level forest cover studies based upon satellite images include the Forestry Sector Master Plan (FSMP) and National Forest & Range Resources Assessment Study (NFRRAS). In FSMP (1992), the mangrove forest extent was visually determined from Landsat images of
1988 - 1991, and was estimated to be 155,369 ha; whereas, in NFRRAS (2004), Landsat images of 1997-2001 were automatically processed and the mangroves areas was estimated to be 158,000 ha.
To our knowledge, a comprehensive assessment of current mangroves cover of Pakistan has not been made over the last decade, although the mangroves ecosystems have become the focus of intention in context of recent climate change scenarios. This study was conducted to support the informed decision making for sustainable development in coastal areas of Pakistan by providing up-to-date mangroves forest cover assessment of Pakistan.
Various types of Earth Observation satellite images and processing methods have been tested in relation to mangroves mapping. Most of the studies have applied classical pixel – based approached, there are a few studies which used object – based methods of image analysis to map the mangroves ecosystems. Object – based methods have the advantage of incorporating spatial neighbourhood properties and hierarchical structures into the classification process to produce more accurate surface patterns recognition compared with classical pixel – based approaches. In this research we applied multi-scale hierarchical approach of object-based methods of image analysis to ALOS – AVNIR-2 images of the year 2008-09 to map the land cover in the mangroves ecosystems of Pakistan. Considering the tide height and phonological effects of vegetation, particularly the algal mats, these data sets were meticulously chosen. Incorporation of multi-scale hierarchical structures made it easy to effectively discriminate among the land cover classes, particularly the mudflats from sparse mangroves, at their respective scales.
2. STUDY AREA
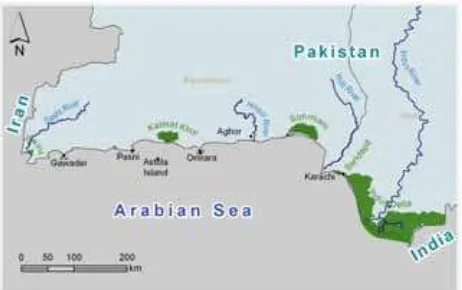
The coastline of Pakistan is 1,050 km long shared by the provinces of Sindh (350 km) and Balochistan (700 km). Mangroves mainly exist in five distinct sites including the Indus Delta, Sandspit, Miani Hor (Sonmiani Bay) , Kalmat Khor and Jiwani (Gawatar Bay) (Figure 1).
In the Sindh province, mangroves are found in the Indus Delta and Sandspit. The Indus Delta extends from Korangi Creek in the West to Sir Creek in the East, whereas Sandspit is a small locality in the West of Karachi city. In the Balochistan province, mangroves are located at three sites, Miani Hor (Sonmiani bay), Kalmat Khor and Jiwani (Gwadar bay). The coastal climate of Pakistan is a typical arid subtropical climate with a mean annual rainfall of 100 to 200mm. The main vegetation types existing in the study areas are different species of mangroves, Tamarix spp., different species of saltbushes, mixed terrestrial vegetation mainly Prosopis spp. and marine algae .
The creeks and mudflats are important areas for wintering, passing and summering shorebirds in Pakistan. More than 50,000 water birds such as waders, pelicans, flamingos, egrets, herons, gulls and terns are observed in mid winters. Raptors like Osprey, Shikra, Buzzard, Eagles, Brahminy Kite (Haliaster indus), besides passerines, are observed in the areas.
3. METHODS
3.1 Data acquisition
Satellite image processing of coastal areas is subjective to tide height, as it is a function of the time of the day, season and geographical locations. High tide values may impede visual interpretation and spectral analysis of mangroves covered in satellite imagery. Quantification of creek areas, mud flats, algal mats, mangroves cover, and saltbushes could vary its extent due to the variations in tide status. Seasonal variation of vegetation phonology is another factor that varies the extent and health of algae, as the reflectance of algae in tidal flats is subject to its phonology which is directly related to water temperature or moisture content and therefore may also obscure the quantification process of mangrove cover. Considering seasonal and tidal aspects, and image availability, multi-spectral satellite images of ALOS - AVNIR-2, were acquired (Table 1)
Figure 7: Mangroves Forest sites in Pakistan
In addition to satellite images, GIS layers containing topographic information such as administrative boundaries, populated places, creeks, roads, etc., were digitized from Survey of Pakistan (SoP) topographic sheets of 1:50,000 scale.
Table 1 : Description of Satellite Data Used
3.2 Pre-Processing of Satellite Images
The satellite images provided by the data distributors require further processing procedures in order to use them effectively. The electromagnetic radiation signals collected by satellites in the solar spectrum are modified by scattering and by absorption
of gases and aerosols while travelling through the atmosphere from the Earth’s surface to the sensor. The data processing sequence for classification of remotely sensed data is required to go through a number of pre-processing steps in which correction for atmospheric effects is often considered as a primary task before classification. However, Song et al., (2001) described that it is unnecessary to correct atmospheric affects prior to image classification if the spectral signature characterizing the desired land cover / land use classes are derived from the image to be classified.
The goal of image enhancement is to improve the visual interpretability of an image by increasing the apparent distinction between the features. The process of visually interpreting digitally enhanced imagery attempts to optimize the complementary abilities of the human mind and the computer. The mind is excellent at interpreting spatial attributes on an image and is capable of identifying obscure or subtle features (Lillesand et al., 2004). Due to inherent low contrast, the satellite data required enhancement for which different image enhancement algorithms are used. Keeping in view the subjective land cover, Histogram Equalize, Gamma Correction and Standard Deviation Stretch were used accordingly to increase inter-class and intra-class separability of land cover features for visual interpretation and extraction of particular information regarding different land cover classes
3.3 Ground Reference Information
It is essential, for land cover mapping, to verify satellite image interpretation with ground reference data. The main objective of field survey is to correlate the spectral patterns identified from the satellite images with ground reference informaion. In the present study, A3 and A2 sized field maps of satellite images in False Colour Composites (FCC) of NIR, Green and Red spectral bands were developed for field data collection activities at scales of 1:25,000; 1:75,000 and 1:50,000 with two Geographic grid intervals ranging from 20 sec to 1 minute. Garmin Map 76 GPS Receiver, digital camera and binocular were used to record ground control points and respective field observations. During the survey, spectral abnormalities identified from the satellite images were in the prime focus to be visited. Accessible localities were surveyed while the inaccessible areas were verified through the information from government officials and local communities. Ground reference data used in previous studies carried out by WWF – Pakistan (Ashraf et al, 2004; Saeed et al 2008) were also incorporated. In addition, the classification processes of the images were further validated by visual inspection of high resolution images available on the World Wide Web (2010 GoogleTM Earth). GoogleTM Earth combines different resolution images and updates them on a rolling basis (Conchedda et al., 2008).
3.4 Multi-scale Object-based Image Analysis for Land Cover Interpretation
The objective of classification is to generate spatially explicit generalizations that shows individual classes selected to represent different scales of land cover organization. Of all available ways of extracting information from the remote sensing data, image classification in particular is one of the best standard methodologies with the potential of being distilled into a protocol that can be extended spatially and temporally (Lillesand et al., 2004). The first and the most important step is the identification of classes that are to be mapped. Conventionally, the system would contain classes that are exhaustive and mutually exclusive. In a fuzzy system this
Satellite/Sensor Site Data of
Acquisition
Indus Delta 15/04/2008 1.3
ISPRS Archives XXXVIII- 8/W20; Workshop Proceedings: Earth Observation for Terrestrial Ecosystems
requirement can be relaxed, allowing intergradations of classes and mixed communities (Mather, 2004). Land cover/mangrove cover classes for the current assessment were compiled after an extensive review of similar studies.
In the present study multi-scale Object Based Image Analysis (OBIA) was performed to develop the satellite image based land cover maps of the study sites. OBIA has recently emerged as a promising methodology to extract objects of interest (or information) from satellite images. Unlike the conventional “pixel-based methods” which only use the layer pixel values, the “object-based techniques” can also incorporate shape, texture and contextual information of the image objects. These extra features associated with image objects have proved to be very useful to recognize surface objects (Abbas et al., 2010). Typically; an “Object Based Image Analysis” starts with a crucial step of Image Segmentation in which meaningful image objects are created and then these image objects are classified in the later step of classification (Blaschke, 2010).
In the present analysis the following steps of Definien Developer 7.0 (commercial software available for object based classification) were carried out throughout the process of land cover classification.
• Multi-resolution Segmentation • Hierarchical Classification • Classification based Segmentation
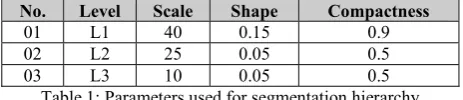
• Inspection of classification and Manual Editing Hierarchical network with three levels of image objects was created to extract the corresponding land cover features. Segmentation of the image data at fine and coarse scales is important in object-based multi-scale analysis in order to extract boundaries of the dominant objects occurring at corresponding scales. Image segmentation with various combinations of parameters (Scale, shape and compactness), was performed and analyzed. After a number of trials, three optimum scales were determined by visual inspection of segmentation results to construct image segmentation hierarchy (Table 2). Once appropriate scale factors were identified, the colour and shape criterion were modified to refine the shape of the image objects. Most published works have found that more meaningful objects are extracted with a higher weight for colour criterion.
No. Level Scale Shape Compactness
01 L1 40 0.15 0.9
02 L2 25 0.05 0.5
03 L3 10 0.05 0.5
Table 1: Parameters used for segmentation hierarchy From a plethora of image object attributes; ‘Mean Object Value’, relation to super object and hierarchy, were considered to be potential source of information for the classification procedures. In the present study, throughout the process of image analysis, subsequent steps of classification and segmentation algorithms were applied to perform hierarchical classification. At the end, misclassified and unclassified image object objects were manually classified.
To determine the degree of error in the end product (classification results), a ‘K x K’ confusion matrix’ was generated using ‘Definiens’. Sufficient ground survey information along with available high resolution images made it possible to manually select the test samples for accuracy
assessment. Result showed that an overall accuracy from 250 reference points was 83.2% (kappa value .7301; kappa variance .0029) which was considered acceptable for optical data in a semi-aquatic environment.
4 RESULTS AND DISCUSSIONS
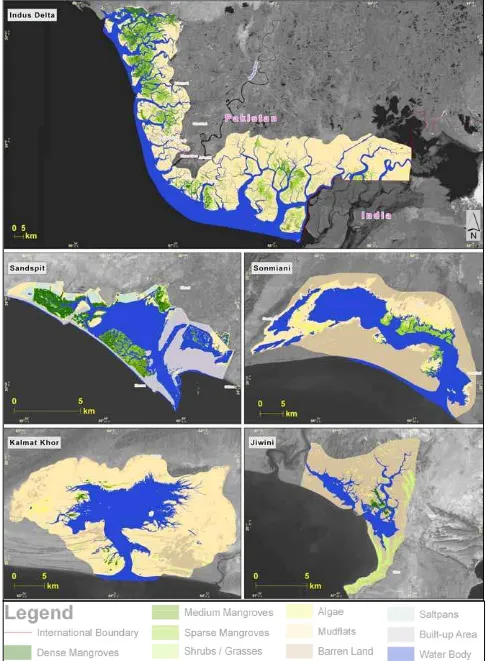
Land Cover maps for the five mangroves cover sites in Pakistan are prepared. Mangroves forest has been classified into 3 density classes, viz., Dense Mangroves (canopy cover > 70%), Medium Mangroves (canopy cover from 41 % to 70 %), and Sparse Mangroves (canopy cover < = 40 %). Considering the tide height and phonological effects of vegetation, particularly the algal mats, these land cover maps have been meticulously analysed (Figure 2). Incorporation of multi-scale hierarchical structures made it easy to effectively discriminate among the land cover classes, particularly the mudflats from sparse mangroves, at their respective scales.
Results of current image analysis (Table 3) deciphered that the overall mangroves cover of Pakistan is ~ 98,128 ha. Mangroves cover along the Indus Delta is estimated to be 92, 412 ha that is ~94.17 % of the total mangroves area of the country. 1,056 ha of the forest thrive in Sandspit, whilst the remainin 4,660 ha mangroves occurs along the Makran coast in 3 isolated pockets at Mian Hor (4,018 ha), Kalmat Khor (407 ha) and Jiwani (235 ha).
Table 2: Mangroves Cove Statistics of Pakistan
Site Name
Indus Delta 12679 13944 65789 92412
Miani Hori 283 738 2997 4018
ISPRS Archives XXXVIII- 8/W20; Workshop Proceedings: Earth Observation for Terrestrial Ecosystems
REFERENCES
Abbas, S., Qamer, F. M., Rana, A. D., Hussain, N., Saleem, R. 2010. Application of Object Based Image Analysis for Forest Cover Assessment of Moist Temperate Himalayan Forest in Pakistan. GEOBIA 2010 (June 29 – July 2), Ghent, Belgium. Ashraf, S., Nadeem, Q., Hasan, M. 2004. Mapping mangrove forest extent in a selected part of Indus delta. In: Identifying management and protection gaps using Landsat data. Forever Indus. In Proceedings of the consultative workshop on the Indus Delta Eco-region. WWF-Pakistan, Lahore
Blaschke, T. 2010. Object Based Image Analysis for Remote Sensing. ISPRS Journal of Phtogrammetry and Remote Sensing 65 , 2-16.
Conchedda, G., Durieux, L., Mayaux, P., 2008. An object-based method for mapping and change analysis in mangrove ecosystems. ISPRS Journal of Photogrammetry & Remote Sensing 63, 578–589.
FAO, 2007. The world’s mangroves 1980–2005. A thematic study prepared in the framework of the Global Forest Resources
Assessment 2005. FAO Forestry Paper 153. Food and Agriculture Organization of the United Nations, Rome, Italy. FSMP, 1992. Ministry of Environment (MoE). Pakistan Kuenzer, C., Bluemel, A., Gebhardt, S., Vo Quoc, T., Dech, S., 2011. Remote Sensing of Mangrove Ecosystems: A Review. Remote Sensing. 2011, 3, 878-928
Lillesand, T. M., Kiefer, R. W., Chipman, J. W., (2004). Remote sensing and image interpretation, fifth ed. John Wiley and Sons (Asia) Pte. Ltd., Singapore.
NFRRAS 2004. National Forest & Range Resources Assessment, Pakistan Forest Institute, Peshawar.
Saeed, U., Gilani H., Shehzad N. and Gill K. 2008. Remote Sensing based forest change trend analysis - a case study of mangrove forest of Keti Bunder, Indus Delta (Botanic Gardens Conference, Government College University, Lahore, Pakistan). Song, C., Woodcock, C. E., Seto, K. C., Lenney, M. P., Macombe, S. A. 2001. Classification and Change Detection Using Landsat TM Data: When and How to Correct Atmospheric Effects? Remote Sensing of Environment. 75:230–244