CHARACTERISATION OF INTENSITY VALUES ON TERRESTRIAL LASER
SCANNING FOR RECORDING ENHANCEMENT
M. Balaguer-Puig, A. Molada-Tebar, A. Marqués-Mateu, J. L. Lerma*
Department of Cartographic Engineering, Geodesy and Photogrammetry, Universitat Politècnica de València, Camino de Vera s/n, Building 7I, 46022 Valencia, Spain - [email protected], [email protected], (jllerma, amarques)@cgf.upv.es
KEY WORDS: Terrestrial Laser Scanning (TLS), Calibration, Colour, CIE colour spaces, Documentation, Archaeology, Rock Art
ABSTRACT:
Mapping surveys based on terrestrial laser scanning (TLS) are common nowadays for different purposes such as documentation of cultural heritage assets. The chance to extract relevant information from TLS surveys depends not only on the fast acquisition of XYZ coordinates, but also on the meaningful intensity values of the fired objects. TLS behaviour depends on several known factors such as distance, texture, roughness, colour and albedo. This paper seeks to find out the mathematical relationship between the TLS intensity values and the colorimetric data using a colour chart. In order to do so, objective colour specification based on well-known colour spaces is needed. The approach used here started with scanning a colour chart containing a number of colour patches with known chromatic and reflection characteristics. After several transformations, the results allowed us to characterise the intensity behaviour of a time-of-flight laser scanner. The characterisation of the intensity values are tested indoor on the colour chart and outdoor on an archaeological shelter. Promising results are obtained to enhance the behaviour of the intensity values coming from the TLS.
1. INTRODUCTION
Rock art conservation requires complete and exhaustive documentation, obtained from non-invasive techniques. For more than a century, two dimensional (2D) traditional techniques, such as drawing, tracing, rubbing or photography, have been the main tools used. However, thanks to digital breakthroughs, the use of 3D techniques is becoming more frequent. These techniques provide more detailed information, increase metric precision and allow users to document the rock art motifs, as well as the shapes and dimensions of the support. Three dimensional (3D) techniques should not be viewed as an alternative to 2D traditional techniques. Rather, they must be combined, so that we can benefit from the advantages that both techniques offer (Domingo et al., 2013).
Progress of terrestrial laser scanner has provided a new approach for the recording and modelling of rock art. TLS offers a series of advantages: measuring inaccessible areas, high operational speed, abundant measured points and accurate and high-resolution 3D models. Some case studies showing the effectiveness of using TLS applied to rock art documentation can be found in Marsoulas Cave (Fritz et al, 2016), Roc-aux-Sorciers (Bourdier at al, 2015), Parpalló Cave (Lerma et al., 2010) and Saltadora Cave (Cabrelles and Lerma, 2013).
Laser scanning is a technique of 3D data collection which has undergone significant development over the past years. Pfeifer and Briese (2007) described the principles and applications of laser scanning as well as the different types of instruments used in mapping. These instruments calculate distances between the scanner and the object by measuring the lapse of time between the emission of the laser beam and the detection of its echo. The amount of energy of the laser beam reflected by an object is recorded as a monochromatic reflectance, commonly known as intensity.
The information provided by a TLS consists of a cloud of 3D points representing the object's surface, together with the intensity at each point. TLS can be studied from different perspectives. Most of these studies focus on geometric data
quality, i.e. the quality of measured distances. The main factors which influence the data quality are the following ones: instrument calibration, atmospheric conditions, scanning geometry, and object's properties (Soudarissanane et al., 2009). Reshetyuk (2006) developed a TLS error model based on those factors and suggested a self-calibration methodology in order to detect and correct systematic errors of the instrument.
The reflecting properties of the scanned surfaces and their effects on the scanner measurements were studied by Litchie (2002) and Voegtle (2008, 2009). In the literature, some publications can be found concerning the relationships between the incidence angle of the laser beam, measured distance, and intensity value. The analysis of the measurements made on targets with known reflectivity resulted in a predictive model of the intensity as a function of object's reflectivity and incidence angle (Pfeifer et al, 2008, Kaasalaien et al, 2011, Tan et al., 2016).
The texture and colour of the observed objects are two factors which affect the scanning process. Buill et al. (2005, 2007) made some tests with a number of materials which differ in texture and colour. They also tested different operational parameters in the data collection such as laser scanning distance and orientation of the instrument. Clark and Robson (2005) made a similar experiment with a standardised colour chart. Voegtle et al. (2008, 2009) studied the geometric accuracy and the intensity data from scanned objects of different colours and materials.
The final results allow us to characterise the behaviour of the laser scanning instrument, which can be very useful when interpreting intensity images recorded by the laser scanner. In particular, it would be possible to correct intensity values. This is possible if a colour chart with known colour and reflectivity characteristics is scanned together with the object of interest. Moreover, enhancing the quality of the recording through TLS datasets is a request to deliver high quality deliverables, considering not only the metric part but also the spectral.
2. EXPERIMENT DESCRIPTION
2.1 Instrumentation
The Gretag Macbeth ColorChecker Chart (Figure 1) is used as colour reference. This chart contains 24 coloured patches with known chromaticity coordinates and is used for colour characterisation purposes namely in photography and graphic arts. The set of patches present in the chart covers the visible spectrum uniformly.
Figure 1. Gretag Macbeth ColorChecker Chart
The terrestrial laser scanning was performed with our Leica ScanStation 2. This instrument is a medium speed TOF laser scanner that integrates a dual-axis compensation and a low-resolution colour digital camera. This old fashion but still valid panoramic (360º H x 270º V field-of-view) laser scanner is able to achieve survey-grade accuracy for each point at 134 m (considering 18% albedo). The dominant colour of the scanner is green with a wavelength of 532 nm.
All the colour measurements were performed with the CS-100A chroma meter by Konika Minolta. This colour meter provides chromatic coordinates xy together with luminance values Y in what is known as the CIE xyY colour space. The CS-100A allows non-contact measurements of both reflective objects and light sources. It is worth noting that this mode of measurement takes into account the ambient illumination. As it is well-known, different illuminations can lead to different measurement values. Although the documentation of the colour chart included colour coordinates for every patch, we made our own colour measurements to match actual conditions as close as possible.
The data collection was carried out in an isolated room with artificial light. The colour chart was placed on the wall surface at a height of 1.5 m. The laser scanner was placed at a distance of 3 m from the wall at the same height than the colour chart so that the geometry of the measurements was perpendicular to the centre of the colour chart. The laser scanning spatial resolution was fixed at 1 x 1 mm. We made two laser scannings, the first with ambient illumination provided by fluorescent tube light bulbs, and the second under darkness conditions. Both laser scanning measurements were made under the same standard environmental conditions, i.e. temperature and relative humidity. In the experiment, the angle of incidence was not taken into account due to the orthogonality of the measurements.
The last step was to measure the chromaticity coordinates xy and the luminance Y of the colour patches. These measurements were made with the same geometric and environmental conditions as the first laser scanning with the lights on. The actual measurement targets were the 24 centres of the colour patches.
2.2 Data processing
The laser scanning process provided two point clouds of the colour chart. The preliminary point cloud processing was accomplished with the Leica Cyclone processing software. First, each point cloud was segmented in order to obtain 24 smaller subclouds corresponding to each colour patch. These subclouds were made up of 400 points each. Second, the subclouds were exported to PTX format for subsequent processing. We preferred PTX over other data formats since it is a simple exchange format which exports RAW matrix information without any a priori geometric transformation in ASCII format. A PTX file consists of a basic header followed by a sequence of rectangular XYZ coordinates of each point together with the corresponding intensity value plus the colour values from the internal camera of the laser scanner. The units of the point cloud coordinates (XYZ) are in meters in the instrument's local reference system, whereas intensity values are scaled to a range of [0, 1], and the colour values from [0, 255]. After the preliminary data processing, the mean, minimum, maximum, standard deviation, and variance values were computed for the distance and intensity values for each point cloud from the data files.
Several well-known colour spaces were used in this study. As mentioned above, the colorimeter used to measure colour coordinates provides coordinates in the so-called CIE xyY colour space. This space combines chromaticity coordinates xy with luminance Y. This colour space has the practical disadvantages of not being uniform or perceptual. In order to avoid this disadvantage, the coordinates were transformed as follows.
First, the CIE xyY coordinates were transformed into CIE XYZ tristimulus values using the standard formulas:
X=x·Y/y
Y=Y
Z=(1-x-y)·Y/y
(1)Then, the CIE XYZ tristimulus values were transformed to CIELAB coordinates. The formulas can be found in the CIE report (CIE, 2004): are the tristimulus values of the reference white (Johnson, 2003).
Finally, the CIELAB coordinates were converted into the CIELCh colour scale (CIE, 2004):
Both the CIELAB colour space and the CIELCh colour scale are considered as uniform colour spaces. However, the CIELCh scale was used in our study since it provides correlates of the human visual attributes of lightness (L*), chroma (C*) and hue (h).
The whole set of numerical values in the CIELCh scale is suitable to find out the relationships between the laser scanner data and the object’s colour mentioned above.
3. RESULTS
3.1 Relationship between intensity and colour
First, the numerical values of both intensity and distance for the 24 patches were compared under both illumination conditions. It was verified that signal intensity as well as distance values do not vary significantly, that is, the results of the laser scanning process are not altered by environmental illumination conditions (Figure 2) in close range scenarios. It can be stated that indoor illumination such as the one used with bulb tube lighting in our study does not modify the reflective characteristics of the objects fired by the ToF laser scanner.
Figure 2. Intensity values for the two laser scannings acquired with a Leica ScanStation 2.
Second, the analysis of colour data together with intensity data was carried out. The theoretical xyY values of the colour patches (which are supplied with the colour checker) were compared to our measured values. The mean differences between those two datasets were about 7%, mainly due to different illumination conditions existing in our experiment, compared with those used for obtaining the theoretical values.
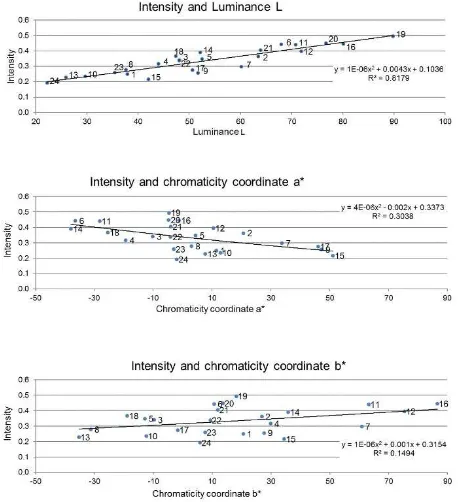
The relationship between the scanned mean intensity values and the colorimetric coordinates was of special interest in this study. The data from the 24 patches in the colour checker were used in order to establish whether or not such a relationship exists.
The experimental trend lines were achieved for the whole dataset. The best fitting second degree polynomial functions were chosen to model the experimental data (Figure 3). The most evident relationship was between intensity and luminance (CIE Y coordinate), since luminance is roughly proportional to light energy detected by the ToF laser scanner.
The trend lines in CIELab and CIELCH colour spaces were also obtained after transforming xyY coordinates (Figures 4 and 5). These transformations allowed us to choose the best colour space to represent the intensity-colour relationships.
It can be checked that neutral samples behave differently than chromatic samples (Figure 6). This is the expected behaviour from a physical viewpoint since colours next to the neutral axis
have chromas near to zero. In those colours, small variations in the position of the sample on the a*b* plane can lead to large differences in hue. This clearly suggests separating the whole set of samples in two groups corresponding to neutral and chromatic samples in order to characterise the laser scanner system. Figure 3. Relationship between intensity and CIE xyY
coordinates
4. CASE STUDY
4.1 Application of the transformations to the ColorChecker Chart point cloud
Once the relationship between the laser scanning intensity values with the Y-CIE coordinate has been established, the idea is to apply the second order polynomial equation calculated on the ColorChecker Chart to the cloud point. It allows us to characterise (i.e. correct properly) the laser intensity value according to the luminance.
The polynomial equation obtained from the laser and the colorimetric data set was:
Y = 821.696 i2−370.899 i + 51.318 (4)
where Y = Luminance (Y CIE) i = laser intensity
In order to check and validate the model and its adjustment, the fitting residuals have been analysed. Randomness and normality around zero in the fitting residuals can be appreciated. Table 1 shows the maximum and minimum residual values obtained, as
well as the root mean square error (RMSE) and the R2. A mean RMSE of 7.29 (in a range of 0-100 in the response variable) and a R2 value of 85% indicate a suitable adjustment error.
Min. Residual
Max. Residual
RMSE R2
-11.623 14.648 7.293 0.8555
Table 1. Least squares adjustment summary
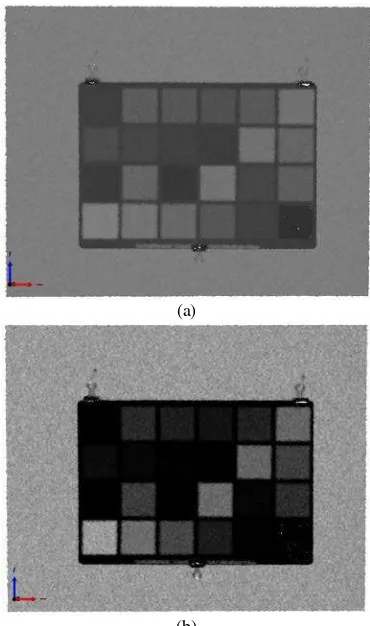
Finally, the initial intensity values measured by the laser scanner in the ColorChecker Chart are compared with the correct intensity values after the characterisation. A substantial change is observed after the correction of the intensity values. The initial intensity values of the colour patches are homogeneous (i.e. present a low contrast) and there is hardly any difference among the different patches (Figure 7a). After the characterisation, the difference among colour patches is more noticeable (Figure 7b).
(a)
(b)
Figure 7. ColorChecker Chart: a) Initial intensity values of the point cloud; b) final corrected intensity values after the overall characterisation
4.2 Application to an outdoor cloud point targeting a rock art site
The application takes as input data a point cloud corresponding to an archaeological rock art site. The case study concentrates on a Levantine rock art shelter in Remigia Cave (Spain). This cave is considered part of a UNESCO World Heritage Site. TLS survey was also undertaken with the aforementioned Leica ScanStation 2. Point cloud data were exported to PTX as stated before.
Figure 5. Relationship between intensity and CIE chromatic coordinates C* h*
Just as we did with the ColorChecker Chart point cloud, a polynomial equation was applied to correct the initial intensity values. The result of the transformation is displayed in Figure 8, where initial and processed data after the characterisation are presented.
(a)
(b)
(c)
Figure 8. Partial Remigia Cave point cloud: a) Initial intensity values; b) Corrected intensity values; c) Corrected intensity image with histogram stretch
It is observed that, although the values of intensity after the characterisation are darker than the initial values of intensity, it is possible to observe how the corrected intensity values can be used to obtain a better contrast of the cave features. The characterisation procedure is not intended to obtain a clearer or sharper scene. Instead, the objective is to characterise the response of the laser intensity to the patches of the colour chart used, improving the physics of the signal recorded originally.
In fact, details that were unnoticed with the initial intensity values such as alterations or damages on the support (Figure 9a) are now enhanced (Figure 9b) and allow a better discrimination of features. In addition, in order to improve the visual interpretation of the scene, we can apply enhancement techniques to the point cloud intensities, such as histogram equalisation, or directly process the correct intensity histograms of the laser values. This way, we get an even clearer scene where a better discrimination of the cave features is possible (Figures 8c, 9c). However, regardless of the enhancement operations applied to the point clouds, all the intensity computations must be done with the characterised images (Figures 8b and 9b).
(a)
(b)
(c)
5. DISCUSSION
TLS is one of the most frequently used techniques for 3D data acquisition over the last few decades. This technique shows a great potential in cultural heritage documentation since it is a non-destructive technique that allows researchers to acquire a huge number of data points with high accuracy and quick acquisition.
The intensity data recorded by TLS can be applied to detect damage in historical buildings (Armesto-González et al., 2010) as well as pathologies in façades (García-Talegón et al., 2015). It is evident then the importance of the intensity values recorded by the terrestrial laser scanner is also relevant in both rock art recording and documentation.
Several studies show that it is possible to correct the intensity values acquired with a laser scanner. The study by Fang et al. (2015) showed that the corrections of the range and angle effects on TLS intensity data, based on the estimation of laser transmission functions, are possible.
The intensity values of TLS are recorded as digital numbers and represent laser returns proportional to the number of photons impinging on the detector. Therefore, the relationship between intensity data from laser scanner and luminance (Y CIE) has been properly established.
However, we have not found any study that corrects the laser intensity values from the known tristimulus coordinates existing in a Colour Chart. Vaaja et al. (2015) used a combination of luminance imaging and 3D point cloud acquired with a terrestrial laser scanner to evaluate night-time road lighting conditions.
Finally, we would like to note that the influence of the material on the intensity values recorded by the laser scanner was not detected in this study. The materials present in the cave are geologically homogeneous, predominantly calcareous, so the a priori reflectivity will not yield disparate values or different responses. It should be taken into account in scenes where the materials found are heterogeneous, which may influence the registered signal. It is expected to obtain substantial improvements in other cultural heritage applications where there is greater heterogeneity of materials, such as wood, metals or paintings.
6. CONCLUSIONS
This paper faced the characterisation of the ToF TLS through the usage of the colour chart. In particular, the results of the Leica ScanStation 2 characterisation allow us to confirm that the behaviour of the scanned intensity values exhibits good agreement with measured luminance (Figure 3).
Colorimetric coordinates, either as xy chromatic coordinates or as a*b* CIELAB coordinates, exhibit an erratic behaviour. It seems clear that these two colour spaces are not suitable to model the laser scanner behaviour with respect to the colour of the scanned objects. Nevertheless, the CIELCH space is confirmed that provides a more convenient framework for characterisation of ToF TLS systems.
The two colour perceptual variables, i.e. chroma and hue, have a better-defined behaviour. The relationship of intensity with respect to both variables can be conveniently modelled with second and third degree polynomials.
It can be seen that hue variable values adjust scarcely well to the data. The chroma variable shows a less precise adjustment to the data than hue (Figure 5). Given these circumstances, it seems clear that hue, which represents the main perceptual attribute in human colour vision, is the most important variable in this study, apart from the well-correlated luminance. Additional efforts in subsequent studies must be focused on this variable.
The evident relationship between the laser intensity values and the luminance (Y CIE) allows us to correct the intensity values. This correction increases contrast and allows a better definition of the details, compared to the initial intensity values. It can be quickly confirmed after displaying both case studies, the one with the indoor colour chart and the other tackling the rock art recording.
Regarding the role of lighting conditions in the final results, from the indoor and outdoor laser measurements, we can conclude that the illumination does not influence intensity values captured by the laser. Thus, no artificial illumination is required (Figure 2).
The initial objective consisting of improving laser intensity signals has been reached. The methodology applied for rock art is adequate, and it can be extended to other applications related to heritage documentation in which it would be interesting to analyse the influence of the different materials on the intensity of the signal captured by the laser scanner.
A logical continuation of this work will be the rigorous correction of measured distances as a function of object’s colour, range and orientation. For this purpose, the experiment setup should be slightly modified.
ACKNOWLEDGEMENT
The authors gratefully acknowledge the support from the Spanish Ministerio de Economía y Competitividad to the project HAR2014-59873-R.
REFERENCES
Armesto-González, J., Riveiro-Rodríguez, B., González-Aguilera, D. and Rivas-Brea, M.T., 2010. Terrestrial Laser Scanning Intensity Data Applied to Damage Detection for Historical Buildings. Journal of Archaeological Science, 37(12), pp. 3037–47.
Bourdier, C., Fuentes, O. and Pinçon, G., 2015. Contribution of 3D Technologies to the Analysis of Form in Late Palaeolithic Rock Carvings: The Case of the Roc-Aux-Sorciers Rock-Shelter (Angles-Sur-l’Anglin, France). Digital Applications in Archaeology and Cultural Heritage, 2(2–3) , pp. 140–54 .
Buill, F., Núñez, A., Marambio, A. Estudio de la calidad de la medida con láser escáner. 7ª Semana Geomática, 2007, Barcelona.
Cabrelles, M. and Lerma, J.L., 2013. Documentación 3D de abrigos rupestres a partir de láser escáner y de procesos fotogramétricos automatizados. Virtual Archaeology Review, 4(8), pp. 64-68.
CIE. Colorimetry. CIE Publication No. 15. Vienna: CIE Central Bureau; 2004 (3rd Edition).
color. ISPRS XX Congress. Estambul. Survey Review, 37(294), pp. 626-638.
Domingo, I., Villaverde, V. López-Montalvo, E., Lerma, J.L., and Cabrelles, M., 2013. Latest developments in rock art recording: towards an integral documentation of Levantine rock art sites combining 2D and 3D recording techniques. Journal of Archaeological Science, 40(4), pp. 1879-1889.
Fang, W., Huang, X. Zhang, F. and Li, D., 2015. Intensity correction of terrestrial laser scanning data by estimating laser transmission function. IEEE Transactions on Geoscience and Remote Sensing, 53(2), pp. 942-951.
Fritz, C., Willis, M.D. and Tosello, G., 2016. Reconstructing Palaeolithic cave art: The example of Marsoulas Cave (France). Journal of Archaeological Science: Reports, 10, pp. 910-916.
Höfle, B. and Pfeifer, N., 2007. Correction of laser scanning intensity data: Data and model-driven approaches. ISPRS Journal of Photogrammetry and Remote Sensing, 62(6), pp.415-433.
Johnson, G.M., Fairchild, M.D. Visual Psychophysics and Color Appearance, in: CRC Digital Color Imaging Handbook, 2003.
Kaasalaien, S., Jaakkola, A., Kaasalaien, M., Krooks, A. and Kukko, A., 2011. Analysis of Incidence Angle and Distance Effects on Terrestrial Laser Scanner Intensity: Search for Correction Methods. Remote Sensing, 3(10), pp. 2207-2221.
Lerma, J.L., Navarro, S., Cabrelles, M. and Villaverde, V., 2010. Terrestrial laser scanning and close range photogrammetry for 3D archaeologicaldocumentation: the Upper Palaeolithic Cave of Parpalló as a case study. Journal of Archaeological Science, 37(3), pp. 499-507.
Lichti, D. D. and Harvey, B. R., 2002. The effects of reflecting surface material properties on time-of-flight laser scanner measurements. Symposium on Geospatial Theory, Processing and Applications, Ottawa. On CD-ROM. 9 pages.
Núñez, A., Buill, F., and Muñoz, F. 2005. Comportamiento de un sensor láser escáner. 6ª Semana Geomática, 2005. Barcelona.
Pfeifer, N., and Briese, Ch., 2007. Laser Scanning – principles and Applications. 3rd International Exhibition & Scientific Congress on Geodesy, Mapping, Geology, Geophysics, Cadastre GEO-SIBERIA 2007, Novosibirsk, Russia, pp. 1-20.
Pfeifer, N., Hofle, B., Briese, C., Rutzinger, M. and Haring, A., 2008. Analysis of the backscattered energy in Terrestrial Laser Scanning data. The International Archives of Photogrammetry, Remote Sensing and Spatial Information Science, 37, pp. 1045-1052.
Reshetyuk, J., 2006. Investigation and calibration of pulsed time-of-flight terrestrial laser scanners. PhD-thesis, Royal Institute of Technology (KTH), Department of Transport and Economics, Division of Geodesy, Stockholm.
Soudarissanane, S.; Lindenbergh, R.; Menenti, M.; and Teunissen, P., 2009. Incidence angle influence on the quality of terrestrial laser scanning points. The International Archives of the Photogrammetry, Remote Sensing and Spatial Information Sciences, 38(3/W8), pp. 183-188.
Tan, K. and Cheng, X., 2016. Correction of Incidence Angle and Distance Effects on TLS Intensity Data Based on Reference Targets. Remote Sensing, 8(3), pp. 251.
Vaaja, M. T., Kurkela, M., Virtanen, J. P., Maksimainen, M., Hyyppä, H., Hyyppä, J., and Tetri, E. 2015. Luminance-corrected 3D point clouds for road and street environments. Remote Sensing, 7(9), pp. 11389-11402.
Voegtle T, Schwab I, Landes T., 2008. Influences of different materials on the measurement of a Terrestrial Laser Scanner (TLS). The International Archives of the Photogrammetry, Remote Sensing and Spatial Information Sciences, 37(B5), pp. 1061-1066.